


Matplotlib是Python中的一个库,它是数字的-NumPy库的数学扩展。 Figure模块提供了顶层Artist,即Figure,其中包含所有绘图元素。此模块用于控制所有图元的子图和顶层容器的默认间距。
matplotlib.figure.Figure.text()方法
matplotlib库的text()方法图形模块用于向图形添加文本。
用法:text(self, x, y, s, fontdict=None, withdash=, **kwargs)
参数:此方法接受下面讨论的以下参数:
x:此参数是放置文本的x位置。
y:此参数是放置文本的y位置。
s:此参数是文本字符串。
fontdict:此参数是用于覆盖默认文本属性的字典。
withdash:此参数用于创建TextWithDash实例而不是Text实例。
返回值:此方法返回Text。
以下示例说明了matplotlib.figure中的matplotlib.figure.Figure.text()函数:
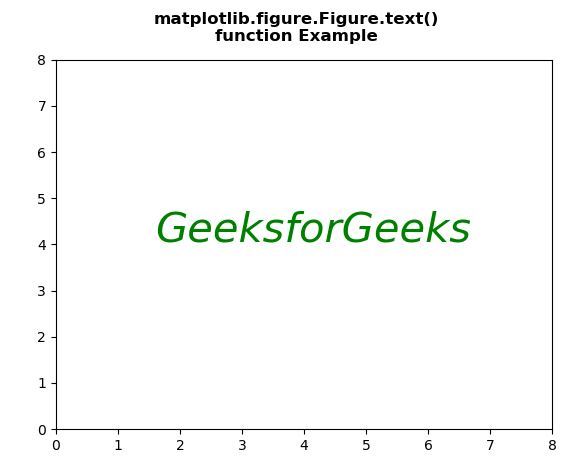
范例1:
#Implementation of matplotlib function
import matplotlib.pyplot as plt
fig, ax = plt.subplots()
fig.text(0.28, 0.5,
'GeeksforGeeks',
style = 'italic',
fontsize = 30,
color = "green")
ax.set(xlim = (0, 8),
ylim = (0, 8))
fig.suptitle("""matplotlib.figure.Figure.text()
function Example\n\n""",fontweight="bold")
fig.show()
输出:
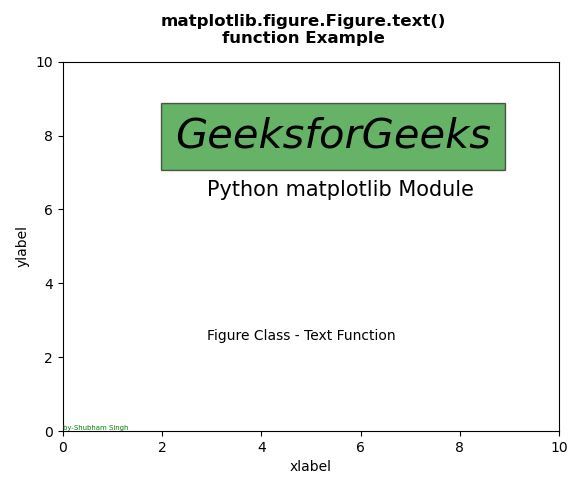
范例2:
# Implementation of matplotlib function
import matplotlib.pyplot as plt
fig, ax = plt.subplots()
ax.set_xlabel('xlabel')
ax.set_ylabel('ylabel')
fig.text(0.3, 0.7,
'GeeksforGeeks',
style = 'italic',
fontsize = 30,
bbox ={'facecolor':'green',
'alpha':0.6,
'pad':10})
fig.text(0.35, 0.6,
'Python matplotlib Module',
fontsize = 15)
fig.text(0.35, 0.3,
'Figure Class - Text Function')
fig.text(0, 0, 'by-Shubham Singh',
verticalalignment ='bottom',
horizontalalignment ='left',
transform = ax.transAxes,
color ='green',
fontsize = 5)
ax.set(xlim =(0, 10), ylim =(0, 10))
fig.suptitle("""matplotlib.figure.Figure.text()
function Example\n\n""", fontweight ="bold")
fig.show()
输出:


 1万+
1万+


 被折叠的 条评论
为什么被折叠?
被折叠的 条评论
为什么被折叠?
 到【灌水乐园】发言


