


写在前言
鉴于国产和开源化的兴起,Oracle新特性系列更新完后,数据库方面下一步着重更新的内容为:PG 和 MySql。
部分内容摘自官方文档:
https://docs.oracle.com/database/121/ARPLS/d_sql_monitor.htm#ARPLS74782
Real-Time SQL Monitoring
Introduced in Oracle Database 11g, Real-Time SQL Monitoring, provides a very effective way to identify run-time performance problems with resource intensive long-running and parallel SQL statements. Interactive Enterprise Manager screens display details of SQL execution using new, fine-grained SQL statistic that are tracked out-of-the-box with no performance penalty to production systems. Statistics at each step of the execution plan are tracked by key performance metrics, including elapsed time, CPU time, number of reads and writes, I/O wait time and various other wait times. This allows DBAs to analyze SQL execution more deeply than previously possible and decide on the most appropriate tuning strategies for monitored SQL statements.
在Oracle Database 11g中,系统自动监控符合以下条件的SQL,并收集执行时的细节信息:采用并行方式执行,或者单次执行消耗的CPU或者IO超过5秒。
Real-Time Database Operations Monitoring
Real-time database operations monitoring allows database administrators to easily monitor and troubleshoot performance problems in long running jobs. This feature helps make long running database operations like a batch job, an ETL (extraction, loading, and transformation) operation, or a scheduler job, transparent so that administrators can see exactly what the operation is doing and at what time. It does this by tracking the SQL and PL/SQL commands that make up a database operation along with their time lines.
实时数据库操作监视允许数据库管理员轻松地监视和解决长时间运行作业中的性能问题。此功能有助于使长时间运行的数据库操作(如批处理作业、ETL(提取、加载和转换)操作或调度程序作业)变得透明,以便管理员可以确切地看到操作正在执行的操作以及操作的时间。它通过跟踪组成数据库操作的SQL和PL/SQL命令及其时间线来实现这一点。
Enabling Monitoring of Database Operations
Real-time database operations monitoring is enabled by default when the STATISTICS_LEVEL initialization parameter is either set to TYPICAL (the default value) or ALL. Because database operations monitoring is a feature of the Oracle Database Tuning Pack, the CONTROL_MANAGEMENT_PACK_ACCESS parameter must be set to DIAGNOSTIC+TUNING (the default value).
默认上开启的,会自动监控长时间运行的查询。statistics_level需要设置为TYPICAL(默认值)或ALL。但是前提条件CONTROL_MANAGEMENT_PACK_ACCESS必须是DIAGNOSTIC+TUNING(默认值)。
SQL> show parameter statistics_levelNAME TYPE VALUE------------------------------------ ----------- ------------------------------client_statistics_level string TYPICALstatistics_level string TYPICALSQL> show parameter control_management_pack_accessNAME TYPE VALUE------------------------------------ ----------- ------------------------------control_management_pack_access string DIAGNOSTIC+TUNING在11G中,Real-Time SQL Monitoring可以让你监控单个SQL或PL-SQL的执行情况。从12c开始,提供了实时监控更为复杂的操作。12c中,Real-time database operations该特性允许你监控混合的操作包括一些SQL和PL/SQL。通过DBMS_SQL_MONITOR这个包去实现。
通过BEGIN_OPERATION 和 END_OPERATION存储过程去标识监控的开始和结束。
DBMS_SQL_MONITOR
The DBMS_SQL_MONITOR package provides information about Real-time SQL Monitoring and Real-time Database Operation Monitoring.
The DBMS_SQL_MONITOR package provides information about Real-time SQL Monitoring and Real-time Database Operation Monitoring. These features provide automatic monitoring of SQL statements, PL/SQL blocks, or composite database operations that are considered expensive. A simple database operation is a single SQL statement or PL/SQL procedure or function. A composite database operation is activity between two defined points in time in a database session. The monitored data is collected in V$SQL_MONITOR and V$SQL_PLAN_MONITOR.
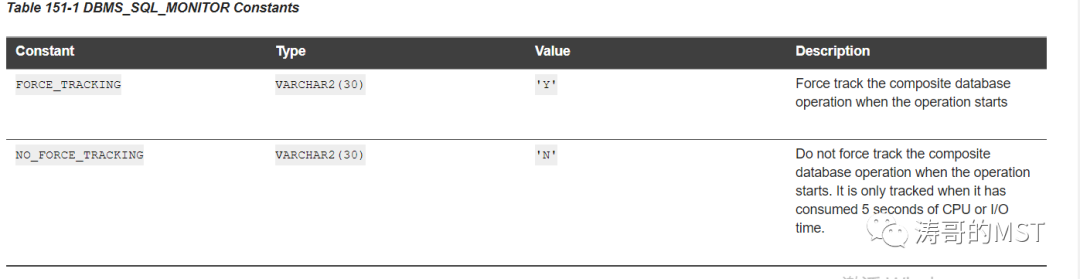
释义:
FORCE_TRACKING:操作开始时强制跟踪复合数据库操作
NO_FORCE_TRACKING:操作开始时,不要强行跟踪复合数据库操作。仅在消耗5秒钟的CPU或I / O时间时才进行跟踪。
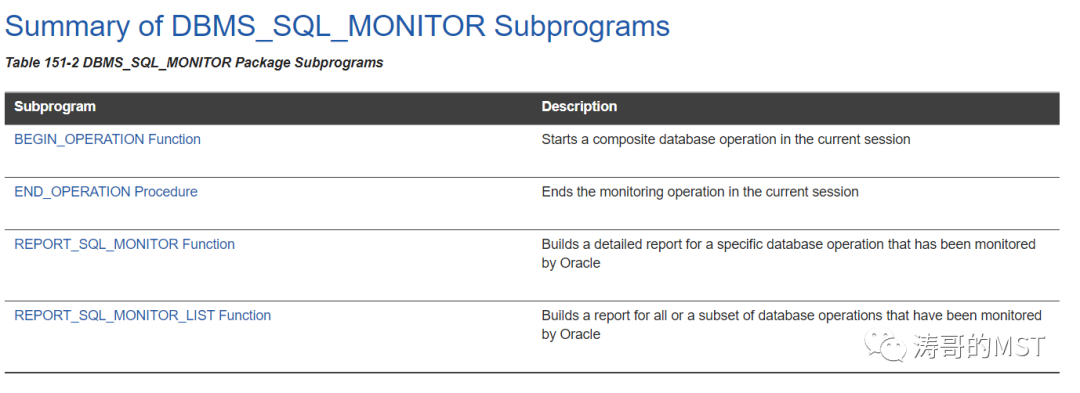
释义:
BEGIN_OPERATION Function :在当前会话中启动复合数据库操作
END_OPERATION Procedure :结束当前会话中的监视操作
REPORT_SQL_MONITOR Function :为Oracle监视的特定数据库操作构建详细的报告
REPORT_SQL_MONITOR_LIST Function :为Oracle监视的全部或部分数据库操作生成报告
BEGIN_OPERATION Function
DBMS_SQL_MONITOR.BEGIN_OPERATION (
   dbop_name       IN VARCHAR2,
   dbop_eid        IN NUMBER   := NULL,
   forced_tracking IN VARCHAR2 := NO_FORCE_TRACKING,
   attribute_list  IN VARCHAR2 := NULL)
  RETURN NUMBER;
END_OPERATION Procedure
DBMS_SQL_MONITOR.END_OPERATION  (
   dbop_name       IN VARCHAR2,
   dbop_eid        IN NUMBER)
  RETURN NUMBER;
REPORT_SQL_MONITOR Function
DBMS_SQL_MONITOR.REPORT_SQL_MONITOR (
   sql_id                    IN VARCHAR2 DEFAULT  NULL,
   dbop_name                 IN VARCHAR2 DEFAULT  NULL,
   dbop_exec_id              IN NUMBER   DEFAULT  NULL,
   session_id                IN NUMBER   DEFAULT  NULL,
   session_serial            IN NUMBER   DEFAULT  NULL,
   sql_exec_start            IN DATE     DEFAULT  NULL,
   sql_exec_id               IN NUMBER   DEFAULT  NULL,
   inst_id                   IN NUMBER   DEFAULT  NULL,
   start_time_filter         IN DATE     DEFAULT  NULL,
   end_time_filter           IN DATE     DEFAULT  NULL,
   instance_id_filter        IN NUMBER   DEFAULT  NULL,
   parallel_filter           IN VARCHAR2 DEFAULT  NULL,
   plan_line_filter          IN NUMBER   DEFAULT  NULL,
   event_detail              IN VARCHAR2 DEFAULT  'YES',
   bucket_max_count          IN NUMBER   DEFAULT  128,
   bucket_interval           IN NUMBER   DEFAULT  NULL,
   base_path                 IN VARCHAR2 DEFAULT  NULL,
   last_refresh_time         IN DATE     DEFAULT  NULL,
   report_level              IN VARCHAR2 DEFAULT 'TYPICAL',
   type                      IN VARCHAR2 DEFAULT 'TEXT',
   sql_plan_hash_value       IN NUMBER   DEFAULT  NULL,
   con_name                  IN VARCHAR2 DEFAULT  NULL)
  RETURN CLOB;
REPORT_SQL_MONITOR_LIST Function
DBMS_SQL_MONITOR.REPORT_SQL_MONITOR_LIST (
   sql_id                    IN VARCHAR2 DEFAULT  NULL,
   dbop_name                 IN VARCHAR2 DEFAULT  NULL,
   monitor_type              IN NUMBER   DEFAULT  MONITOR_TYPE_ALL,
   session_id                IN NUMBER   DEFAULT  NULL,
   session_serial            IN NUMBER   DEFAULT  NULL,
   inst_id                   IN NUMBER   DEFAULT  NULL,
   active_since_date         IN DATE     DEFAULT  NULL,
   active_since_sec          IN NUMBER   DEFAULT  NULL,
   last_refresh_time         IN DATE     DEFAULT  NULL,
   report_level              IN VARCHAR2 DEFAULT 'TYPICAL',
   auto_refresh              IN NUMBER   DEFAULT  NULL,
   base_path                 IN VARCHAR2 DEFAULT  NULL,
   type                      IN VARCHAR2 DEFAULT 'TEXT',
   con_name                  IN VARCHAR2 DEFAULT  NULL)
  RETURN CLOB;
注:具体释义详见官方文档说明
示例部分
监控:
SQL> VARIABLE DBOP_EID NUMBER;SQL> EXEC :DBOP_EID:=DBMS_SQL_MONITOR.BEGIN_OPERATION(DBOP_NAME =>'DB_OP',DBOP_EID=>:DBOP_EID,FORCED_TRACKING=>DBMS_SQL_MONITOR.FORCE_TRACKING);PL/SQL 过程已成功完成。SQL>查看被监控的操作:
SQL> CONN / AS SYSDBA;已连接。SQL>SQL>SQL> SET LINESIZE 200SQL> SELECT DBOP_NAME,DBOP_EXEC_ID,STATUS FROM V$SQL_MONITOR WHERE USERNAME='MSTTEST';DBOP_NAME DBOP_EXEC_ID STATUS------------------------------ ------------ -------------------DB_OP 1 DONEREPORT_SQL_MONITOR:
SQL> SET LONG 1000000SQL> SET LONGCHUNKSIZE 1000000SQL> SET LINESIZE 1000SQL> SET PAGESIZE 0SQL> SET TRIM ONSQL> SET TRIMSPOOL ONSQL> SET ECHO OFFSQL> SET FEEDBACK OFFSQL> SPOOL E:\app\report_sql_monitor.htmSQL> select dbms_sql_monitor.report_sql_monitor(dbop_name=> 'DB_OP',type=>'HTML',report_level=>'ALL') AS REPORT FROM DUAL;SQL> SPOOL OFF;REPORT_SQL_MONITOR_LIST:
SET LONG 1000000
SET LONGCHUNKSIZE 1000000
SET LINESIZE 1000
SET PAGESIZE 0
SET TRIM ON
SET TRIMSPOOL ON
SET ECHO OFF
SET FEEDBACK OFF
SPOOL  SPOOL E:\app\report_sql_monitor_list.htm
SELECT DBMS_SQL_MONITOR.report_sql_monitor_list(
  type         => 'HTML',
  report_level => 'ALL') AS report
FROM dual;
SPOOL OFF


 825
825


 被折叠的 条评论
为什么被折叠?
被折叠的 条评论
为什么被折叠?
 到【灌水乐园】发言


