引言
Matplotlib是Python的画图领域使用最广泛的绘图库,它能让使用者很轻松地将数据图形化以及利用它可以画出许多高质量的图像,是用Python画图的必备技能。对于这个教程,大家最好亲自码一遍代码,这样可以更有收获。
前面的课程:
Python进阶之Matplotlib入门(一)
Python进阶之Matplotlib入门(二)
Python进阶之Matplotlib入门(三)
概要
1、掌握spine函数,学会通过设置颜色注释掉一些边;
2、掌握spine函数,学会通过设置位置改变坐标轴位置;
3、掌握legend函数,学会给不同的线做标注来区分。
图的脊柱spine
坐标轴线和上面的记号连在一起就形成了脊柱(英文叫Spines,一条线段上有一系列的刻度,是不是很像脊柱骨啊),它记录了数据区域的范围。它们可以放在任意位置,不过至今为止,我们都把它放在图的四边。
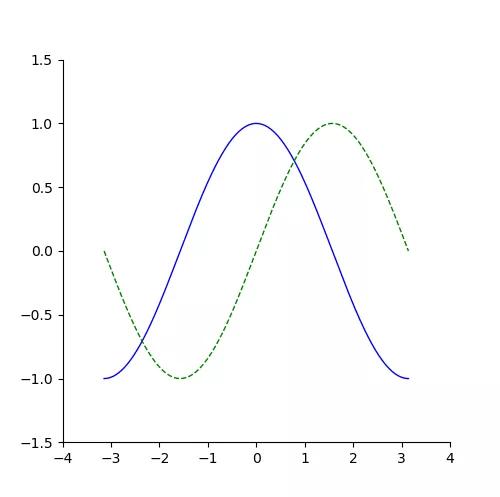
我们现在做一个实验,将四条脊柱的其中两条(上和右)设置为无色,看一下会有什么效果吧:
import numpy as npimport matplotlib.pyplot as pltplt.figure(figsize=(5, 5))x = np.linspace(-np.pi, np.pi, 256)y1,y2 = np.cos(x), np.sin(x)plt.plot(x, y1, color="blue", linewidth=1.0, linestyle="-")plt.plot(x, y2, color="green", linewidth=1.0, linestyle="--")plt.xlim(-4, 4)plt.ylim(-1.5, 1.5)ax = plt.gca()ax.spines['right'].set_color('none')ax.spines['top'].set_color('none')plt.show()这段代码的重点当然是:
ax = plt.gca()ax.spines['right'].set_color('none')ax.spines['top'].set_color('none')其中gca的意思是Get Current Axes,获得当前坐标轴
其中spines['right']是指定一条边
而set_corlor('none')就是让它消失的技术。
运行结果:

脊柱移动
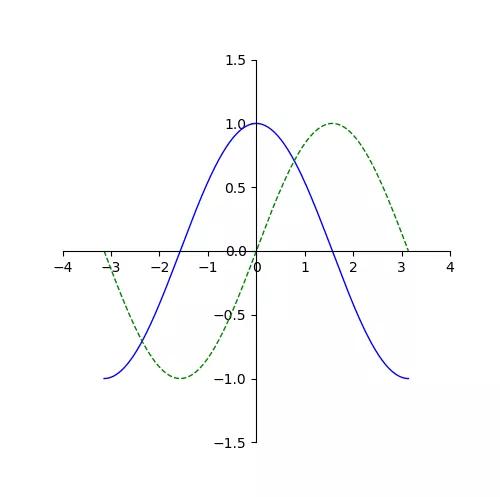
在上一节我们利用颜色消失术将四个脊柱移除了两个,现在我们将移动剩下的脊柱:
import numpy as npimport matplotlib.pyplot as pltplt.figure(figsize=(5, 5))x = np.linspace(-np.pi, np.pi, 256)y1,y2 = np.cos(x), np.sin(x)plt.plot(x, y1, color="blue", linewidth=1.0, linestyle="-")plt.plot(x, y2, color="green", linewidth=1.0, linestyle="--")plt.xlim(-4, 4)plt.ylim(-1.5, 1.5)ax =plt.gca()ax.spines['right'].set_color('none')ax.spines['top'].set_color('none')ax.spines['bottom'].set_position(('data',0))ax.spines['left'].set_position(('data',0))plt.show()我们使用set_position函数将下面以及左边位置脊柱移到了x=0以及y=0的位置,形成了我们常见的坐标轴画法:

图例标注
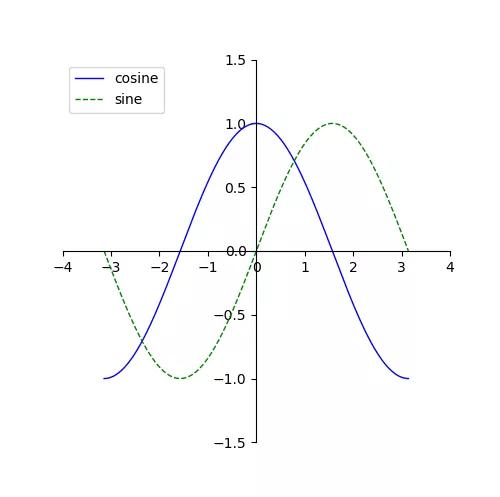
当一张图上面出现多条线的时候,我们就需要给这些线标注名字,比如我们的例子一直都是正弦和余弦函数,所以我们来用legend函数给两条线做一下标注:
import numpy as npimport matplotlib.pyplot as pltplt.figure(figsize=(5, 5))x = np.linspace(-np.pi, np.pi, 256)y1,y2 = np.cos(x), np.sin(x)plt.plot(x, y1, color="blue", linewidth=1.0, linestyle="-", label="cosine")plt.plot(x, y2, color="green", linewidth=1.0, linestyle="--", label="sine")plt.xlim(-4, 4)plt.ylim(-1.5, 1.5)ax = plt.gca()ax.spines['right'].set_color('none' )ax.spines['top'].set_color('none')ax.spines['bottom'].set_position(('data',0))ax.spines['left'].set_position(('data',0))plt.legend(loc='upper left')plt.show()其中,loc='upper left'是让标注文字出现在左上角:

更多关于plt.legend用法请参考这个网站:
https://matplotlib.org/3.1.1/tutorials/intermediate/legend_guide.html


 本文介绍了如何使用Python的Matplotlib库进行高级绘图操作,包括调整坐标轴、隐藏部分脊柱以及添加图例等技巧。


 1万+
1万+

 被折叠的 条评论
为什么被折叠?


