


问题描述:使用plot方法画折线图,在Rstudio的Plots中没有显示出来,显示的空白
代码如下:
# Get the data points in form of a R vector.
rainfall
# Convert it to a time series object.
rainfall.timeseries
# Print the timeseries data.
print(rainfall.timeseries)
# Give the chart file a name.
png(file = "rainfall.png")
# Plot a graph of the time series.
plot(rainfall.timeseries,type = "o")
# Save the file.
dev.off()
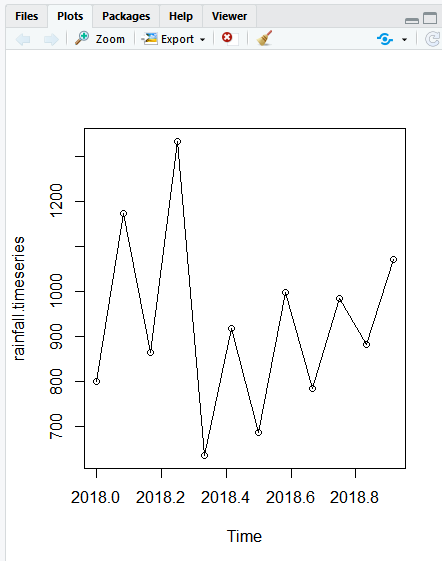
解决办法:将
# Give the chart file a name.
png(file = "rainfall.png")
放置到plot后
# Get the data points in form of a R vector.
rainfall
# Convert it to a time series object.
rainfall.timeseries
# Print the timeseries data.
print(rainfall.timeseries)
# Plot a graph of the time series.
plot(rainfall.timeseries,type = "o")
# Give the chart file a name.
png(file = "rainfall.png")
# Save the file.
dev.off()


 2万+
2万+


 被折叠的 条评论
为什么被折叠?
被折叠的 条评论
为什么被折叠?
 到【灌水乐园】发言


