


pyecharts绘制箱线图需要用prepare_data() 将传入的列表中的数据转换为的 [min, Q1, median (or Q2), Q3, max]。有多个列表的,分别转换。
1.导入Boxplot库。
from pyecharts import Boxplot
2.这里以两个班级的成绩数据为例。
x_axis=['1班','2班']
y1=[78, 98, 56, 78, 90, 45, 78, 20, 87, 86, 74, 89, 94]
y2=[89, 82, 45, 67, 68, 78, 79, 98, 71, 56, 78, 81, 80]
y_axis=[y1,y2]
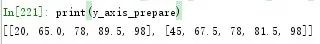
3.数据处理。将列表转换成 [min, Q1, median (or Q2), Q3, max]。
y_axis_prepare=boxplot.prepare_data(y_axis)
4.初始化。
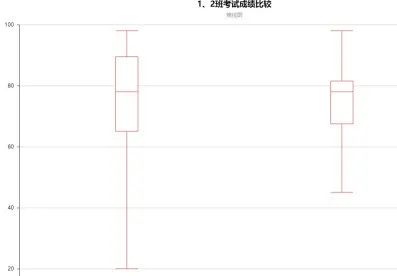
boxplot=Boxplot("1、2班考试成绩比较","箱线图",title_pos="center",width=1200,height=800)
5.绘图。
boxplot.add('',x_axis,y_axis_prepare)
6.保存并查看数据。
boxplot.render('sccores_boxplot.html')


 330
330


 被折叠的 条评论
为什么被折叠?
被折叠的 条评论
为什么被折叠?
 到【灌水乐园】发言


