


本文实例讲述了Ajax+Jpgraph实现的动态折线图功能。分享给大家供大家参考,具体如下:
一 代码
fun.js:
var i=1;
function progress(){
setInterval("beginProgress()", 600);
}
function beginProgress(){
$("#img").attr("src", "img.php?m="+i);
i++;
if(i>=12){
i=1;
}
}
index.php:
Ajax+Jpgraph制作动态折线图

img.php:
require_once 'src/jpgraph.php'; //导入Jpgraph类库
require_once 'src/jpgraph_line.php'; //导入Jpgraph类库的柱状图功能
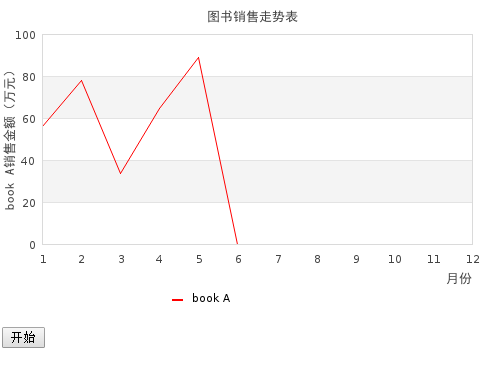
$dataTmp = array(56, 78, 34, 65, 89, 24 ,67 ,88, 45, 68, 70, 50); //设置统计数据
$data1 = array(0, 0, 0, 0, 0, 0 ,0 ,0, 0, 0, 0, 0); //设置统计数据
$m = $_GET['m'];
for($i=0; $i
$data1[$i] = $dataTmp[$i];
}
$graph = new Graph(500, 320);
$graph->SetScale("textlin");
$graph->SetShadow();
$graph->img->SetMargin(40, 30, 30, 70);
$graph->title->Set("图书销售走势表");
$lineplot1 = new LinePlot($data1);
$graph->Add($lineplot1);
$graph->xaxis->title->Set("月份");
$graph->yaxis->title->Set("book A销售金额(万元)");
$graph->title->SetFont(FF_SIMSUN, FS_BOLD);
$graph->yaxis->title->SetFont(FF_SIMSUN, FS_BOLD);
$graph->xaxis->title->SetFont(FF_SIMSUN, FS_BOLD);
$lineplot1->SetColor('red');
$lineplot1->SetLegend('book A');
$graph->legend->SetLayout(LEGEND_HOR);
$graph->legend->Pos(0.4, 0.95, 'center', 'bottom');
$graph->Stroke();
二 运行结果
希望本文所述对大家PHP程序设计有所帮助。


 238
238


 被折叠的 条评论
为什么被折叠?
被折叠的 条评论
为什么被折叠?
 到【灌水乐园】发言


