


概述
QWT,全称Qt Widgets for Technical Applications,是一个基于Qt开发的第三方库。它主要为具有技术背景的程序提供GUI组件和一组实用类,用于生成各种统计图。QWT的主要功能包括二维绘图、刻度、滑块、刻度盘、罗盘、温度计、轮子和旋钮等,可用于控制或显示双精度类型的值、数组或范围。此外,QWT还支持任何Qt能够支持的系统环境,并兼容Qt4(4.4版本以上)和Qt5版本。在QWT的最新版本中,还提供了一些新的绘图控件以及对OpenGL的基本支持。总的来说,QWT是一个功能强大且灵活的库,可用于在Qt应用程序中创建各种技术图表和控件。
步骤一
官网下载qwt下载
步骤二
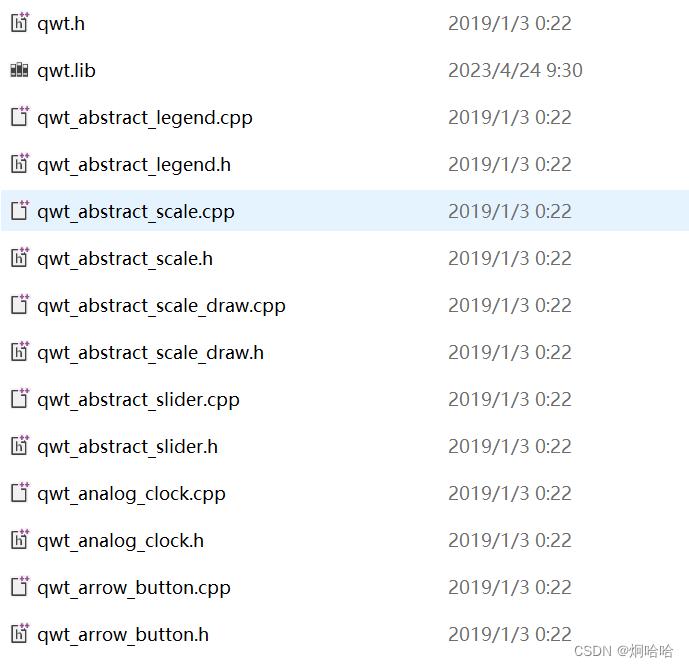
将下载好的qwt自己编译成静态库,生成主要的两个文件 qwtd.lib,qwt.lib。将文件封装成一个目录,并放在项目目录下。
步骤三
项目的.pro文件进行引入,代码如下
win32:CONFIG(release, debug|release): LIBS += -L$$PWD/../QWT/lib/ -lqwt
else:win32:CONFIG(debug, debug|release): LIBS += -L$$PWD/../QWT/lib/ -lqwtd

INCLUDEPATH += $$PWD/../QWT/qwt-6.1.4/src
DEPENDPATH += $$PWD/../QWT/qwt-6.1.4/src
代码声明
头文件中引入
#include <qwt_legend.h>
#include <qwt_plot.h>
#include <qwt_plot_curve.h>
#include <qwt_plot_grid.h>
#include <qwt_plot_magnifier.h>
#include <qwt_plot_panner.h>
#include <qwt_plot_zoomer.h>
#include <qwt_point_data.h>
头文件中定义
//网格
QwtPlotGrid* grid;
//线
QwtPlotCurve* zone1Curve1;
QwtPlotCurve* zone1Curve2;
QwtPlotCurve* zone1Curve3;
QwtPlotCurve* zone1Curve4;
//X轴数据
QVector<double> xData;
double initXData = 200;
//Y轴数据
QVector<double> yData1;
QVector<double> yData2;
QVector<double> yData3;
QVector<double> yData4;
//x轴位置
double xPos = 1;
//x轴位置标识
int xPosFlag = 0;
代码实现
#include "SubWidget.h"
#include "ui_SubWidget.h"
#include <QDate>
SubWidget::SubWidget(QWidget* parent, QString subName)
: QWidget(parent)
, ui(new Ui::SubWidget)
{
ui->setupUi(this);
qDebug()<<"subName"<<subName;
this->setWindowTitle(subName);
initQwt();
wTimer = new QTimer();
connect(wTimer, SIGNAL(timeout()), this, SLOT(queueToFile()));
}
SubWidget::~SubWidget()
{
delete ui;
}
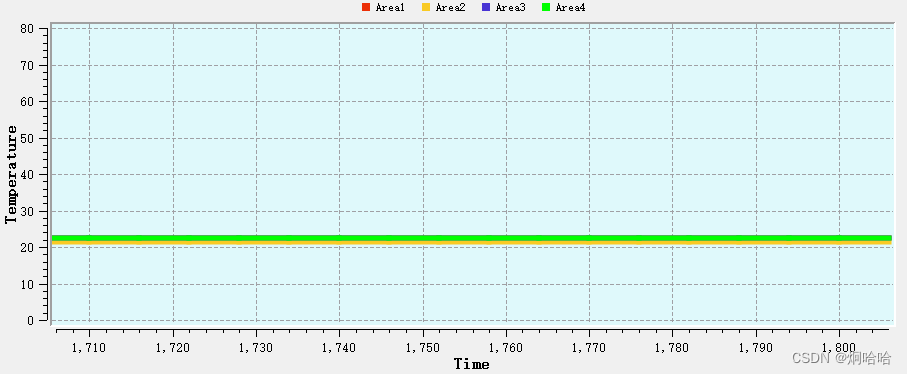
void SubWidget::initQwt()
{
ui->qwtPlot->setFrameStyle(QFrame::Panel);
ui->qwtPlot->setLineWidth(0);
ui->qwtPlot->setCanvasBackground(QColor(223, 249, 251));
ui->qwtPlot->setAxisTitle(QwtPlot::xBottom, "Time");
ui->qwtPlot->setAxisTitle(QwtPlot::yLeft, "Temperature");
ui->qwtPlot->setAxisScale(QwtPlot::xBottom, 0, 100, 10);
ui->qwtPlot->setAxisScale(QwtPlot::yLeft, 0, 80, 10);
//放大选中区域
QwtPlotZoomer* pZoomer = new QwtPlotZoomer(ui->qwtPlot->canvas());
pZoomer->setRubberBandPen(QPen(Qt::lightGray));
ui->qwtPlot->replot();
for(int i = 0; i < initXData; i++) {
xData.append(i);
}
//画四条线
zone1Curve1 = new QwtPlotCurve("Area1");
QPen zone1Pen1;
zone1Pen1.setColor(QColor(235, 47, 6));
zone1Pen1.setWidth(5);
zone1Curve1->setPen(zone1Pen1);
zone1Curve1->setRenderHint(QwtPlotItem::RenderAntialiased, true);
zone1Curve1->attach(ui->qwtPlot);
zone1Curve2 = new QwtPlotCurve("Area2");
QPen zone1Pen2;
zone1Pen2.setColor(QColor(249, 202, 36));
zone1Pen2.setWidth(5);
zone1Curve2->setPen(zone1Pen2);
zone1Curve2->setRenderHint(QwtPlotItem::RenderAntialiased, true);
zone1Curve2->attach(ui->qwtPlot);
zone1Curve3 = new QwtPlotCurve("Area3");
QPen zone1Pen3;
zone1Pen3.setColor(QColor(72, 52, 212));
zone1Pen3.setWidth(5);
zone1Curve3->setPen(zone1Pen3);
zone1Curve3->setRenderHint(QwtPlotItem::RenderAntialiased, true);
zone1Curve3->attach(ui->qwtPlot);
zone1Curve4 = new QwtPlotCurve("Area4");
QPen zone1Pen4;
zone1Pen4.setColor(QColor(0, 255, 0));
zone1Pen4.setWidth(5);
zone1Curve4->setPen(zone1Pen4);
zone1Curve4->setRenderHint(QwtPlotItem::RenderAntialiased, true);
zone1Curve4->attach(ui->qwtPlot);
//添加网格
grid = new QwtPlotGrid();
grid->setMajorPen(QPen(Qt::gray, 0, Qt::DashLine));
grid->attach(ui->qwtPlot);
QwtLegend* legend = new QwtLegend();
legend->setDefaultItemMode(QwtLegendData::Checkable); //图例可被点击
ui->qwtPlot->insertLegend(legend, QwtPlot::TopLegend);
// legend->resize(2000, 1000);
//点击图例操作
connect(legend, SIGNAL(checked(const QVariant&, bool, int)), this, SLOT(showItem(const QVariant&, bool)));
// QwtPlotItemList items = ui->qwtPlot->itemList();
// qDebug()<<"items.size"<<items.size();
// for(int i = 0; i < items.size(); i++) {
// QwtPlotItem* plotItem = items.at(i);
// plotItem->setVisible(false);
// }
}
/**
* @author:xinyuF
* @date:2024-03-22
* @brief:设置Y轴数据
**/
void SubWidget::setYData(double value, int flag)
{
switch(flag) {
case 1:
yData1.append(value);
zone1Curve1->setSamples(xData, yData1);
// zone1Curve1->attach(ui->qwtPlot);
break;
case 2:
yData2.append(value);
zone1Curve2->setSamples(xData, yData2);
// zone1Curve2->attach(ui->qwtPlot);
break;
case 3:
yData3.append(value);
zone1Curve3->setSamples(xData, yData3);
// zone1Curve3->attach(ui->qwtPlot);
break;
case 4:
yData4.append(value);
zone1Curve4->setSamples(xData, yData4);
// zone1Curve4->attach(ui->qwtPlot);
break;
}
ui->qwtPlot->replot();
}
void SubWidget::setXData(double value)
{
xData.append(value);
}
uint16_t SubWidget::convertValue(uint8_t high, uint8_t low)
{
return (((high << 8) & 0xFF00) | (low & 0xFF));
}
void SubWidget::writeFile(QByteArray response)
{
QString responseStr = response.toHex(' ');
writeFileQueue.enqueue(responseStr);
}
void SubWidget::showTemperatureCurve(QByteArray response)
{
setXData(initXData++);
uint16_t area1V = convertValue(response.at(3), response.at(4));
setYData(area1V / 100.0, 1);
uint16_t area2V = convertValue(response.at(5), response.at(6));
setYData(area2V / 100.0, 2);
uint16_t area3V = convertValue(response.at(7), response.at(8));
setYData(area3V / 100.0, 3);
uint16_t area4V = convertValue(response.at(9), response.at(10));
setYData(area4V / 100.0, 4);
if(xPosFlag++ > 100) {
xPos++;
ui->qwtPlot->setAxisScale(QwtPlot::xBottom, xPos, 100 + xPos, 10);
}
}
void SubWidget::showItem(const QVariant& itemInfo, bool on)
{
QwtPlotItem* plotItem = ui->qwtPlot->infoToItem(itemInfo);
if(plotItem) {
plotItem->setVisible(on);
}
}
图示


 1009
1009


 被折叠的 条评论
为什么被折叠?
被折叠的 条评论
为什么被折叠?
 到【灌水乐园】发言


