


import 结果:
0     1.0
1     3.0
2     6.0
3     NaN
4    44.0
5     1.0
dtype: float64
DatetimeIndex(['2019-04-09', '2019-04-10', '2019-04-11', '2019-04-12',
               '2019-04-13'],
              dtype='datetime64[ns]', freq='D')
                   a         b         c         d
2019-04-09 -0.566082  1.549990  1.251354 -0.016584
2019-04-10  0.918206  0.588483 -1.007992 -0.614753
2019-04-11  0.198062  0.906087  1.566753 -0.345369
2019-04-12  0.375125  0.183213  1.706462  2.047215
2019-04-13  1.361736  0.010675  0.145705  0.664728
   0  1   2   3
0  0  1   2   3
1  4  5   6   7
2  8  9  10  11
     A          B    C  D      E    F
0  1.0 2013-01-02  1.0  3   test  foo
1  1.0 2013-01-02  1.0  3  train  foo
2  1.0 2013-01-02  1.0  3   test  foo
3  1.0 2013-01-02  1.0  3  train  foo
A           float64
B    datetime64[ns]
C           float32
D             int32
E          category
F            object
dtype: object
Int64Index([0, 1, 2, 3], dtype='int64')
Index(['A', 'B', 'C', 'D', 'E', 'F'], dtype='object')
[[1.0 Timestamp('2013-01-02 00:00:00') 1.0 3 'test' 'foo']
 [1.0 Timestamp('2013-01-02 00:00:00') 1.0 3 'train' 'foo']
 [1.0 Timestamp('2013-01-02 00:00:00') 1.0 3 'test' 'foo']
 [1.0 Timestamp('2013-01-02 00:00:00') 1.0 3 'train' 'foo']]
         A    C    D
count  4.0  4.0  4.0
mean   1.0  1.0  3.0
std    0.0  0.0  0.0
min    1.0  1.0  3.0
25%    1.0  1.0  3.0
50%    1.0  1.0  3.0
75%    1.0  1.0  3.0
max    1.0  1.0  3.0
                     0         ...                             3
A                    1         ...                             1
B  2013-01-02 00:00:00         ...           2013-01-02 00:00:00
C                    1         ...                             1
D                    3         ...                             3
E                 test         ...                         train
F                  foo         ...                           foo

[6 rows x 4 columns]
     F      E  D    C          B    A
0  foo   test  3  1.0 2013-01-02  1.0
1  foo  train  3  1.0 2013-01-02  1.0
2  foo   test  3  1.0 2013-01-02  1.0
3  foo  train  3  1.0 2013-01-02  1.0
     A          B    C  D      E    F
3  1.0 2013-01-02  1.0  3  train  foo
2  1.0 2013-01-02  1.0  3   test  foo
1  1.0 2013-01-02  1.0  3  train  foo
0  1.0 2013-01-02  1.0  3   test  foo
     A          B    C  D      E    F
0  1.0 2013-01-02  1.0  3   test  foo
2  1.0 2013-01-02  1.0  3   test  foo
1  1.0 2013-01-02  1.0  3  train  foo
3  1.0 2013-01-02  1.0  3  train  foo
import pandas as pd
import numpy as np
dates = pd.date_range('20190409',periods=6)
df = pd.DataFrame(np.arange(24).reshape((6,4)),index=dates,columns=['A','B','C','D'])
print(df)
print(df['A'])
print(df.A)
print(df[0:3])
print(df['20190409':'20190411'])
# select by label:loc
print(df.loc['20190409'])
print(df.loc[:,['A','B']])
print(df.loc['20190411',['A','B']])
# select by position:iloc
print(df.iloc[3])
print(df.iloc[1:3,1])
print(df.iloc[[1,3,5],1:3])
# mixed selection:ix
print(df.ix[:3,['A','C']])
# Boolean indexing
print(df[df.A>8])
结果:
             A   B   C   D
2019-04-09   0   1   2   3
2019-04-10   4   5   6   7
2019-04-11   8   9  10  11
2019-04-12  12  13  14  15
2019-04-13  16  17  18  19
2019-04-14  20  21  22  23
2019-04-09     0
2019-04-10     4
2019-04-11     8
2019-04-12    12
2019-04-13    16
2019-04-14    20
Freq: D, Name: A, dtype: int32
2019-04-09     0
2019-04-10     4
2019-04-11     8
2019-04-12    12
2019-04-13    16
2019-04-14    20
Freq: D, Name: A, dtype: int32
            A  B   C   D
2019-04-09  0  1   2   3
2019-04-10  4  5   6   7
2019-04-11  8  9  10  11
            A  B   C   D
2019-04-09  0  1   2   3
2019-04-10  4  5   6   7
2019-04-11  8  9  10  11
A    0
B    1
C    2
D    3
Name: 2019-04-09 00:00:00, dtype: int32
             A   B
2019-04-09   0   1
2019-04-10   4   5
2019-04-11   8   9
2019-04-12  12  13
2019-04-13  16  17
2019-04-14  20  21
A    8
B    9
Name: 2019-04-11 00:00:00, dtype: int32
A    12
B    13
C    14
D    15
Name: 2019-04-12 00:00:00, dtype: int32
2019-04-10    5
2019-04-11    9
Freq: D, Name: B, dtype: int32
             B   C
2019-04-10   5   6
2019-04-12  13  14
2019-04-14  21  22
            A   C
2019-04-09  0   2
2019-04-10  4   6
2019-04-11  8  10
             A   B   C   D
2019-04-12  12  13  14  15
2019-04-13  16  17  18  19
2019-04-14  20  21  22  23
import pandas as pd
import numpy as np
dates = pd.date_range('20190409',periods=6)
df = pd.DataFrame(np.arange(24).reshape((6,4)),index=dates,columns=['A','B','C','D'])
df.iloc[2,2] = 999
df.loc['20190410','B'] = 888
df.B[df.A>4] = 0
df['F'] = np.nan
df['E'] = pd.Series([1,2,3,4,5,6],index=pd.date_range('20190409',periods=6))
print(df)结果:
             A    B    C   D   F  E
2019-04-09   0    1    2   3 NaN  1
2019-04-10   4  888    6   7 NaN  2
2019-04-11   8    0  999  11 NaN  3
2019-04-12  12    0   14  15 NaN  4
2019-04-13  16    0   18  19 NaN  5
2019-04-14  20    0   22  23 NaN  6
import pandas as pd
import numpy as np

dates = pd.date_range('20190409', periods=6)
df = pd.DataFrame(np.arange(24).reshape((6,4)),index=dates, columns=['A','B','C','D'])
df.iloc[0,1] = np.nan
df.iloc[1,2] = np.nan

print(df)

print(df.dropna(axis=0,how='any')) # how = {'any','all'}

print(df.fillna(value=0))

print(df.isnull())

print(np.any(df.isnull()) == True) # 至少有一个nan
结果:
             A     B     C   D
2019-04-09   0   NaN   2.0   3
2019-04-10   4   5.0   NaN   7
2019-04-11   8   9.0  10.0  11
2019-04-12  12  13.0  14.0  15
2019-04-13  16  17.0  18.0  19
2019-04-14  20  21.0  22.0  23
             A     B     C   D
2019-04-11   8   9.0  10.0  11
2019-04-12  12  13.0  14.0  15
2019-04-13  16  17.0  18.0  19
2019-04-14  20  21.0  22.0  23
             A     B     C   D
2019-04-09   0   0.0   2.0   3
2019-04-10   4   5.0   0.0   7
2019-04-11   8   9.0  10.0  11
2019-04-12  12  13.0  14.0  15
2019-04-13  16  17.0  18.0  19
2019-04-14  20  21.0  22.0  23
                A      B      C      D
2019-04-09  False   True  False  False
2019-04-10  False  False   True  False
2019-04-11  False  False  False  False
2019-04-12  False  False  False  False
2019-04-13  False  False  False  False
2019-04-14  False  False  False  False
True
import pandas as pd
data = pd.read_csv('G:Numpy_Pandastutorials-mastertutorials-masternumpy&pandas15_read_tostudent.csv')
print(data)
print(data.age[data.iloc[:,0]>1110])
data.to_csv('student.csv')结果:
    Student ID  name   age  gender
0         1100  Kelly   22  Female
1         1101    Clo   21  Female
2         1102  Tilly   22  Female
3         1103   Tony   24    Male
4         1104  David   20    Male
5         1105  Catty   22  Female
6         1106      M    3  Female
7         1107      N   43    Male
8         1108      A   13    Male
9         1109      S   12    Male
10        1110  David   33    Male
11        1111     Dw    3  Female
12        1112      Q   23    Male
13        1113      W   21  Female
11     3
12    23
13    21
Name: age, dtype: int64
import pandas as pd
import numpy as np
# concatenating
df1 = pd.DataFrame(np.ones((3,4))*0, columns=['a','b','c','d'])
df2 = pd.DataFrame(np.ones((3,4))*1, columns=['a','b','c','d'])
df3 = pd.DataFrame(np.ones((3,4))*2, columns=['a','b','c','d'])
res = pd.concat([df1,df2,df3],axis=0,ignore_index=True)
print(res)结果:
     a    b    c    d
0  0.0  0.0  0.0  0.0
1  0.0  0.0  0.0  0.0
2  0.0  0.0  0.0  0.0
3  1.0  1.0  1.0  1.0
4  1.0  1.0  1.0  1.0
5  1.0  1.0  1.0  1.0
6  2.0  2.0  2.0  2.0
7  2.0  2.0  2.0  2.0
8  2.0  2.0  2.0  2.0
# join,['inner','outer']
import pandas as pd
import numpy as np
df1 = pd.DataFrame(np.ones((3,4))*0, columns=['a','b','c','d'], index=[1,2,3])
df2 = pd.DataFrame(np.ones((3,4))*1, columns=['b','c','d','e'], index=[2,3,4])
print(df1)
print(df2)
res1 = pd.concat([df1,df2],join='outer',ignore_index=True,sort=True) # 默认是outer模式
print(res1)
res2 = pd.concat([df1,df2],join='inner',ignore_index=True)
print(res2)
res3 = pd.concat([df1,df2],axis=1,join_axes=[df1.index])
print(res3)
res = pd.concat([df1,df2],axis=1)
print(res)
# append
df1 = pd.DataFrame(np.ones((3,4))*0, columns=['a','b','c','d'])
df2 = pd.DataFrame(np.ones((3,4))*1, columns=['a','b','c','d'])
df3 = pd.DataFrame(np.ones((3,4))*2, columns=['a','b','c','d'])
s1 = pd.Series([1,2,3,4], index=['a','b','c','d'])
res = df1.append(df2, ignore_index=True)
print(res)
res = df1.append([df2,df3],ignore_index=True)
print(res)
res = df1.append(s1,ignore_index=True)
print(res)结果:
     a    b    c    d
1  0.0  0.0  0.0  0.0
2  0.0  0.0  0.0  0.0
3  0.0  0.0  0.0  0.0
     b    c    d    e
2  1.0  1.0  1.0  1.0
3  1.0  1.0  1.0  1.0
4  1.0  1.0  1.0  1.0
     a    b    c    d    e
0  0.0  0.0  0.0  0.0  NaN
1  0.0  0.0  0.0  0.0  NaN
2  0.0  0.0  0.0  0.0  NaN
3  NaN  1.0  1.0  1.0  1.0
4  NaN  1.0  1.0  1.0  1.0
5  NaN  1.0  1.0  1.0  1.0
     b    c    d
0  0.0  0.0  0.0
1  0.0  0.0  0.0
2  0.0  0.0  0.0
3  1.0  1.0  1.0
4  1.0  1.0  1.0
5  1.0  1.0  1.0
     a    b    c    d    b    c    d    e
1  0.0  0.0  0.0  0.0  NaN  NaN  NaN  NaN
2  0.0  0.0  0.0  0.0  1.0  1.0  1.0  1.0
3  0.0  0.0  0.0  0.0  1.0  1.0  1.0  1.0
     a    b    c    d    b    c    d    e
1  0.0  0.0  0.0  0.0  NaN  NaN  NaN  NaN
2  0.0  0.0  0.0  0.0  1.0  1.0  1.0  1.0
3  0.0  0.0  0.0  0.0  1.0  1.0  1.0  1.0
4  NaN  NaN  NaN  NaN  1.0  1.0  1.0  1.0
     a    b    c    d
0  0.0  0.0  0.0  0.0
1  0.0  0.0  0.0  0.0
2  0.0  0.0  0.0  0.0
3  1.0  1.0  1.0  1.0
4  1.0  1.0  1.0  1.0
5  1.0  1.0  1.0  1.0
     a    b    c    d
0  0.0  0.0  0.0  0.0
1  0.0  0.0  0.0  0.0
2  0.0  0.0  0.0  0.0
3  1.0  1.0  1.0  1.0
4  1.0  1.0  1.0  1.0
5  1.0  1.0  1.0  1.0
6  2.0  2.0  2.0  2.0
7  2.0  2.0  2.0  2.0
8  2.0  2.0  2.0  2.0
     a    b    c    d
0  0.0  0.0  0.0  0.0
1  0.0  0.0  0.0  0.0
2  0.0  0.0  0.0  0.0
3  1.0  2.0  3.0  4.0
import pandas as pd
left = pd.DataFrame({'key': ['K0', 'K1', 'K2', 'K3'],
'A': ['A0', 'A1', 'A2', 'A3'],
'B': ['B0', 'B1', 'B2', 'B3']})
right = pd.DataFrame({'key': ['K0', 'K1', 'K2', 'K3'],
'C': ['C0', 'C1', 'C2', 'C3'],
'D': ['D0', 'D1', 'D2', 'D3']})
print(left)
print(right)
res = pd.merge(left,right,on='key')
print(res)
结果:
  key   A   B
0  K0  A0  B0
1  K1  A1  B1
2  K2  A2  B2
3  K3  A3  B3
  key   C   D
0  K0  C0  D0
1  K1  C1  D1
2  K2  C2  D2
3  K3  C3  D3
  key   A   B   C   D
0  K0  A0  B0  C0  D0
1  K1  A1  B1  C1  D1
2  K2  A2  B2  C2  D2
3  K3  A3  B3  C3  D3
# consider two keys
import pandas as pd
left = pd.DataFrame({'key1': ['K0', 'K0', 'K1', 'K2'],
'key2': ['K0', 'K1', 'K0', 'K1'],
'A': ['A0', 'A1', 'A2', 'A3'],
'B': ['B0', 'B1', 'B2', 'B3']})
right = pd.DataFrame({'key1': ['K0', 'K1', 'K1', 'K2'],
'key2': ['K0', 'K0', 'K0', 'K0'],
'C': ['C0', 'C1', 'C2', 'C3'],
'D': ['D0', 'D1', 'D2', 'D3']})
print(left)
print(right)
res = pd.merge(left,right,on=['key1','key2'],how='inner') # 默认inner 相同的保留下来
print(res)
# how=['left','right','innner','outer']
res = pd.merge(left,right,on=['key1','key2'],how='outer')
print(res)
结果:
  key1 key2   A   B
0   K0   K0  A0  B0
1   K0   K1  A1  B1
2   K1   K0  A2  B2
3   K2   K1  A3  B3
  key1 key2   C   D
0   K0   K0  C0  D0
1   K1   K0  C1  D1
2   K1   K0  C2  D2
3   K2   K0  C3  D3
  key1 key2   A   B   C   D
0   K0   K0  A0  B0  C0  D0
1   K1   K0  A2  B2  C1  D1
2   K1   K0  A2  B2  C2  D2
  key1 key2    A    B    C    D
0   K0   K0   A0   B0   C0   D0
1   K0   K1   A1   B1  NaN  NaN
2   K1   K0   A2   B2   C1   D1
3   K1   K0   A2   B2   C2   D2
4   K2   K1   A3   B3  NaN  NaN
5   K2   K0  NaN  NaN   C3   D3
import pandas as pd
df1 = pd.DataFrame({'col1':[0,1], 'col_left':['a','b']})
df2 = pd.DataFrame({'col1':[1,2,2],'col_right':[2,2,2]})
print(df1)
print(df2)
res = pd.merge(df1,df2,on='col1',how='outer',indicator=True)
print(res)
res = pd.merge(df1,df2,on='col1',how='outer',indicator='indicator column')
print(res)
结果:
   col1 col_left
0     0        a
1     1        b
   col1  col_right
0     1          2
1     2          2
2     2          2
   col1 col_left  col_right      _merge
0     0        a        NaN   left_only
1     1        b        2.0        both
2     2      NaN        2.0  right_only
3     2      NaN        2.0  right_only
   col1 col_left  col_right indicator column
0     0        a        NaN        left_only
1     1        b        2.0             both
2     2      NaN        2.0       right_only
3     2      NaN        2.0       right_only
import pandas as pd
left = pd.DataFrame({'A': ['A0', 'A1', 'A2'],
'B': ['B0', 'B1', 'B2']},
index=['K0', 'K1', 'K2'])
right = pd.DataFrame({'C': ['C0', 'C2', 'C3'],
'D': ['D0', 'D2', 'D3']},
index=['K0', 'K2', 'K3'])
print(left)
print(right)
# how依然有四种
res = pd.merge(left,right,left_index=True,right_index=True,how='outer')
print(res)
结果:
     A   B
K0  A0  B0
K1  A1  B1
K2  A2  B2
     C   D
K0  C0  D0
K2  C2  D2
K3  C3  D3
      A    B    C    D
K0   A0   B0   C0   D0
K1   A1   B1  NaN  NaN
K2   A2   B2   C2   D2
K3  NaN  NaN   C3   D3
import pandas as pd

boys = pd.DataFrame({'k': ['K0', 'K1', 'K2'], 'age': [1, 2, 3]})
girls = pd.DataFrame({'k': ['K0', 'K0', 'K3'], 'age': [4, 5, 6]})

print(boys)
print(girls)

res = pd.merge(boys,girls,on='k',suffixes=['_boys','_girls'],how='outer')
print(res)
结果:
    k  age
0  K0    1
1  K1    2
2  K2    3
    k  age
0  K0    4
1  K0    5
2  K3    6
    k  age_boys  age_girls
0  K0       1.0        4.0
1  K0       1.0        5.0
2  K1       2.0        NaN
3  K2       3.0        NaN
4  K3       NaN        6.0
import pandas as pd
import numpy as np
import matplotlib.pyplot as plt
# Series
data = pd.Series(np.random.randn(1000),index=np.arange(1000))
data = data.cumsum()
data.plot()
plt.show()
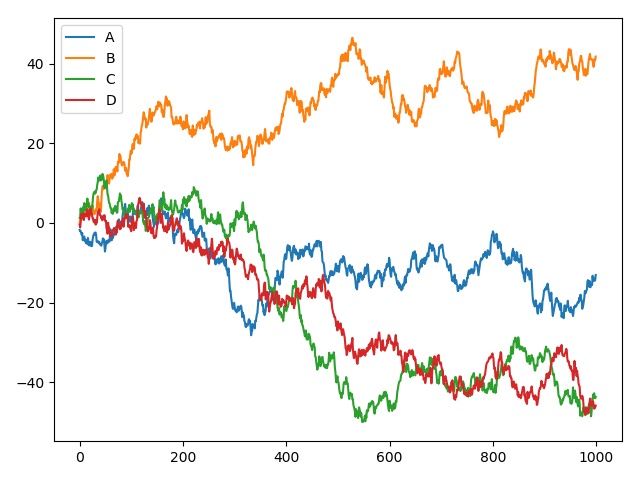
# DataFrame
data = pd.DataFrame(np.random.randn(1000,4),
index=np.arange(1000),
columns=list("ABCD"))
data = data.cumsum()
print(data.head(5))
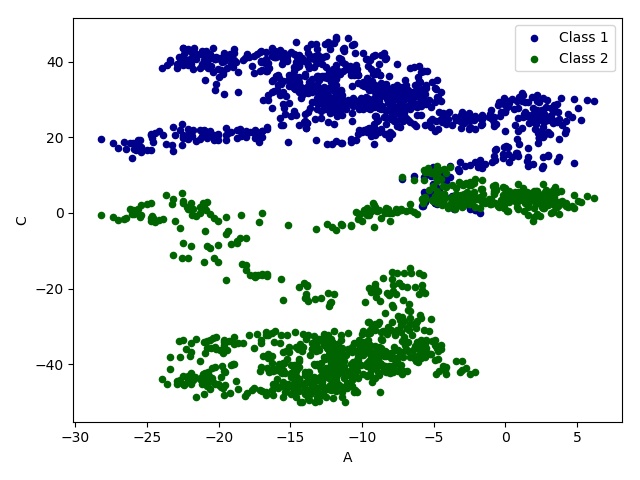
#plot methods:
# 'bar','hist'.'box','kde','area','scatter'
data.plot()
ax = data.plot.scatter(x='A',y='B',color= 'DarkBlue',label='Class 1')
data.plot.scatter(x='A',y='C',color= 'DarkGreen',label='Class 2',ax=ax)
plt.show()结果:
          A         B         C         D
0 -1.746285 -0.054722  1.266026 -0.491001
1 -2.089565  0.773321  1.532086 -1.117511
2 -2.057623  0.782682  3.677874  0.119545
3 -2.498384  1.141660  2.339293  2.227382
4 -2.974943  2.509056  1.940303  1.767372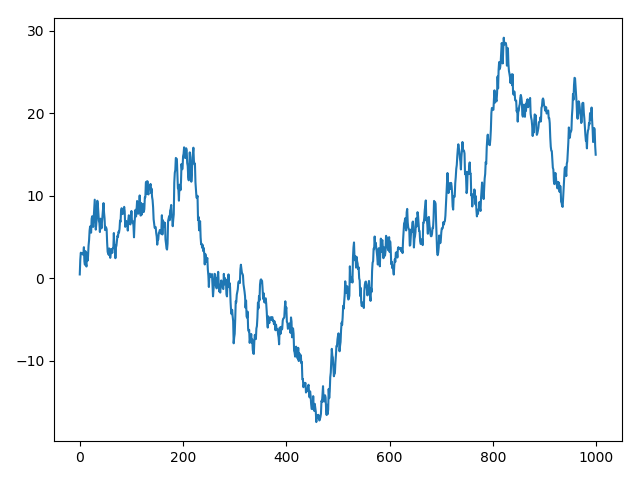


 190
190


 被折叠的 条评论
为什么被折叠?
被折叠的 条评论
为什么被折叠?
 到【灌水乐园】发言


