Sklearn (全称 Scikit-Learn) 是基于 Python 语言的机器学习工具。它建立在 NumPy, SciPy, Pandas 和 Matplotlib 之上,里面的 API 的设计非常好,所有对象的接口简单,很适合新手上路。
机器学习包含四个元素
- 数据 (Data)
- 任务 (Task)
- 性能度量 (Quality Metric)
- 模型 (Model)
传统的机器学习任务从开始到建模的一般流程就是:获取数据——》数据预处理——》训练模型——》模型评估——》预测,分类。
示例:
首先,我们来分析一个案例,关于美国某个城市人口与其城市收入的问题,根据其提供的样本
cityprofit.csv内容如下:
6.1101	17.592
5.5277	9.1302
8.5186	13.662
7.0032	11.854
5.8598	6.8233
8.3829	11.886
7.4764	4.3483
8.5781	12
6.4862	6.5987
5.0546	3.8166
5.7107	3.2522
14.164	15.505
5.734	3.1551
8.4084	7.2258
5.6407	0.71618
5.3794	3.5129
6.3654	5.3048
5.1301	0.56077
6.4296	3.6518
7.0708	5.3893
6.1891	3.1386
20.27	21.767
5.4901	4.263
6.3261	5.1875
5.5649	3.0825
18.945	22.638
12.828	13.501
10.957	7.0467
13.176	14.692
22.203	24.147
5.2524	-1.22
6.5894	5.9966
9.2482	12.134
5.8918	1.8495
8.2111	6.5426
7.9334	4.5623
8.0959	4.1164
5.6063	3.3928
12.836	10.117
6.3534	5.4974
5.4069	0.55657
6.8825	3.9115
11.708	5.3854
5.7737	2.4406
7.8247	6.7318
7.0931	1.0463
5.0702	5.1337
5.8014	1.844
11.7	8.0043
5.5416	1.0179
7.5402	6.7504
5.3077	1.8396
7.4239	4.2885
7.6031	4.9981
6.3328	1.4233
6.3589	-1.4211
6.2742	2.4756
5.6397	4.6042
9.3102	3.9624
9.4536	5.4141
8.8254	5.1694
5.1793	-0.74279
21.279	17.929
14.908	12.054
18.959	17.054
7.2182	4.8852
8.2951	5.7442
10.236	7.7754
5.4994	1.0173
20.341	20.992
10.136	6.6799
7.3345	4.0259
6.0062	1.2784
7.2259	3.3411
5.0269	-2.6807
6.5479	0.29678
7.5386	3.8845
5.0365	5.7014
10.274	6.7526
5.1077	2.0576
5.7292	0.47953
5.1884	0.20421
6.3557	0.67861
9.7687	7.5435
6.5159	5.3436
8.5172	4.2415
9.1802	6.7981
6.002	0.92695
5.5204	0.152
5.0594	2.8214
5.7077	1.8451
7.6366	4.2959
5.8707	7.2029
5.3054	1.9869
8.2934	0.14454
13.394	9.0551
5.4369	0.61705
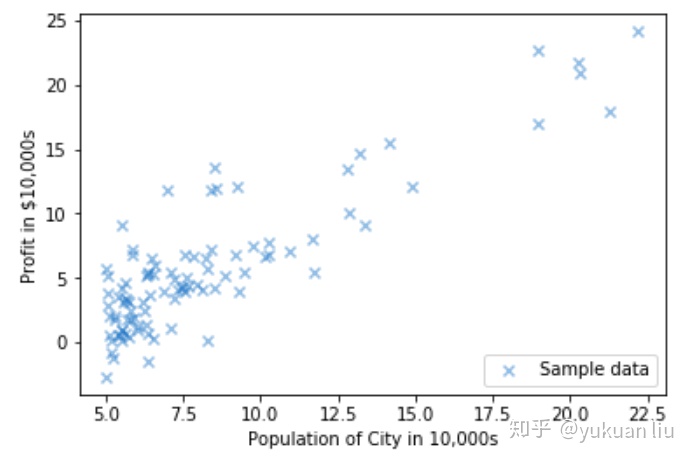
绘制散点图如下

那么问题来了,假如我想要预测,城市人口数量到达17.5W人时,城市收入会达到多少? 经过分析发现,它只有一个变量,也就是城市人口数量,而输出为城市收入,那么我们很自然的就想到f(x)=ax+b的一元线性函数。
线性回归预测城市收入,代码如下:
# coding: utf-8

# # 线性回归

# ### 引入示例
# 首先,我们来分析一个案例,关于美国某个城市人口与其城市收入的问题,根据其提供的样本绘制散点图如下

# <img src="img/pic_1.PNG" width=400 height=400>

# 那么问题来了,假如我想要预测,城市人口数量到达17.5W人时,城市收入会达到多少?
# 经过分析发现,它只有一个变量,也就是城市人口数量,而输出为城市收入,那么我们很自然的就想到f(x)=ax+b的一元线性函数

# In[19]:


import pandas as pd
import numpy as np
import matplotlib.pyplot as plt

dataset = pd.read_csv('cityprofit.csv')
# regressor.fit需要X为二维数组,Y一维或者二维均可
X = dataset.iloc[ : ,   : 1 ].values
Y = dataset.iloc[ : , 1 ].values

from sklearn.model_selection import train_test_split
X_train, X_test, Y_train, Y_test = train_test_split( X, Y, test_size = 1/4, random_state = 0)

from sklearn.linear_model import LinearRegression
regressor = LinearRegression()
"""
    LinearRegression(fit_intercept=True, normalize=False, copy_X=True, n_jobs=None):线性回归
        parameters:
            fit_intercept: 是否计算截距
            normalize:     是否规范化
            copy_x:        是否复制x
        Attributes:
            coef_:         系数
            intercept_:    截距
        Methods:
            fit(X, y, sample_weight=None):   拟合
            get_params(deep=True):           得到参数,如果deep为True则得到这个estimator 的子对象返回参数名和值的映射
            set_params(**params):            设置参数
            predict(X):                      预测
            score(X, y, sample_weight=None): 预测的准确度。X:测试样本;y:X的真实结果;sample_w
            eight:                           权重
"""
regressor = regressor.fit(X_train, Y_train)

Y_pred = regressor.predict(X_test)

plt.scatter(X_train , Y_train, color = '#2177C7',marker='x', alpha=0.48)
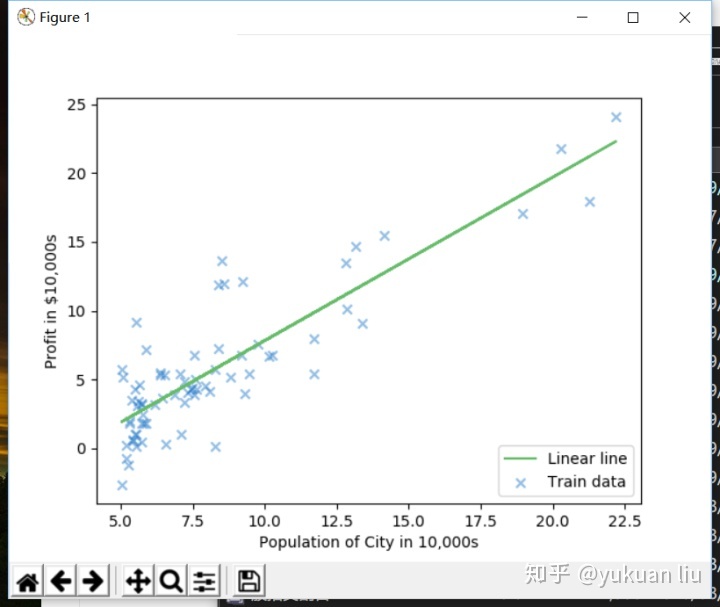
plt.plot(X_train , regressor.predict(X_train), color ='#66BB6A')
plt.legend(labels=["Linear line","Train data"],loc="lower right");
plt.xlabel('Population of City in 10,000s')
plt.ylabel('Profit in $10,000s')
plt.show()


# In[20]:


print("训练后结果")
print("斜率:%.2f"%float(regressor.coef_))
print("截距:%.2f"%float(regressor.intercept_))


# 测试集可视化结果

# In[21]:


plt.scatter(X_test , Y_test, color = '#2177C7',marker='x',alpha=0.48)
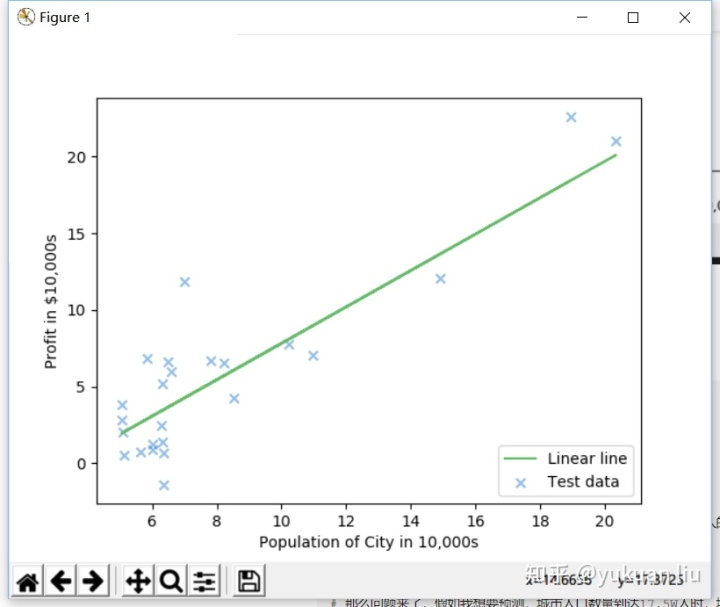
plt.plot(X_test , regressor.predict(X_test), color ='#66BB6A')
plt.legend(labels=["Linear line","Test data"],loc="lower right");
plt.xlabel('Population of City in 10,000s')
plt.ylabel('Profit in $10,000s')
plt.show()
训练集结果可视化:

训练后结果
斜率:1.19
截距:-4.05
测试集可视化结果:


 7541
7541

 被折叠的 条评论
为什么被折叠?


