


在很多编程语言中,注释都是一项很有用的功能。编写简短的代码时也许没有注释不会影响我们理解代码,但随着程序代码数量越来越多,越来越复杂,我们就需要为代码添加说明,以此来快速了解其作用。注释让你能够使用自然语言在程序中添加说明。
Python中的注释有单行注释和多行注释。
单行注释:单行注释以井号(#)开头。井号后面的内容都会被Python解释器忽略,例如:
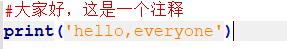
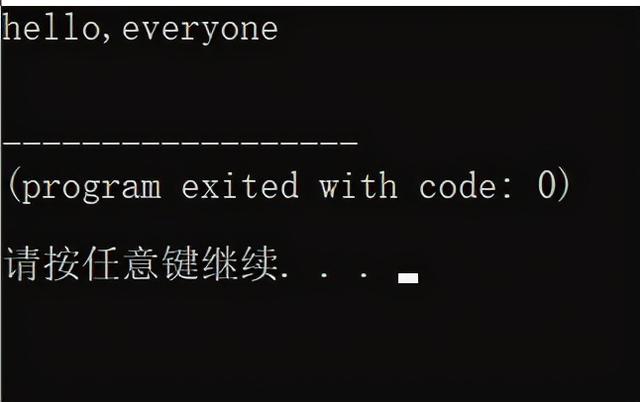
Python将自动忽略第一行,只执行第二行。
多行注释:多行注释用三个单引号(''')或者三个双引号(""")将注释括起来,例如:
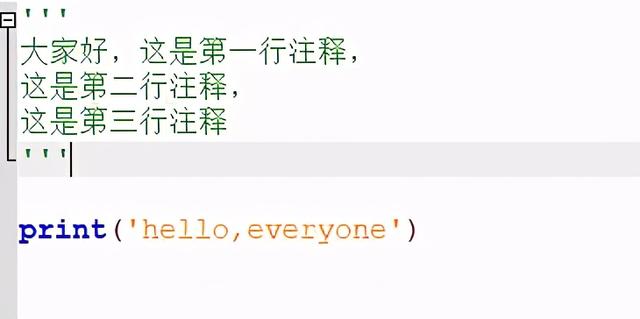
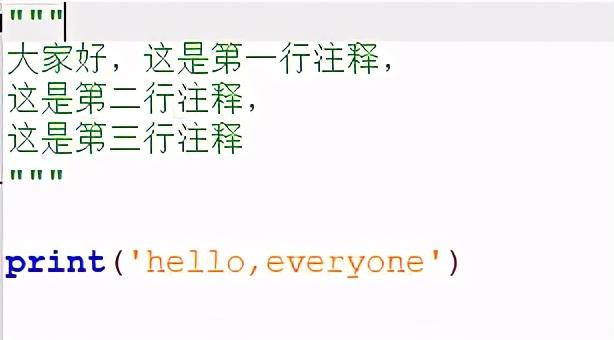
Python将自动忽略引号括起来的内容。
注释该写什么?写注释的主要目的是阐述代码要做什么,以及是如何做的。在开发项目期间,你对各个部分如何协同工作了如指掌,但过一段时间之后,有些细节你可能会忘记。当然你可以重新研究代码来确定各个部分的工作原理,这无疑会花费很多的时间,但如果你写注释后可以清晰快速地了解每个代码的用处以及它们之间是如何配合的等等。
码字不易,望各位点点关注点点赞!谢谢!


 303
303


 被折叠的 条评论
为什么被折叠?
被折叠的 条评论
为什么被折叠?
 到【灌水乐园】发言


