


ComplexHeatmap其实是一个很全面的R包,它除了可以绘制简单热图还有其他复杂实用的热图,这里主要简单的介绍一下如何用这个R包来绘制简单热图 1. 首先按照http://bioconductor.org/packages/release/bioc/vignettes/ComplexHeatmap/inst/doc/s2.single_heatmap.html 创建一个测试数据
library(ComplexHeatmap)
library(circlize)
set.seed(123)
mat = cbind(rbind(matrix(rnorm(16, -1), 4), matrix(rnorm(32, 1), 8)),
rbind(matrix(rnorm(24, 1), 4), matrix(rnorm(48, -1), 8)))
# permute the rows and columns
mat = mat[sample(nrow(mat), nrow(mat)), sample(ncol(mat), ncol(mat))]
rownames(mat) = paste0("R", 1:12)
colnames(mat) = paste0("C", 1:10)
可以使用circlize包里面的colorRampl2函数来设定热图的颜色参数,比如下面例子中的(-3,0,3)分别对应green,white,red三种颜色,但当值是大于3或者小于-3时,则也是对应临界点的green和red
Heatmap(mat, col = colorRamp2(c(-3, 0, 3), c("green", "white", "red")),
cluster_rows = FALSE, cluster_columns = FALSE)
###对于连续型数据
Heatmap(mat, col = rev(rainbow(10)))
###对于离散型数据
discrete_mat = matrix(sample(1:4, 100, replace = TRUE), 10, 10)
colors = structure(circlize::rand_color(4), names = c("1", "2", "3", "4"))
Heatmap(discrete_mat, col = colors)
name 参数来设置图例的名称,column_title 参数来设置列的名称,row_title 参数来设置行的名称, column_title_side 参数设置title的位置,row_title_rot 参数设置row title的方向(垂直 or 水平)
Heatmap(mat, name = "foo", column_title = "I am a column title",
row_title = "I am a row title",column_title_side = "bottom", row_title_rot = 0)
这个包对于cluster的设定有很多参数,比如cluster_rows,逻辑值,表示是否要对行进行聚类,当其为某个特定值时,则表示对行树杈进行处理;show_column_dend,当为逻辑值时,表示是否要显示列的树杈,当为位置值时,表示显示列的位置,row_dend_side也是同理;column_dend_height 表示树杈的高度
Heatmap(mat, name = "foo", cluster_rows = FALSE)
Heatmap(mat, name = "foo", show_column_dend = FALSE)
Heatmap(mat, name = "foo", row_dend_side = "right")
Heatmap(mat, name = "foo", column_dend_height = unit(2, "cm"))
library(dendextend)
dend = hclust(dist(mat))
dend = color_branches(dend, k = 2)
Heatmap(mat, name = "foo", cluster_rows = dend)
cluster的参数除了上述以外,还有对应选择聚类距离的参数,如:clustering_distance_rows,对应行聚类距离的参数,其除了指定某个聚类距离外,还可以调用其他聚类距离相关函数以及自定义函数
Heatmap(mat, name = "foo", clustering_distance_rows = "pearson")
Heatmap(mat, name = "foo", clustering_distance_rows = function(m) dist(m))
Heatmap(mat, name = "foo", clustering_distance_rows = function(x, y) 1 - cor(x, y))
除了设定cluster距离参数,还可以设定hierarchical cluster的方法,clustering_method_rows;这里跟上述的聚类距离一样,除了可以使用默认的hclust()函数里面的参数,还可以调用其他函数;
Heatmap(mat, name = "foo", clustering_method_rows = "single")
library(cluster)
Heatmap(mat, name = "foo", cluster_rows = as.dendrogram(diana(mat)),
cluster_columns = as.dendrogram(agnes(t(mat))))
row_dend_reorder 参数,逻辑值,用于控制对行是否进行排序,默认的开启的;而对于row_order 则可以人为对行进行排序,如下
Heatmap(mat, name = "foo", cluster_rows = FALSE, cluster_columns = FALSE,
row_order = 12:1, column_order = 10:1)
接下来介绍几个对行名 or 列名,或者行树杈 or 列树杈进行自定义的参数, row_names_side 表示行名的位置,row_dend_side 表示行树杈的位置,列也类似;row_names_gp 参数可以控制行名的大小颜色等;
Heatmap(mat, name = "foo", row_names_side = "left", row_dend_side = "right",
column_names_side = "top", column_dend_side = "bottom")
Heatmap(mat, name = "foo", row_names_gp = gpar(col = c(rep("red", 4), rep("blue", 8))))
Heatmap(mat, name = "foo", row_names_gp = gpar(fontsize = 20))
A heatmap can be split by rows. This will enhance the visualization of group separation in the heatmap.The km argument with a value larger than 1 means applying a k-means clustering on rows and clustering is applied on every k-means cluster.其他的分割方式以及排序方式可以查看开头网站里面的介绍
Heatmap(mat, name = "foo", km = 2)
最后就是Self define the heatmap body,其中主要是如何运用cell_fun这个可以自定义的函数,网站里有对其详细的解释,这里就说下如何用其来对热图框中显示数字
Heatmap(mat, name = "foo", cell_fun = function(j, i, x, y, width, height, fill) {
grid.text(sprintf("%.1f", mat[i, j]), x, y, gp = gpar(fontsize = 10))
})
Summary
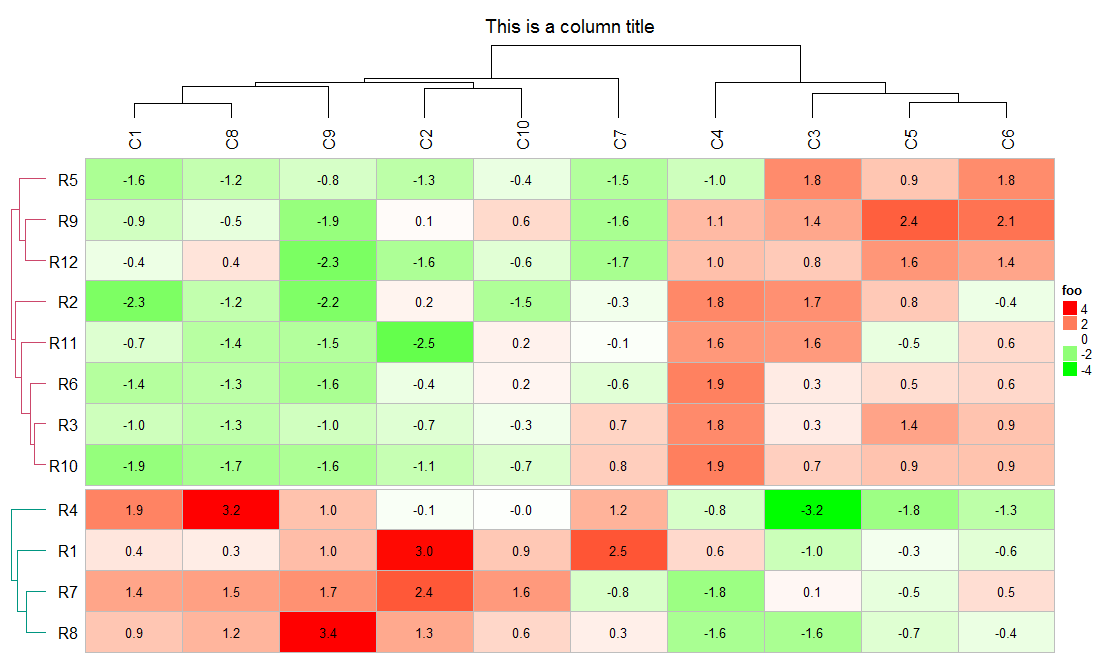
按照以上的参数,通过自定义上述参数,做一张自己想要的热图,如:
library(ComplexHeatmap)
library(circlize)
library(dendextend)
set.seed(1)
mat = cbind(rbind(matrix(rnorm(16, -1), 4), matrix(rnorm(32, 1), 8)),
rbind(matrix(rnorm(24, 1), 4), matrix(rnorm(48, -1), 8)))
# permute the rows and columns
mat = mat[sample(nrow(mat), nrow(mat)), sample(ncol(mat), ncol(mat))]
rownames(mat) = paste0("R", 1:12)
colnames(mat) = paste0("C", 1:10)
# color for dendrogram
dend = hclust(dist(mat))
dend = color_branches(dend, k = 2)
Heatmap(mat,name = "foo",
column_title = "This is a column title",
column_names_side = "top",
row_title_rot = 90,
column_title_rot = 0,
col = colorRamp2(c(-3, 0, 3), c("green", "white", "red")),
cluster_rows = dend,
row_dend_side = "left",
row_names_side = "left",
row_title = c("cluster1","cluster2"),
column_dend_height = unit(2, "cm"),
clustering_method_rows = "complete",
split = 2,
row_title_gp = gpar(col = c("red", "green")),
# row_names_gp = gpar(col = c("red", "green")),
cell_fun = function(j, i, x, y, width, height, fill) {
grid.text(sprintf("%.1f", mat[i, j]), x, y, gp = gpar(fontsize = 10))
grid.rect(x = x, y = y, width = width, height = height, gp = gpar(col = "grey", fill = NA))
}
)


 2882
2882


 被折叠的 条评论
为什么被折叠?
被折叠的 条评论
为什么被折叠?
 到【灌水乐园】发言


