


1.image()介绍
image的用法和plot极其相似。PyQtGraph中的ImageItem是一个用于在图形中显示图像的项目。可以将其用作2D图形的图像显示。您可以使用任何Numpy数组或QImage作为数据源,并对图像进行缩放、平移等操作。
函数原型:pyqtgraph.image(*args, **kargs),创建并返回ImageView 类,显示2D 或 3D 图像数据。接受一个标题参数来设置窗口的标题。所有其他参数都用于显示数据。
源代码:
def image(*args, **kargs):
    """
    Create and return an :class:`ImageView <pyqtgraph.ImageView>`
    Will show 2D or 3D image data.
    Accepts a *title* argument to set the title of the window.
    All other arguments are used to show data. (see :func:`ImageView.setImage() <pyqtgraph.ImageView.setImage>`)
    """
    mkQApp()
    w = ImageView()
    windowTitle = kargs.pop("title", "ImageView")
    w.setWindowTitle(windowTitle)
    w.setImage(*args, **kargs)
    images.append(w)
    w.show()
    return w
2.例程
代码
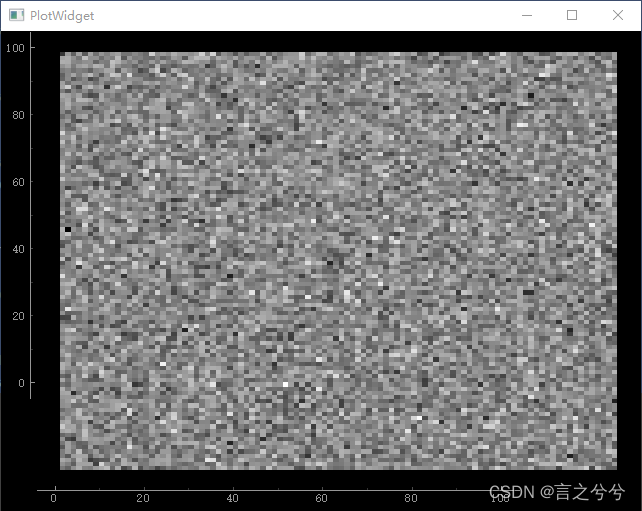
本节介绍了image API的使用,输入的参数tilte和n维array数据,看下面官方的例子:
import sys
import numpy as np
import pyqtgraph as pg
from PyQt5.QtWidgets import QApplication

app = QApplication(sys.argv)

# Create a plot widget
plot = pg.plot()

# Create a 2D numpy array with data
data = np.random.normal(size=(100, 100))

# Create an ImageItem using the data
image = pg.ImageItem(data)

# Add the ImageItem to the plot
plot.addItem(image)

# Show the plot widget
plot.show()

# Start the application event loop
sys.exit(app.exec_())
在这段代码中,我们创建了一个plot对象,并使用np.random.normal生成了一个随机的100x100的二维数组。然后,我们使用这个数组创建了一个ImageItem,并将其添加到了图形中。最后,我们显示了图形,并在app.exec_中运行了应用程序事件循环。
您可以在显示图像时调整大小,旋转和移动图像,并在图像上设置颜色映射等。详细了解更多请参阅PyQtGraph的官方文档。
运行结果:


 913
913


 被折叠的 条评论
为什么被折叠?
被折叠的 条评论
为什么被折叠?
 到【灌水乐园】发言


