


I want a combined plot of two plots + their legend like this:
library(ggplot2)
library(grid)
library(gridExtra)
dsamp
p1
p2
g
legend
grid.arrange(arrangeGrob(p1+theme(legend.position="right"),p2+theme(legend.position="none"),legend,ncol=3,widths=c(3/7,3/7,1/7)))
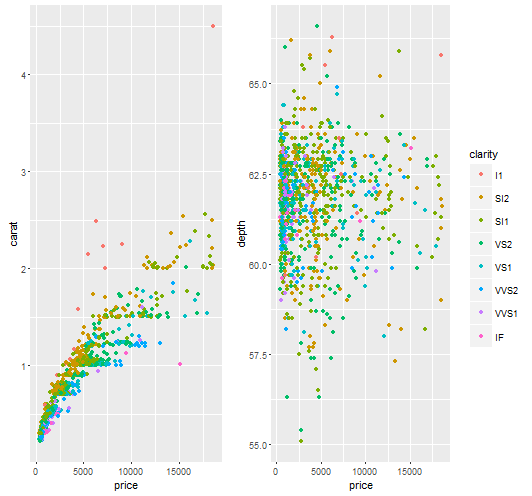
However I do not want to guess the width of the plots and legends (and specify ncol) but have it extracted from p1 and p2 as shown here.
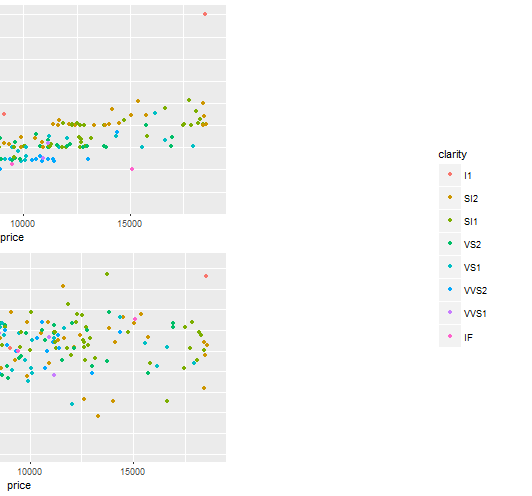
So I expect I would need something like this (adapted code from the link):
grid_arrange_shared_legend_row
plots
g
legend
lwidth
grid.arrange(
do.call(arrangeGrob, lapply(plots, function(x)
x + theme(legend.position="none"))),
legend,
ncol = length(plots)+1,
widths = unit.c(rep(unit(1, "npc") - lwidth, length(plots)), lwidth))
}
grid_arrange_shared_legend_row(p1, p2)
but this is not arranging the two plots in one row but rather one column:
This question is similar to this one here but different in that I am asking for the adapted widths as well. I am using code extracts both from that question + answer and the github.
解决方案
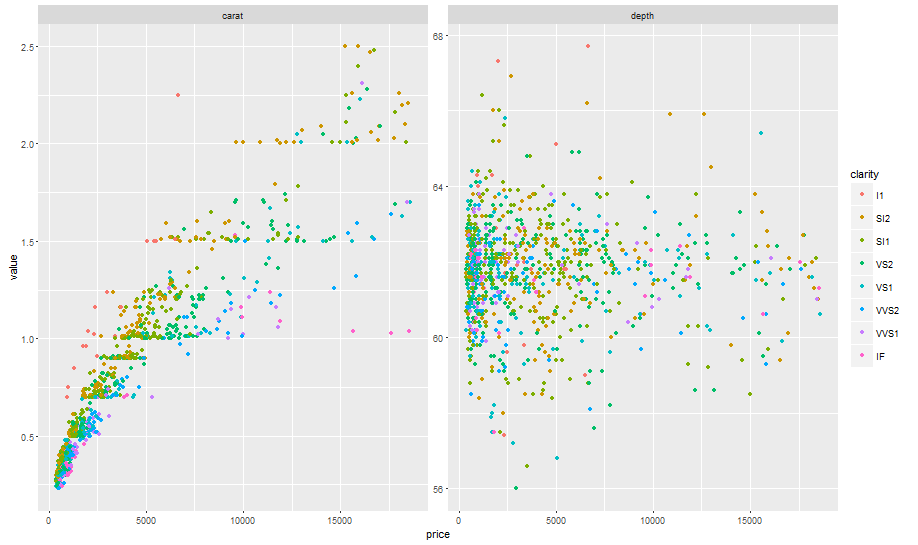
Why don't you use facetting?
library(reshape2)
dmelt
ggplot(dmelt, aes(x = price, y = value, color = clarity)) +
geom_point() +
facet_wrap(~ variable, scales = "free")


 658
658


 被折叠的 条评论
为什么被折叠?
被折叠的 条评论
为什么被折叠?
 到【灌水乐园】发言


