


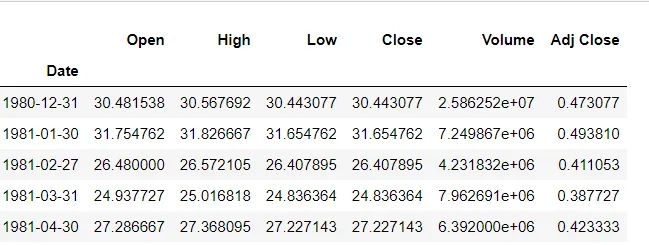
Datatime 作为 Python 中的时间模块类型,处理时间有关数据是非常方便的, Pandas 作为数据分析程序包同样也支持 DataTime 数据机制,例如
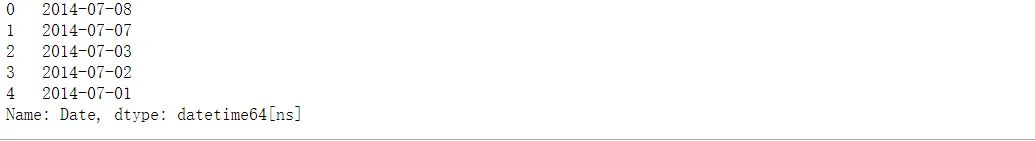
1,函数 to_datetime() 将数据列表中的 Series 列转化为 datetime 类型,
#Convert the type to datetime
apple.Date = pd.to_datetime(apple.Date)
apple['Date'].head()

#
0   2014-07-08
1   2014-07-07
2   2014-07-03
3   2014-07-02
4   2014-07-01
Name: Date, dtype: datetime64[ns]
2,DataFrame.resample(freq),将数据基于时间列以 freq 作为频度做数据重采样,计算出某隔一段时间中数据总值、均值、方差等指标
下面例子中数据列表的索引就是 Datatime 数据格式,最终计算得到以月为时间单位求出各列数据的平均值
# Resample the data based the offset,get the mean of data
# BM — bussiness month end frequency

apple_month = apple.resample("BM").mean()
apple_month.head()
下面将根据两套习题,简单介绍一下 Pandas 是怎么使用 DataFrame 数据的
1 , to_datetime() 与 resample() 操作
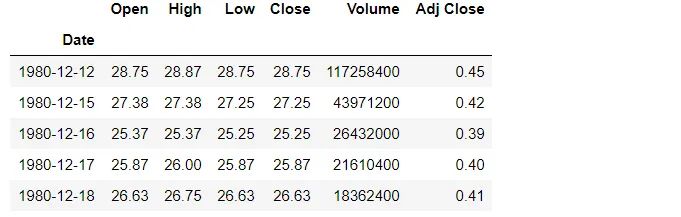
1.1,读取数据
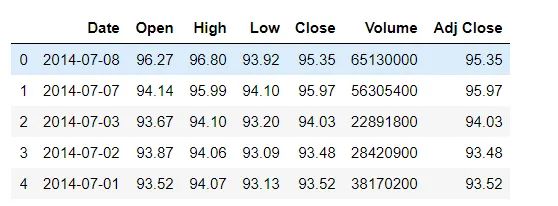
url = "https://raw.githubusercontent.com/guipsamora/pandas_exercises/master/09_Time_Series/Apple_Stock/appl_1980_2014.csv"
apple =pd.read_csv(url)
apple.head()
从上面数据中可以看到时间在 Date 这一列,但却不是标准的 datetime 格式,需要格式处理一下
1.2,datetime 格式转换
#Convert the type to datetime
apple.Date = pd.to_datetime(apple.Date)
apple['Date'].head()
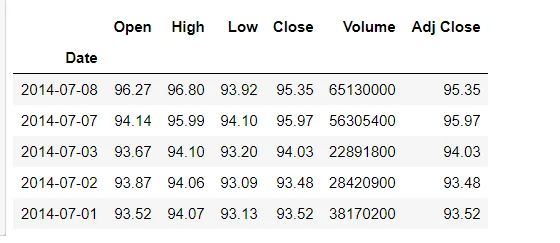
**1.3,将 Date 列设为 index **
需要注意一点的是,后续的 采样(resample) 操作都是基于 时间列为索引列这一条件的,因此需要索引列设置,
apple = apple.set_index("Date")
# Set Index
apple.head()
Date 虽然已经设为 index,但是时间排列却并不清晰,这里用 sort_index(ascending = True) 直接对其进行正向排序
1.4,对索引进行排序
# Sort The DataFrame based on Date columns
apple.sort_index(ascending = True).head()
1.5,以月为单位对数据采样并获取mean()
# Resample the data based the offset,get the mean of data
# BM — bussiness month end frequency

apple_month = apple.resample("BM").mean()
apple_month.head()
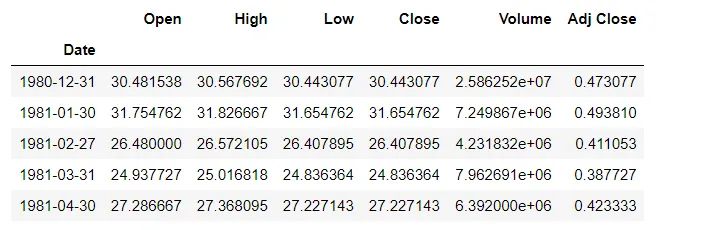
BM 全称 Bussiness Month,是商业月的意思,在 Pandas 中称为 DataOffset,除了月之外,还提供年、日、秒、小时、分..等作为采样单位,当然也可以自定义 DataOffset.
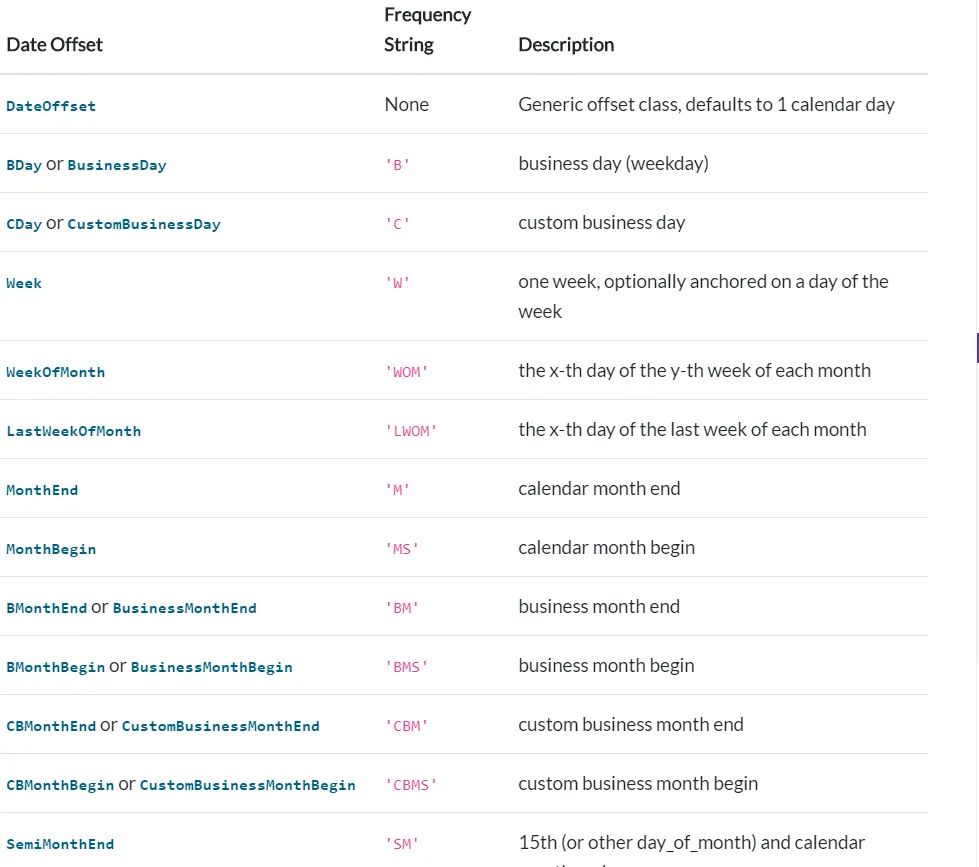
关于 Data Offset 具体详细内容可参考:https://pandas.pydata.org/docs/user_guide/timeseries.html#timeseries-offset-aliases;
1.6,计算时间列表中最早日期与最晚日期相差天数
(apple.index.max()-apple.index.min()).days

#
12261
2,统计近两年苹果、特斯拉、IBM、LINKD各公司股价
2.1,pandas_datareader 获取数据
import pandas as pd
from pandas_datareader import data as web
import datetime as dt
start = dt.datetime(2019,1,1)
end = dt.datetime.today()
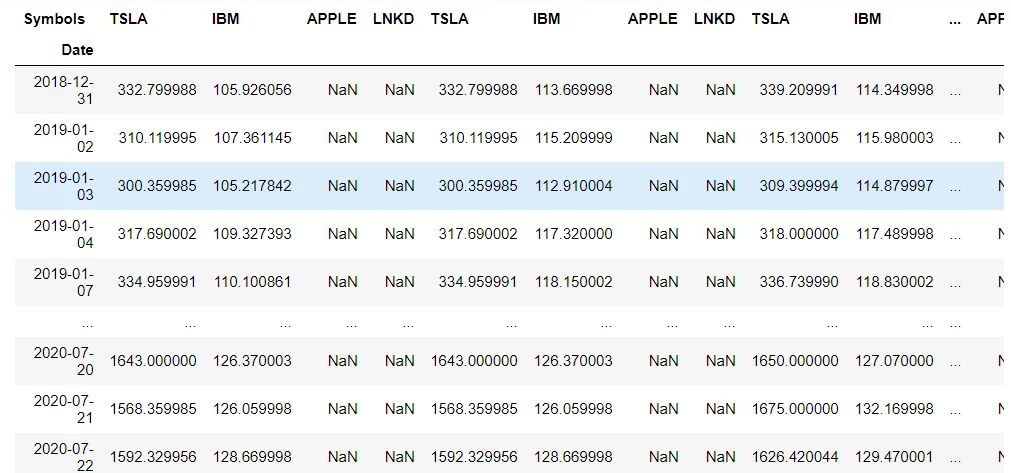
stocks = ['APPLE','TSLA','IBM','LNKD']
df = web.DataReader(stocks,'yahoo',start,end)
df
使用之前请确保pandas_datareader 包已经安装成功,这个包帮助我们直接通过爬虫获取近两年的各公司的股票信息,后面 start,end 两个 datetime 时间用于限制时间
结果显示似乎这种方法获取不到到的苹果和LINKD 的股价(但并不影响,因为这里主要是学习一下 datetime 在 Pandas 的用法)
2.2,获取 股票 数据
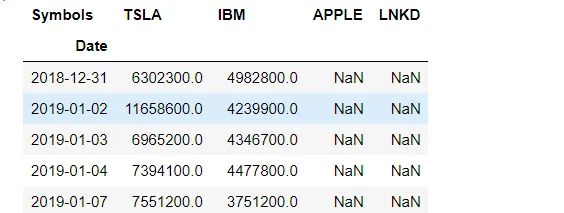
vol = df['Volume']
vol
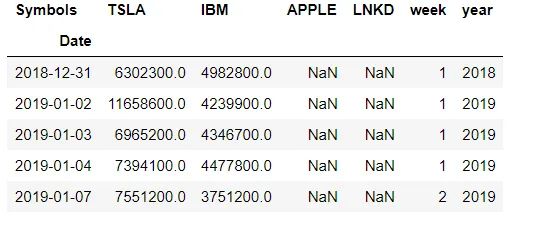
**2.3,创建新列,表示 week、year **
后面做聚类分析,聚类基准选择的是 week、year , 因此需要提前创建好两列(week,year)数据
vol['week'] = vol.index.week
vol['year'] = vol.index.year
vol.head()
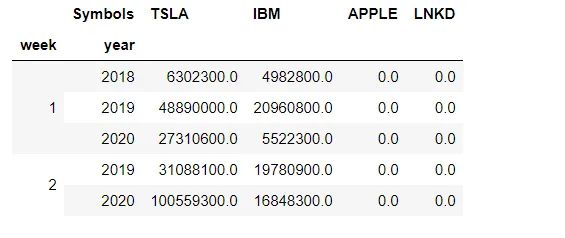
2.4,groupby 聚类分组(先 week ,后 year)
week = vol.groupby(['week','year']).sum()

week.head()
这样就可以很清晰地比对,2019-2020年对于每一周来说各公司股票的总值变化啦
好了,以上就是本篇文章的所有内容啦;如果有什么疑问或者想表达的,欢迎在下面留言区进行留言。
最后,感谢大家的阅读!
Reference:
1,https://pandas.pydata.org/docs/user_guide/timeseries.html#timeseries-offset-aliases
2,https://github.com/guipsamora/pandas_exercises/blob/master/09_Time_Series/Getting_Financial_Data
推荐阅读:
19 个接私活平台汇总升级版,你有技术就有钱
Python 计算 0.1+0.2≠0.3?6 张图搞清楚原理!


 530
530


 被折叠的 条评论
为什么被折叠?
被折叠的 条评论
为什么被折叠?
 到【灌水乐园】发言


