


最近自己经常遇到matplotlib的OO API和pyplot包混乱不分的情况,所以抽时间好好把matplotlib的文档读了一下,下面是大概的翻译和总结。很多基础的东西还是要系统地掌握牢固哇~~
要素
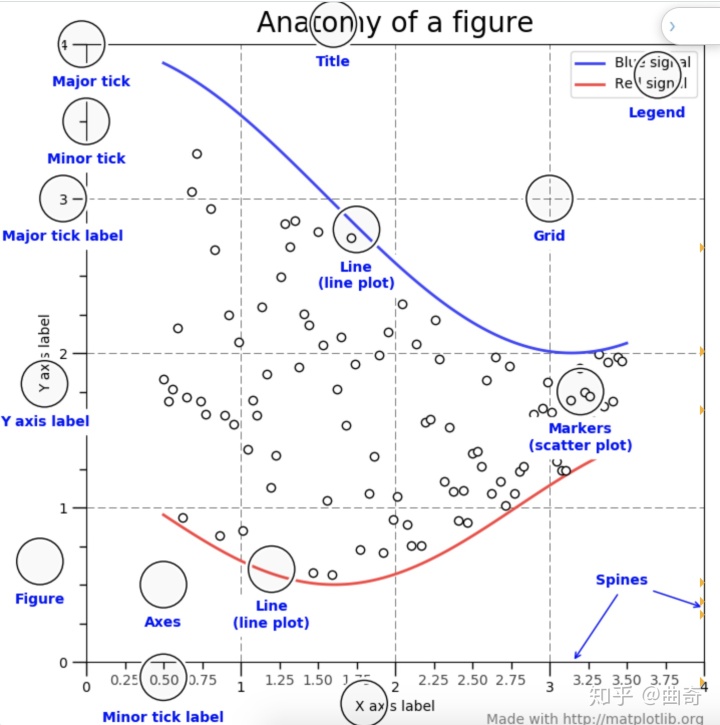
Figure
就是整个图片,像弹出的窗口windows和Jupyter widgets,用于track所有的Axes,artists(titiles,legend)和canvas(用户不怎么接触到)。一个figure可以包含任何数量的Axes,至少有一个。最简单的创建新的figure的方法是:
fig = plt.figure()  # an empty figure with no Axes
fig, ax = plt.subplots()  # a figure with a single Axes
fig, axs = plt.subplots(2, 2)  # a figure with a 2x2 grid of Axes
这是最简单的创建axes的方法,但之后也可以再加axes,允许更加复杂的axes layout。
Axes
data points放置的区域(x-y坐标或者x-y-z坐标)。Axes包含两个或三个Axis对象,Axis对象能够控制data limits(axes.Axes.set_xlim()和 axes.Axes.set_ylim())。
每个Axes有一个title,x-label和y-label,分别通过(axes.Axes.set_title(),axes.Axes.set_xlabel(),axes.Axes.set_ylabel()控制)
Axes类和它的成员方法是Object-oriented的主要入口。
Axis
就是底下那种数字和线的组合。控制limits,ticks和ticklabels。
ticks的位置是由Locator对象控制的,ticklabel的字符串是由Formatter对象控制的。
Artist
基础上来说图片上看到的每一样东西都是一个artist(包括Figure,Axes和Axis对象)。还包括 Text对象, Line2D对象, collections对象,Patch对象等。所有的Artist都被画到canvas上。大多数Artists都和Axes绑定了,这样一个Artist不能被多个Axes分享。
输入的种类
只能是 numpy.array or numpy.ma.masked_array
其他的像pandas对象或np.matrix不能作为输入。list可以被自动转为array。
可以这样转为np.array
a = pandas.DataFrame(np.random.rand(4, 5), columns = list('abcde'))
a_asarray = a.values

b = np.matrix([[1, 2], [3, 4]])
b_asarray = np.asarray(b)
object-oriented interface和pyplot interface
有两种方法去使用matplotlib,两种方法很多函数是一样的:
- 显式地创建figures和axes,然后在调用这些对象的方法。
- 依靠pyplot自动创建和管理figures和axes,然后使用pyplot函数画图。
下面这种是OO-style
x = np.linspace(0, 2, 100)

# Note that even in the OO-style, we use `.pyplot.figure` to create the figure.
fig, ax = plt.subplots()  # Create a figure and an axes.
ax.plot(x, x, label='linear')  # Plot some data on the axes.
ax.plot(x, x**2, label='quadratic')  # Plot more data on the axes...
ax.plot(x, x**3, label='cubic')  # ... and some more.
ax.set_xlabel('x label')  # Add an x-label to the axes.
ax.set_ylabel('y label')  # Add a y-label to the axes.
ax.set_title("Simple Plot")  # Add a title to the axes.
ax.legend()  # Add a legend.
或者pyplot-style
x = np.linspace(0, 2, 100)

plt.plot(x, x, label='linear')  # Plot some data on the (implicit) axes.
plt.plot(x, x**2, label='quadratic')  # etc.
plt.plot(x, x**3, label='cubic')
plt.xlabel('x label')
plt.ylabel('y label')
plt.title("Simple Plot")
plt.legend()
matplotlib的教程一般都包含OO或者pyplot两种方法,两种都可以,但是需要注意的是不要混合使用。通常,pyplot用在interactive plotting像jupyter notebook里面,OO-style用在non-interactive像函数或脚本里面能够在大项目里重用的。
在老版本的matplotlib里面还有一个pylab的interface,现在比较少用。
有时需要用不同的数据重用一个画图函数,建议采用如下的函数签名
def my_plotter(ax, data1, data2, param_dict):
    """
    A helper function to make a graph

    Parameters
    ----------
    ax : Axes
        The axes to draw to

    data1 : array
       The x data

    data2 : array
       The y data

    param_dict : dict
       Dictionary of kwargs to pass to ax.plot

    Returns
    -------
    out : list
        list of artists added
    """
    out = ax.plot(data1, data2, **param_dict)
    return out
然后这样使用它
data1, data2, data3, data4 = np.random.randn(4, 100)
fig, ax = plt.subplots(1, 1)
my_plotter(ax, data1, data2, {'marker': 'x'})
或者两个sub-plots
fig, (ax1, ax2) = plt.subplots(1, 2)
my_plotter(ax1, data1, data2, {'marker': 'x'})
my_plotter(ax2, data3, data4, {'marker': 'o'})
backends
什么是backend?backend就是做了所有的复杂工作去把图片渲染出来。有两种backends:user interface backend(pygtk, wxpython, tkinter, qt4, or macosx),和hardcopy backend(PNG, SVG, PDF, PS)
设置backend的方法
三种,优先级别是1<2<3
- The
rcParams["backend"](default:'agg') parameter in yourmatplotlibrcfile - The
MPLBACKENDenvironment variable - The function matplotlib.use()
import matplotlib as mpl
mpl.rcParams['backend'] = ‘agg’
或设置环境变量,不推荐
unix
> export MPLBACKEND=qt5agg
> python simple_plot.py

> MPLBACKEND=qt5agg python simple_plot.py
或直接使用use函数,需要在任何figure创建之前use。
import matplotlib
matplotlib.use('qt5agg')
一般来说,matplotlib会自动选择默认的backend来完成interactive work和脚本中画图。
什么是interactive mode
interactive允许动态显示画图的修改。做一个动作显示一个。能够通过这两个方法来控制interactive mode开和关。matplotlib.pyplot.ion(), matplotlib.pyplot.ioff()。
注意interactive mode只能够在ipython或原始的python shell中使用,不支持IDLE IDE。
import matplotlib.pyplot as plt
plt.ion()
plt.plot([1.6, 2.7])
可以在做动作能够即时刷新并显示
plt.title("interactive test")
plt.xlabel("index")
也能够拿到当前的Axes实例,然后调用实例的方法
ax = plt.gca()
ax.plot([3.1, 2.2])
在特定的backends(像macosx),或老版本的matplotlib,可能不会即时显示,可以调用plot.draw()方法去更新。
non-interactive
import matplotlib.pyplot as plt
plt.ioff()
plt.plot([1.6, 2.7])
这样子什么都没有发生(macosx可能会有图片),为了看到图片,需要调用plt.show()。调用了show方法之后,show方法把刚刚的input都一起执行,然后把当前进程暂停block一下,这个时候terminal command是unresponsive的,除非你手动关掉plot window。这样子的好处就是,像以前执行一个脚本的时候,你还没有看清图片,一闪而过就没了,这样子图片能够停留等待你的反馈。
在non-interactive mode中,所有的动作都是delay的,等到show函数调用了才执行。
show函数能够被调用多次,上一个图片窗口关闭之后,再显示下一张图片。(python shell)
import numpy as np
import matplotlib.pyplot as plt

plt.ioff()
for i in range(3):
    plt.plot(np.random.rand(10))
    plt.show()
小结interactive和non-interactive
- interactive
pyplot自动画图
如果使用OO方法,调用draw()函数去刷新 - Non-interactive
方便在脚本中生成一张或多张图片。使用show()函数去显示所有图片,并且会暂停block进程直到手动destroy这些图片。
性能
感觉用到不多
line simplify
import numpy as np
import matplotlib.pyplot as plt
import matplotlib as mpl

# Setup, and create the data to plot
y = np.random.rand(100000)
y[50000:] *= 2
y[np.geomspace(10, 50000, 400).astype(int)] = -1
mpl.rcParams['path.simplify'] = True

mpl.rcParams['path.simplify_threshold'] = 0.0
plt.plot(y)
plt.show()

mpl.rcParams['path.simplify_threshold'] = 1.0
plt.plot(y)
plt.show()
参考
https://matplotlib.org/tutorials/introductory/usage.html#sphx-glr-tutorials-introductory-usage-py


 713
713


 被折叠的 条评论
为什么被折叠?
被折叠的 条评论
为什么被折叠?
 到【灌水乐园】发言


