


01、Prometheus监控系统安装部署-CSDN博客
一、概述
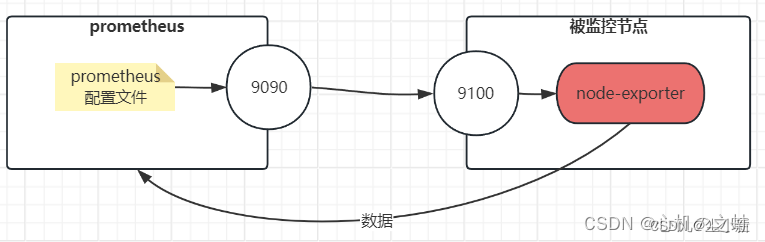
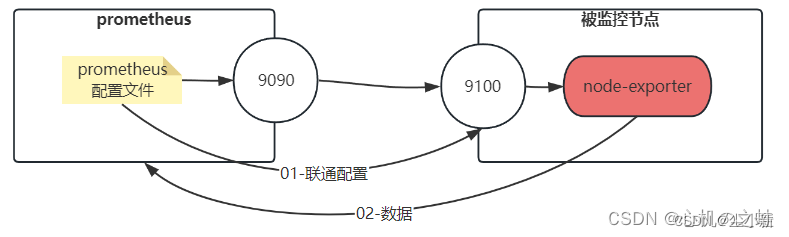
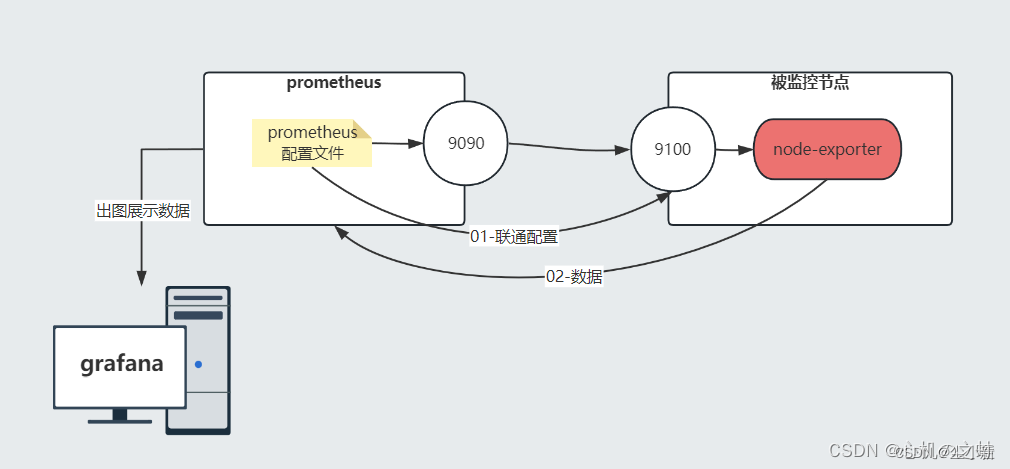
prometheus,本身是一个【数据收集】和【数据处理】的工具,如果效果要监控一台服务器物理机,有两种方式,一种是在物理机上部署“node-export”来收集数据上报给prometheus,另一种是“自定义监控”;
node-exporter,就是将服务器物理机的数据,收集好,不需要运维人员自己配置了,是一个比较简单的监控物理机的组件;
本节,我们就来讲述node-exporter的使用方式,及prometheus如何来查询数据;
二、被监控节点安装node-exporter
1,准备一台被监控机器
192.168.190.12 prometheus2 1c1g20GB
2,上传安装包
给大家准备了安装包在百度云盘
链接:https://pan.baidu.com/s/1es-MFSjp4HNzercDiY-1Cg?pwd=ctk8
提取码:ctk8
· 创建工作目录
[root@prometheus2 ~]# mkdir -pv /node-export/{soft,data,logs}
mkdir: 已创建目录 "/node-export"
mkdir: 已创建目录 "/node-export/soft"
mkdir: 已创建目录 "/node-export/data"
mkdir: 已创建目录 "/node-export/logs"
[root@prometheus2 ~]# cd /node-export/soft/
· 上传解压安装包
[root@prometheus2 soft]# rz
[root@prometheus2 soft]# ll
总用量 10128
-r--------. 1 root root 10368103 5月 14 16:33 node_exporter-1.6.1.linux-amd64.tar.gz
[root@prometheus2 soft]# tar xf node_exporter-1.6.1.linux-amd64.tar.gz
[root@prometheus2 soft]# ll
总用量 10128
drwxr-xr-x. 2 1001 1002 56 7月 17 2023 node_exporter-1.6.1.linux-amd64
-rw-------. 1 root root 10368103 5月 14 16:33 node_exporter-1.6.1.linux-amd64.tar.gz
· 创建软连接
[root@prometheus2 soft]# ln -sv /node-export/soft/node_exporter-1.6.1.linux-amd64 /node-export/soft/node-exporter
"/node-export/soft/node-exporter" -> "/node-export/soft/node_exporter-1.6.1.linux-amd64"
[root@prometheus2 soft]# ll
总用量 10128
lrwxrwxrwx. 1 root root 49 5月 14 16:44 node-exporter -> /node-export/soft/node_exporter-1.6.1.linux-amd64
drwxr-xr-x. 2 1001 1002 56 7月 17 2023 node_exporter-1.6.1.linux-amd64
-rw-------. 1 root root 10368103 5月 14 16:33 node_exporter-1.6.1.linux-amd64.tar.gz
3,配置systemctl启动node-exporter
· 编辑启动文件
[root@prometheus2 soft]# vim /etc/systemd/system/node-exporter.service
[Unit]
Description=dolphin node-exporter
Documentation=https://prometheus.io/docs/introduction/overview/
After=network.target[Service]
Restart=on-failure
ExecStart=/node-export/soft/node-exporter/node_exporter
ExecReload=/bin/kill -HUP \$MAINPID
LimitNOFILE=65535[Install]
WantedBy=multi-user.target
~
· 重新加载systemd启动node-exporter
[root@prometheus2 soft]# systemctl daemon-reload
[root@prometheus2 soft]# systemctl enable --now node-exporter.service
Created symlink from /etc/systemd/system/multi-user.target.wants/node-exporter.service to /etc/systemd/system/node-exporter.service.
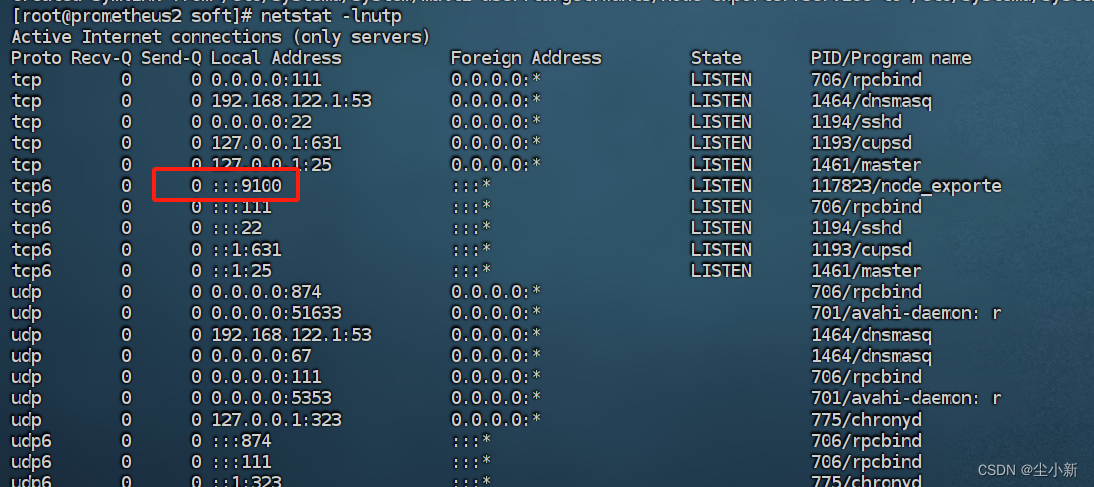
· 检测是否启动成功
[root@prometheus2 soft]# netstat -lnutp
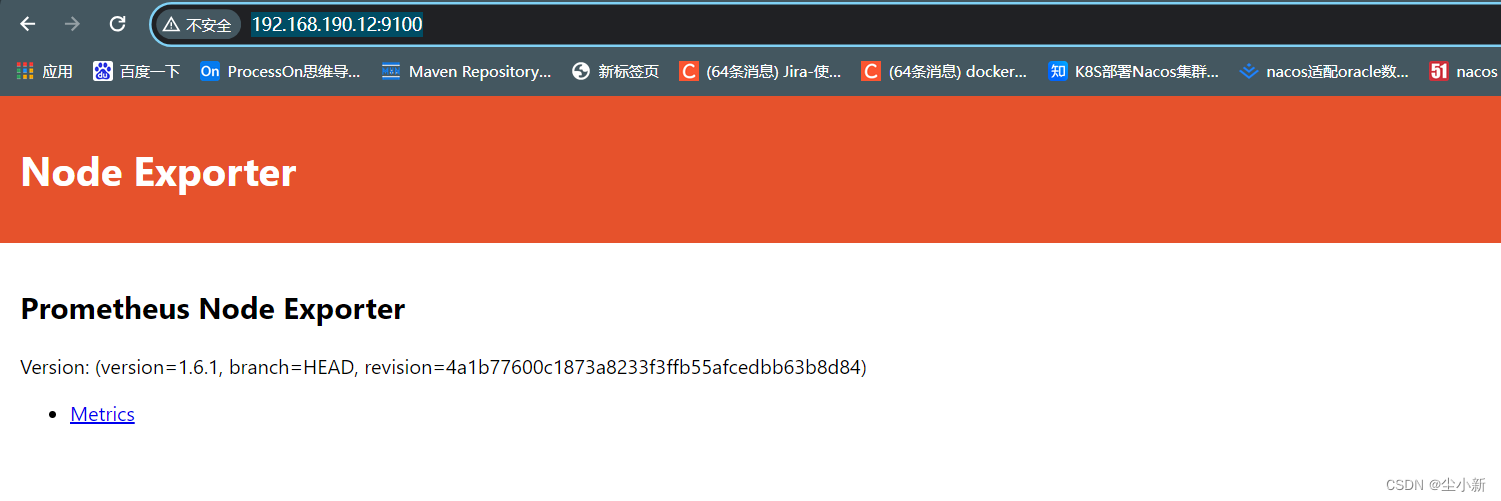
· 浏览器访问
此时,被监控节点的node-exporter部署完毕
三、配置prometheus收集node-exporter采集的数据
1,编辑prometheus配置文件
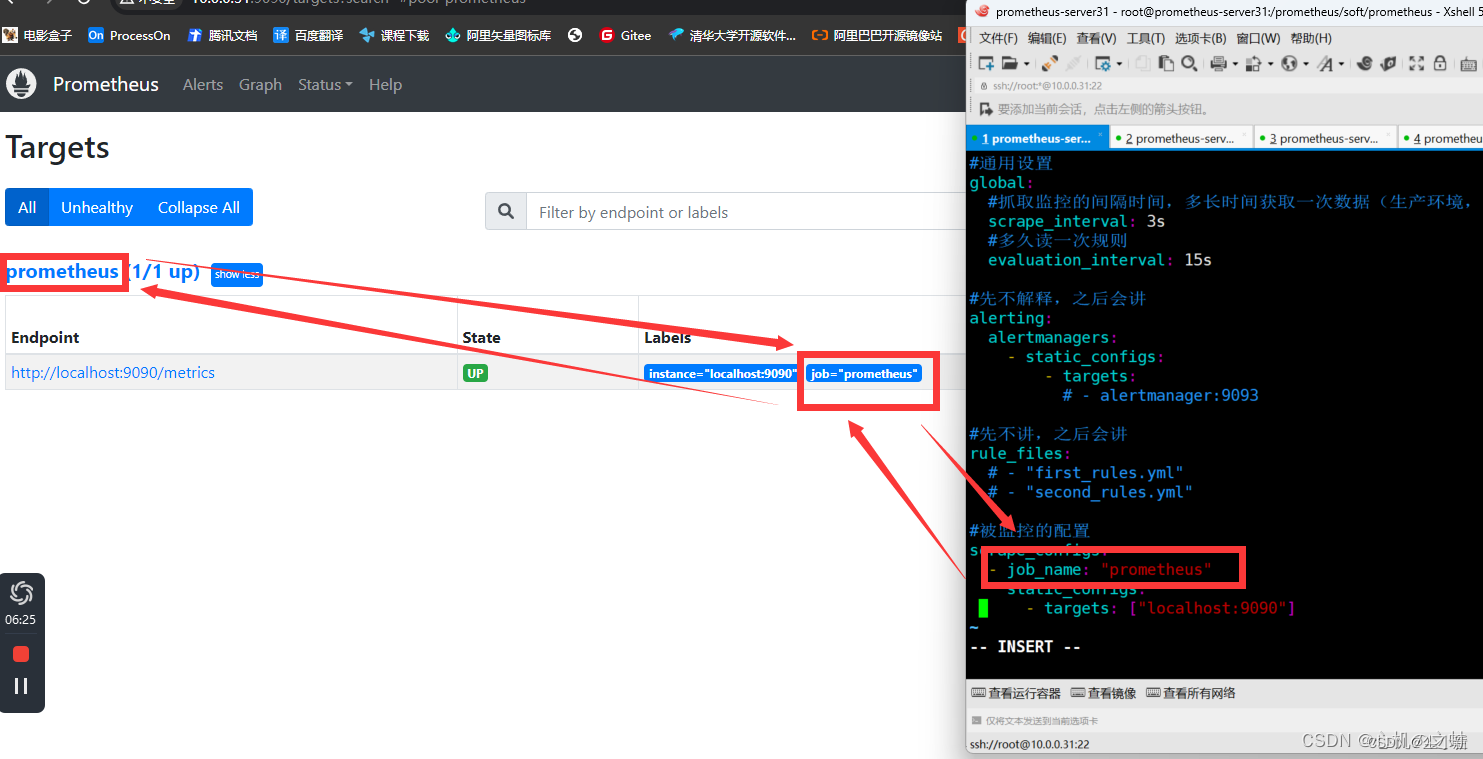
[root@prometheus1 prometheus]# vim /prometheus/soft/prometheus/prometheus.yml
global:
#抓取监控的间隔时间,多长时间获取一次数据(生产环境,建议15-30s);
scrape_interval: 3s
#多久读一次规则
evaluation_interval: 15s
#先不解释,之后会讲
alerting:
alertmanagers:
- static_configs:
- targets:
# - alertmanager:9093
#先不讲,之后会讲
rule_files:
# - "first_rules.yml"
# - "second_rules.yml"
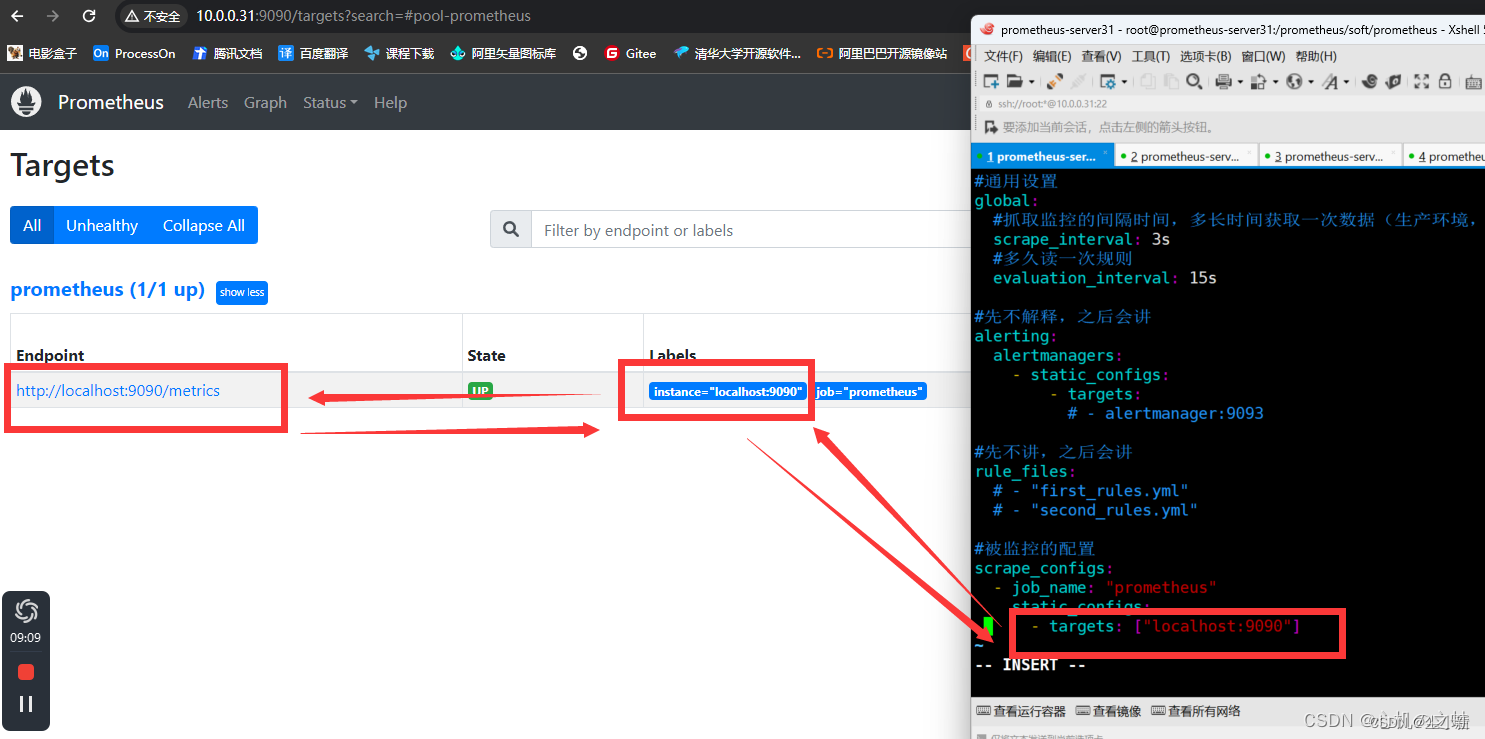
#被监控的配置
scrape_configs:
- job_name: "prometheus"
static_configs:
- targets: ["localhost:9090"]
#另起一个job名称,被监控的主体自定义名称
- job_name: "node-exporter"
static_configs:
#被监控的数据抓取地址;
- targets: ["192.168.190.12:9100"]
·【job】的配置释义
·【监控地址/目标】的配置释义
2,重新加载prometheus服务
#能连接上地址的服务器都可执行该命令
[root@prometheus2 soft]# curl -X POST http://192.168.190.11:9090/-/reload
3,刷新prometheus页面
此时,就会看到,新配置的被监控项主体的指标列表;
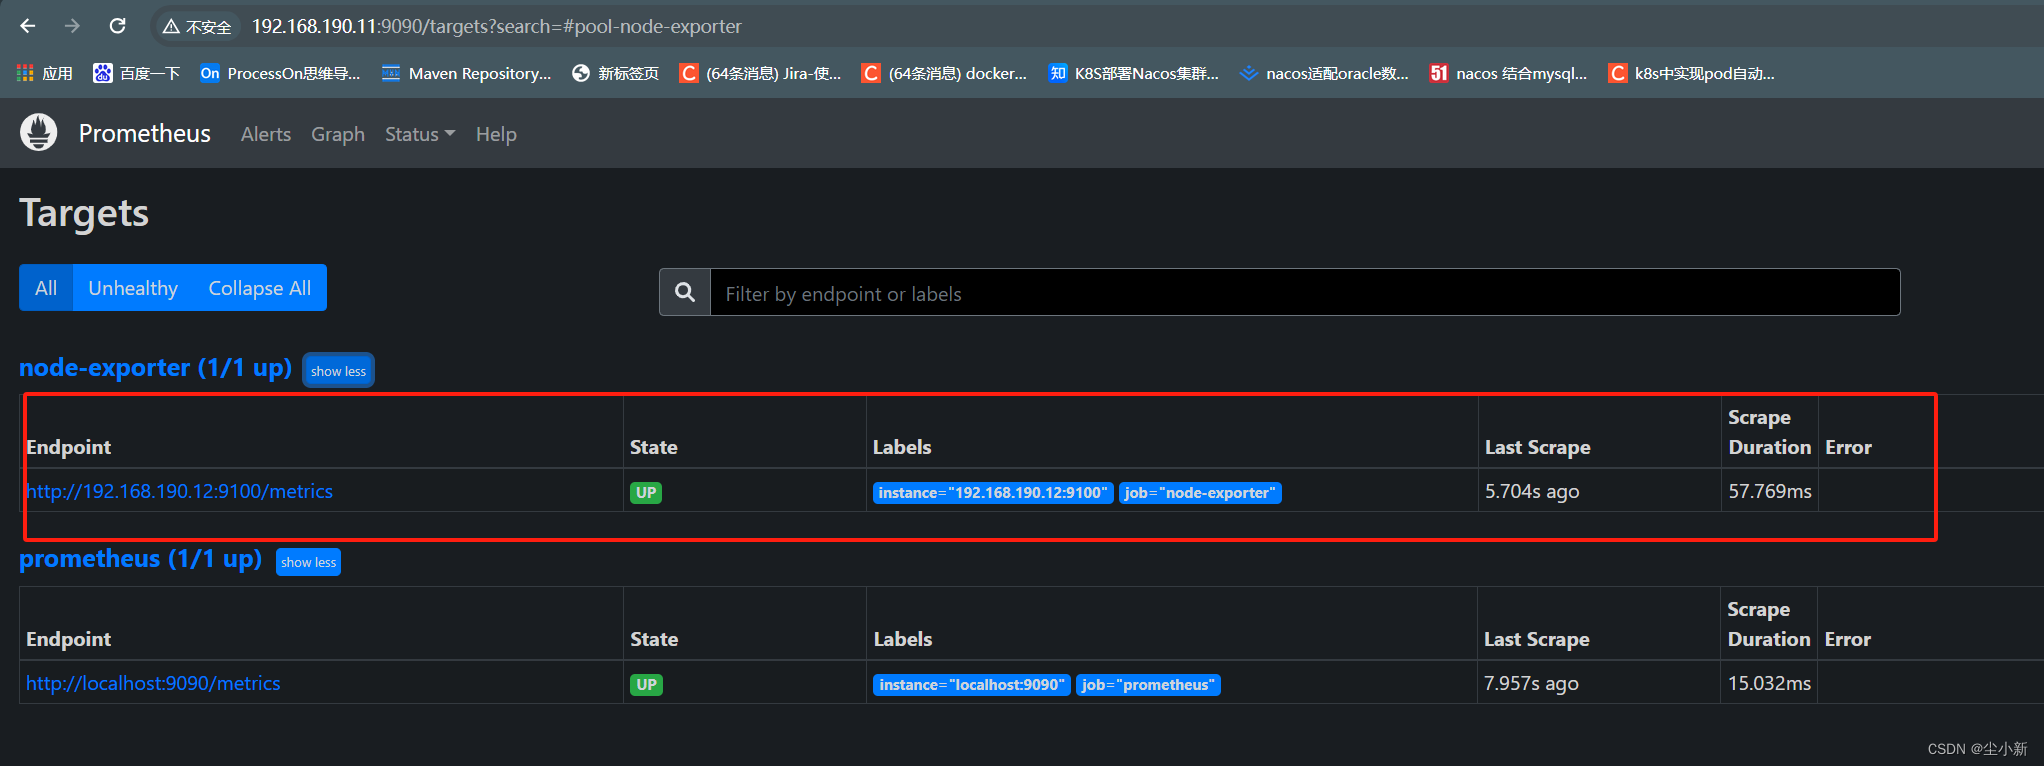
至此,prometheus收集node-exporter的数据就配置成功;
四、PromeQL语句
我们现在已经将被监控的服务器的数据采集到了“prometheus”,那么如何操作这些数据呐?
就涉及到了,prometheus操作数据的语句:【PromeQL】
1,了解数据的结构
想要操作数据,我们需要先知道,数据长什么样子?
· 查看数据
浏览器访问Node Exporter http://192.168.190.12:9100/
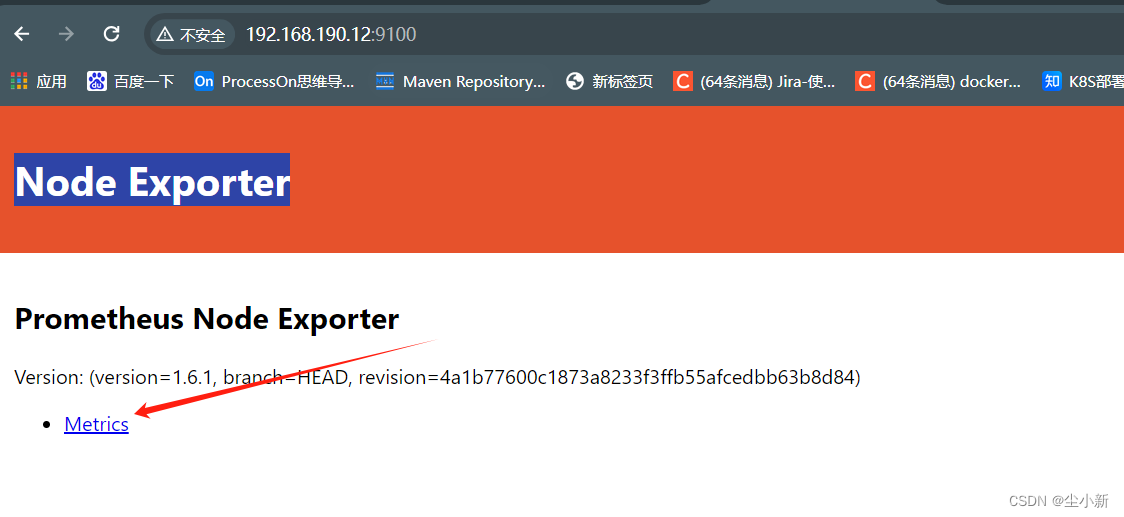
· 数据的结构介绍
点击Metrics之后,就可以看到,node-exporter采集的数据;
数据包含结构:
1,数据类型【TYPE】
2,数据的key { 数据的value }
也就是说,数据是以key{value}的形式,展示的;
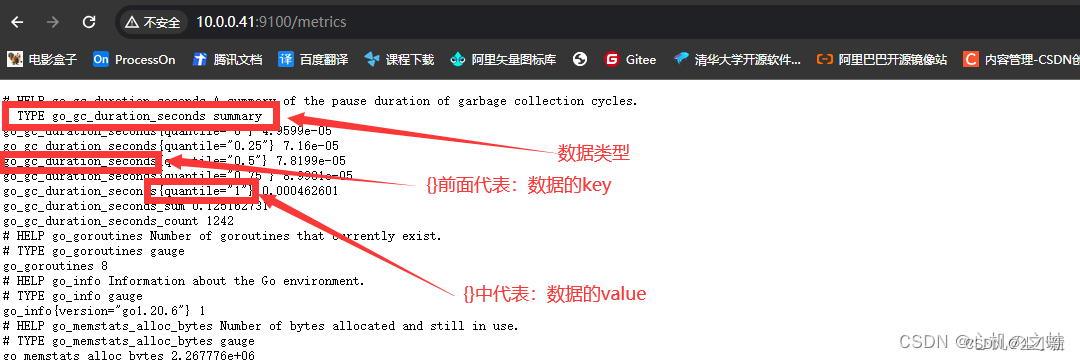
至于数据类型,以后再说,现在不着急;
2,PromeQL语句的简单实用
· 查看节点存活监控【up】
up #代表查看所有被监控节点是否存活
1表示存活;
0表示存活;
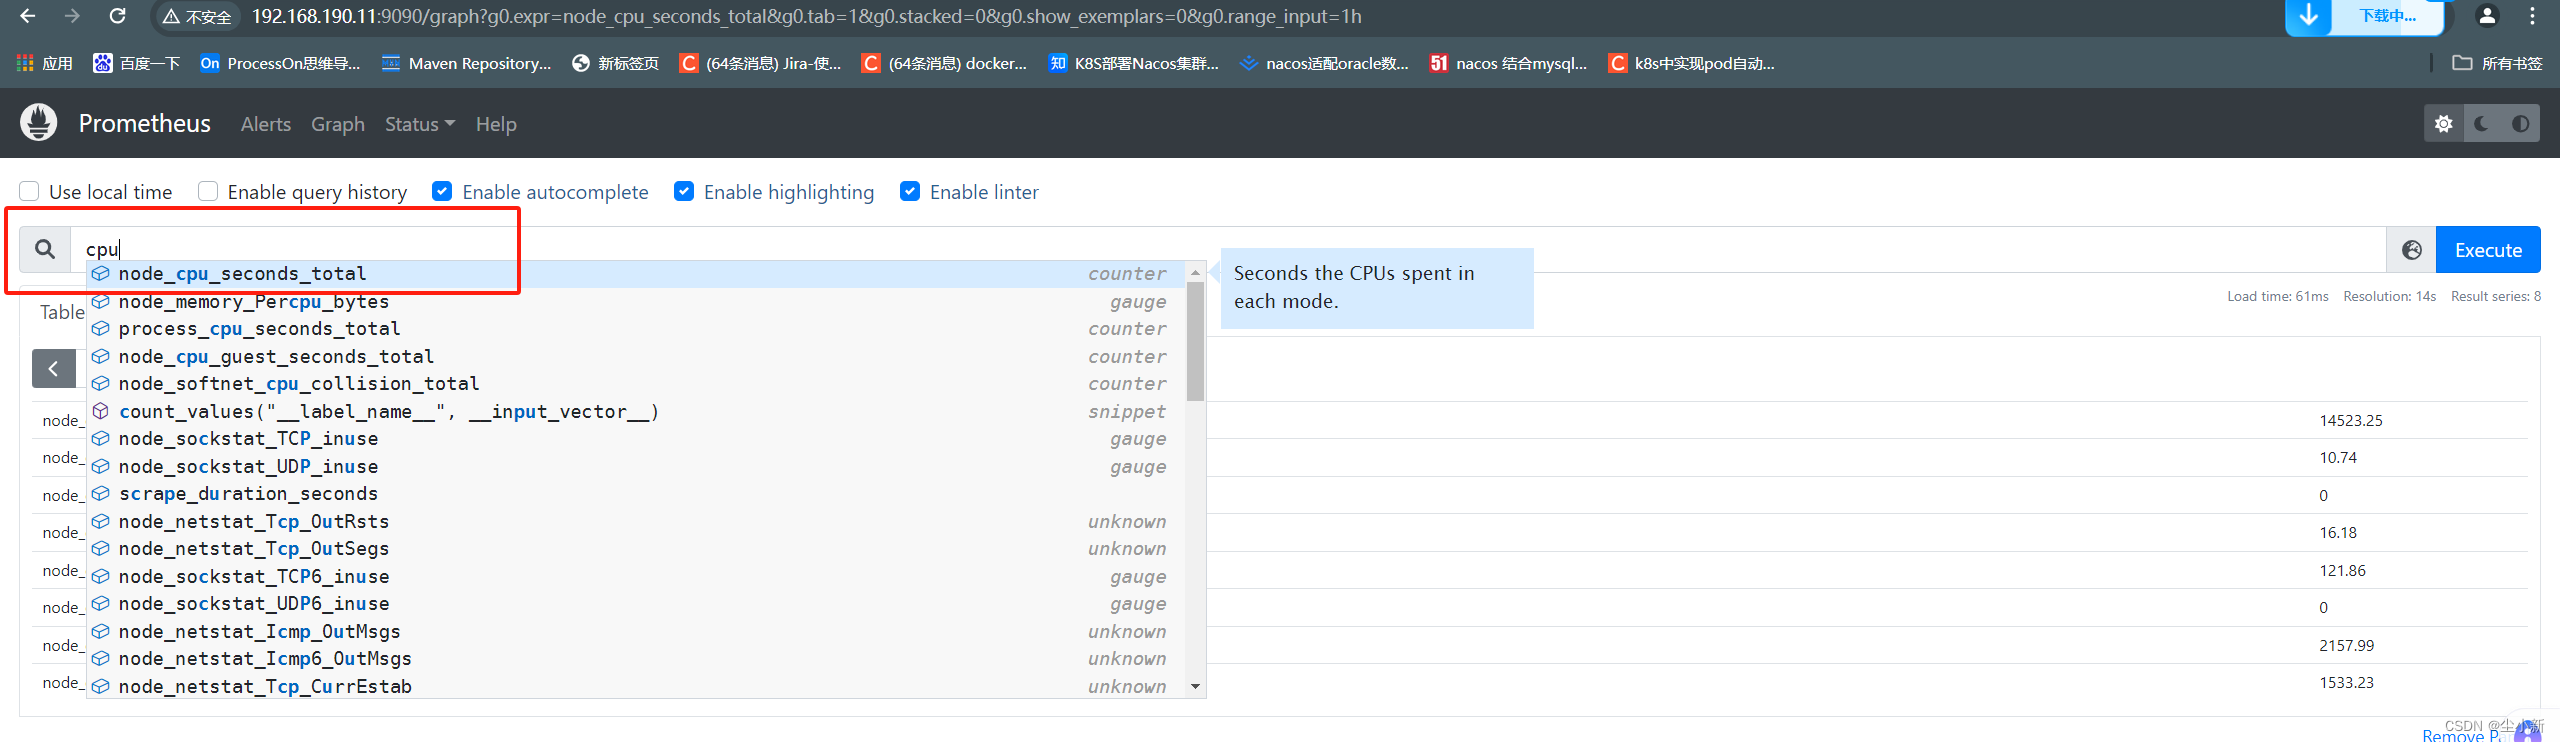
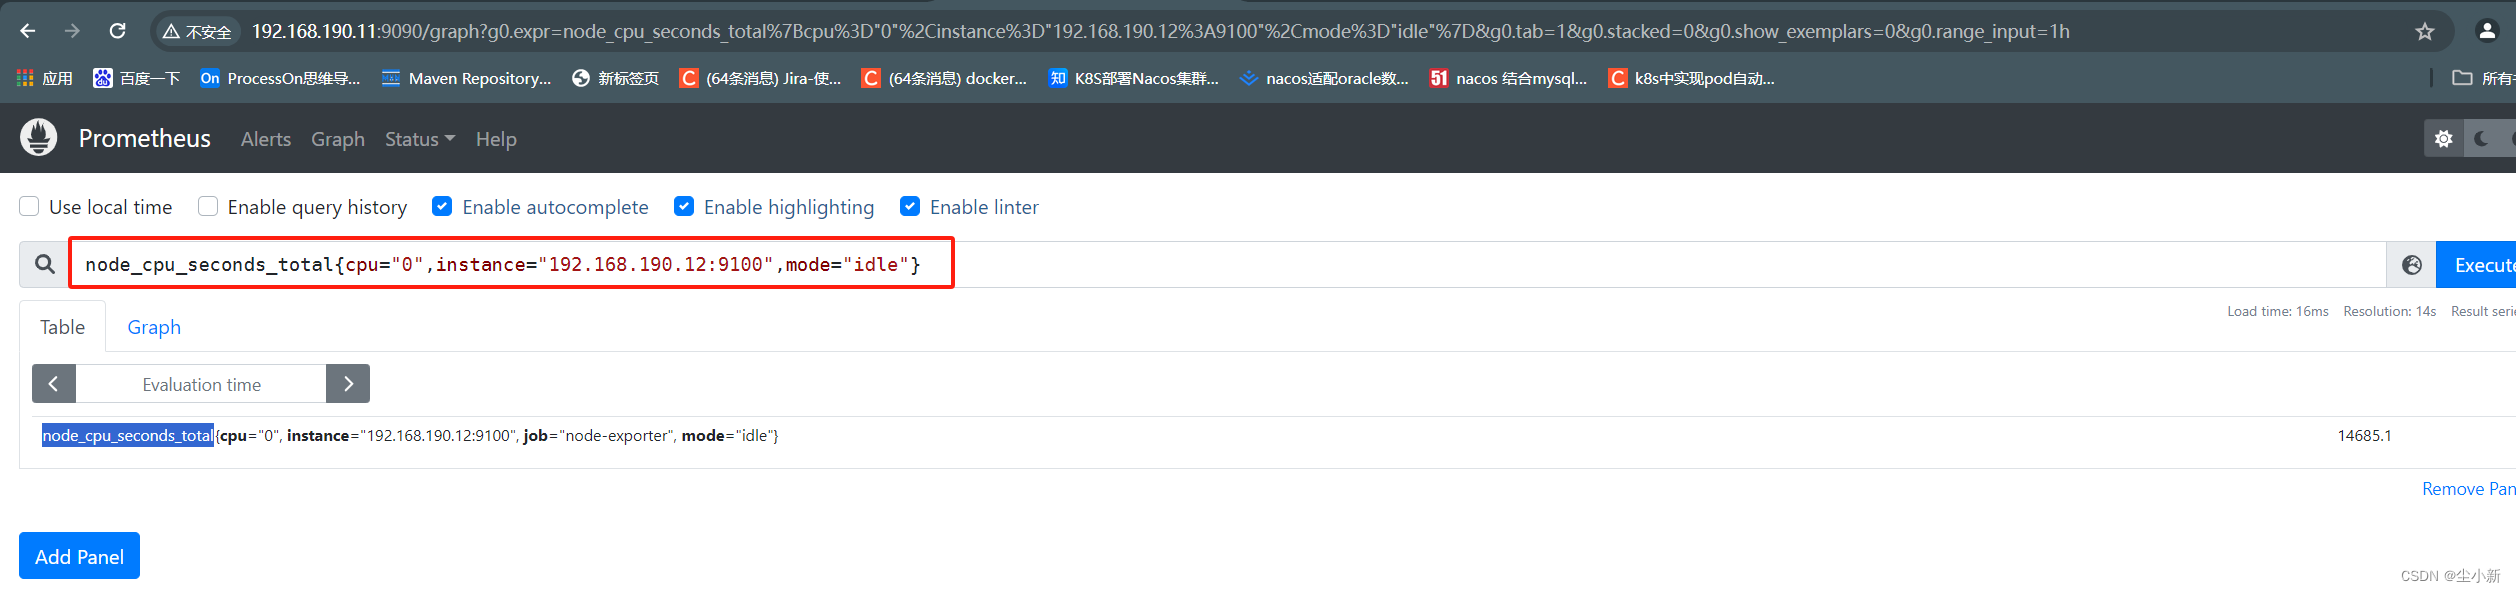
· 查看监控指标【key{value}】
本次学习,我们查cpu作为案例;
只需要写入“关键词”就会弹出与之相关的所有字段key
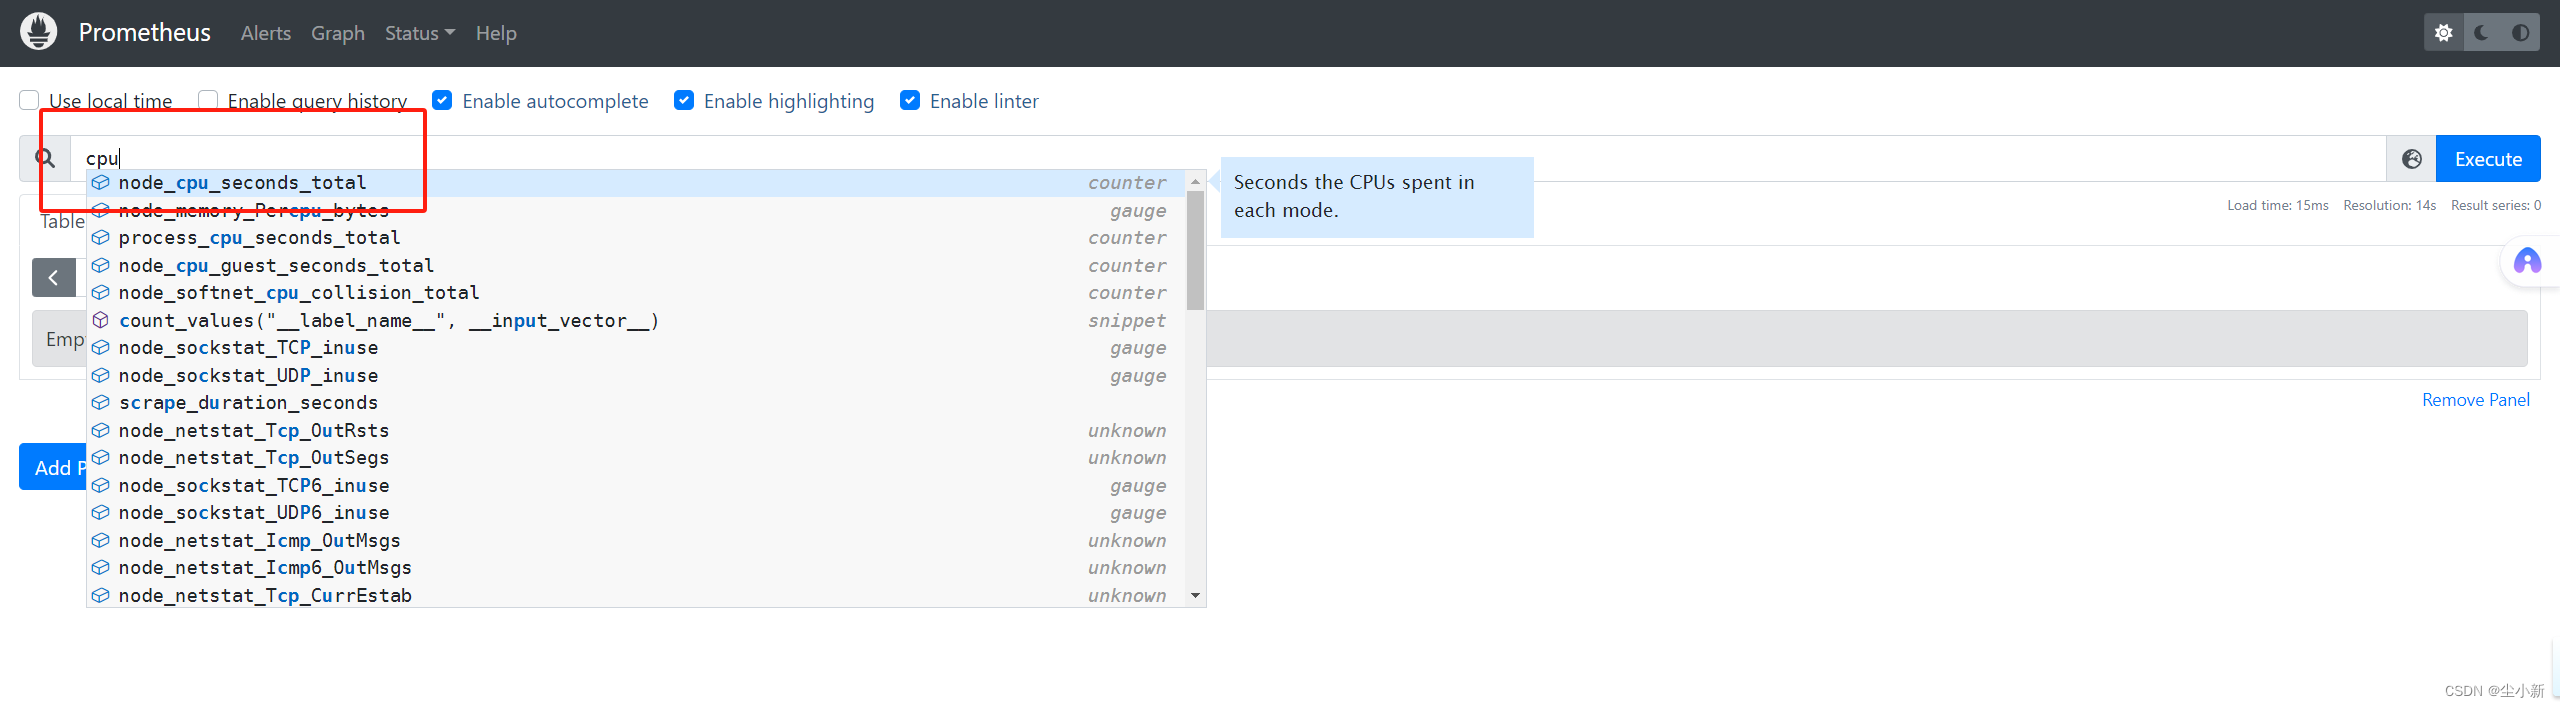
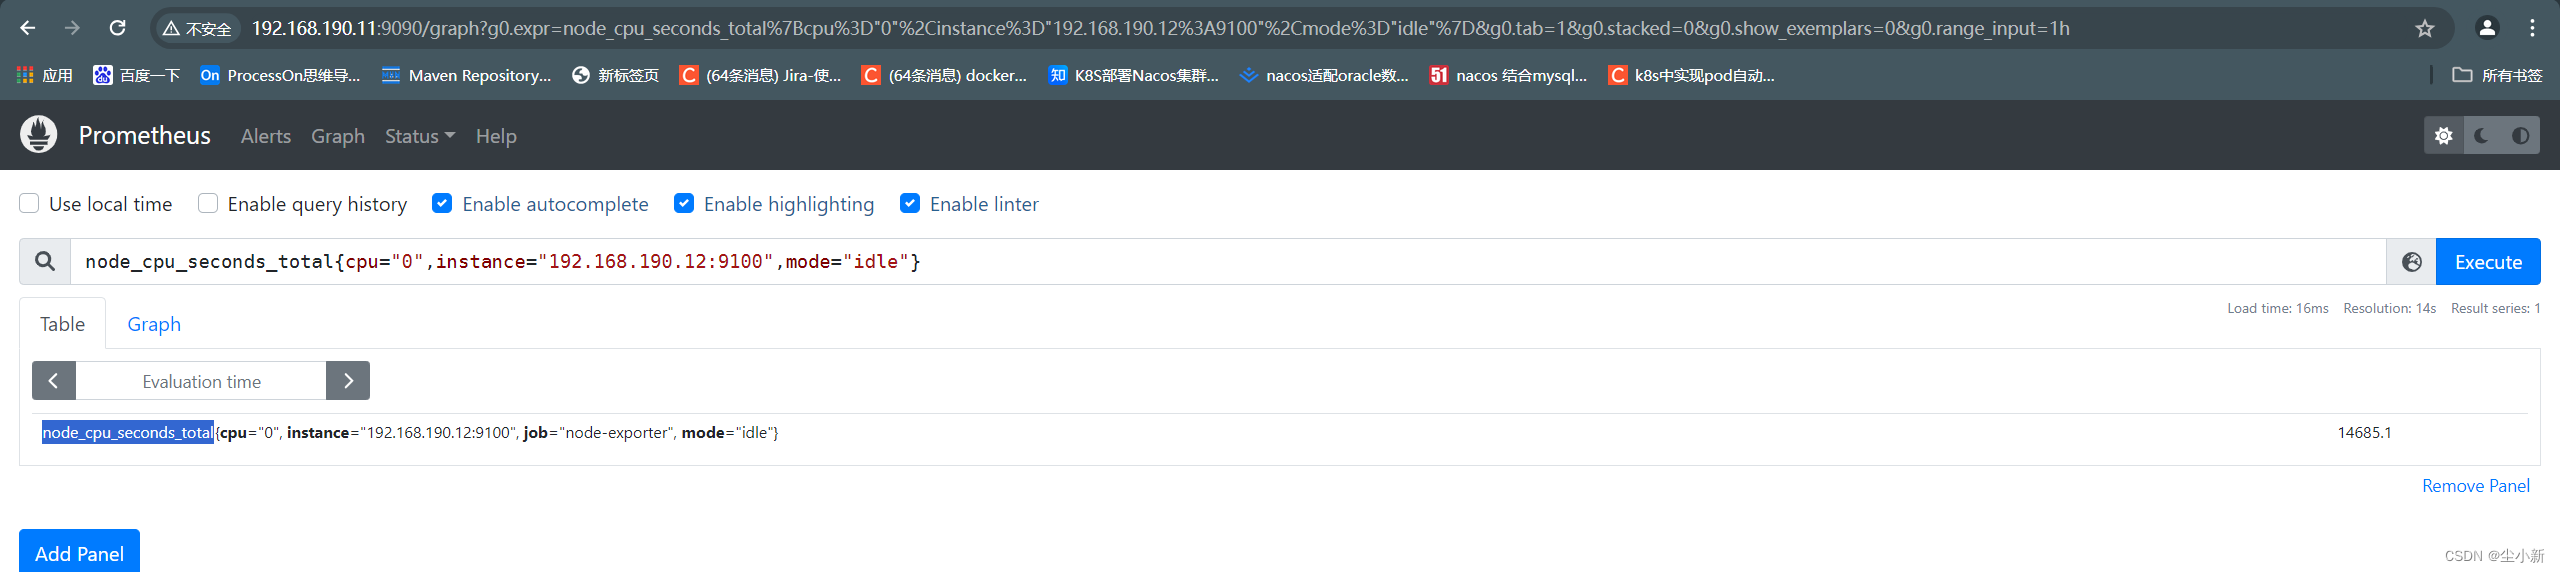
筛选我们想要的cpu数据
key { value,value,value }
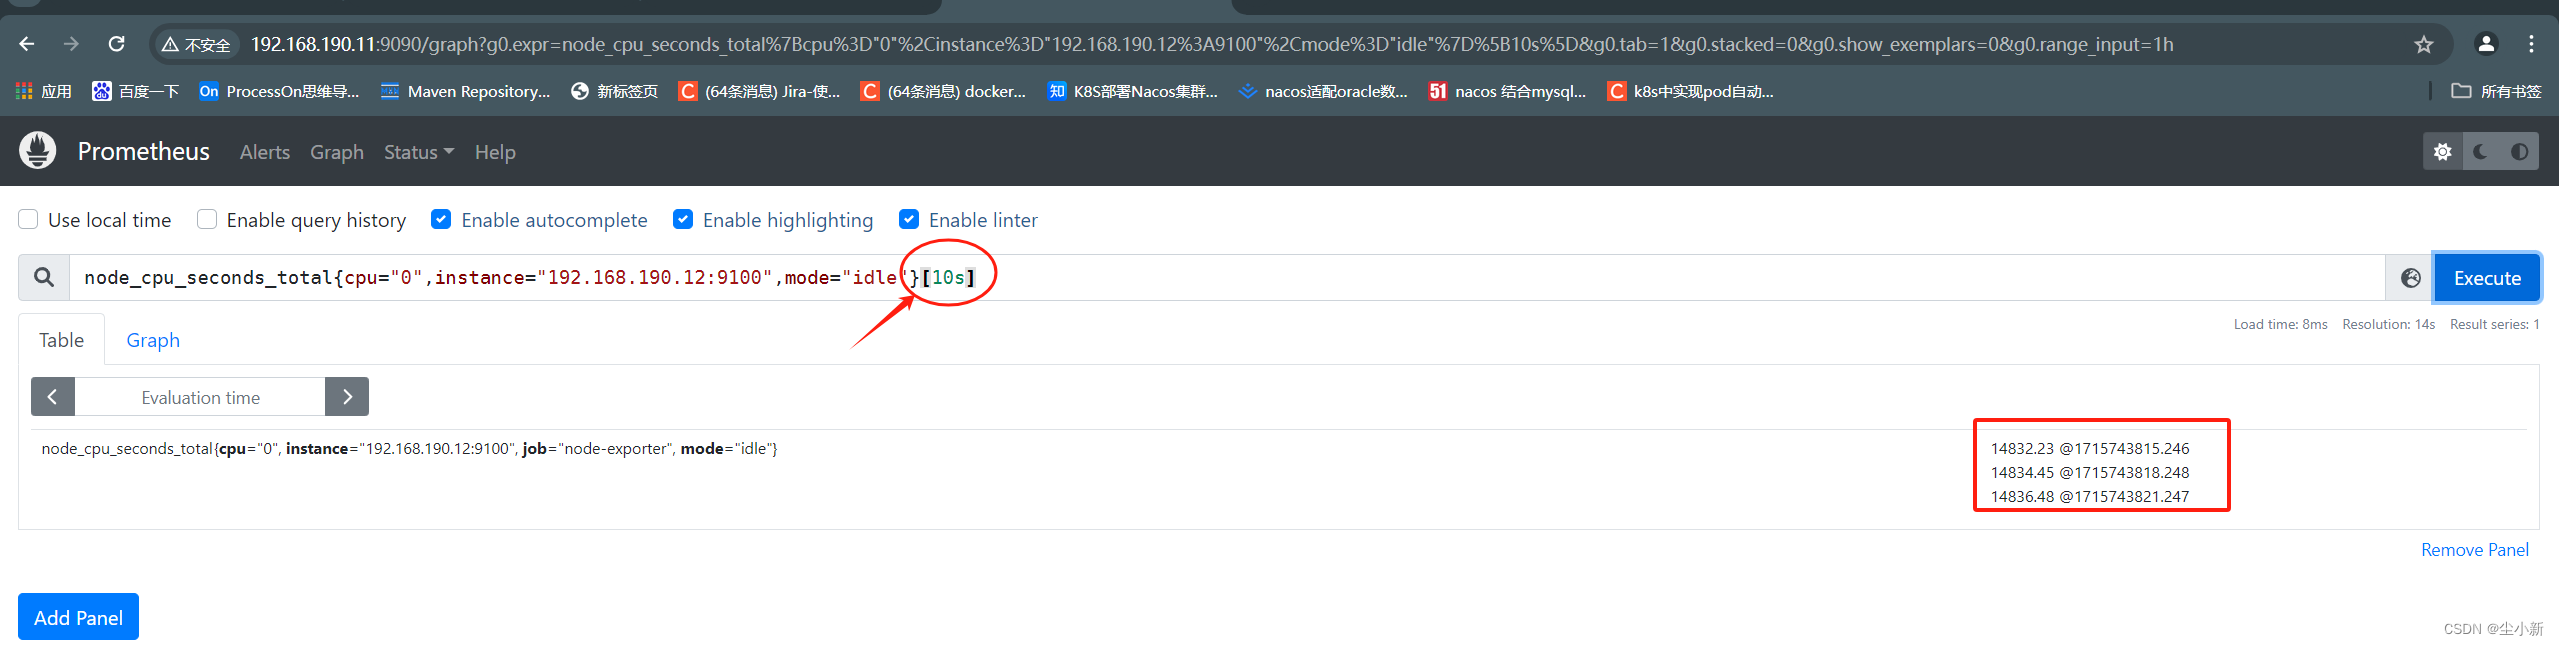
筛选10s内我们想要的cpu相关数据;
key { value,value,value }[10s]
 3,PromeQL的相关函数
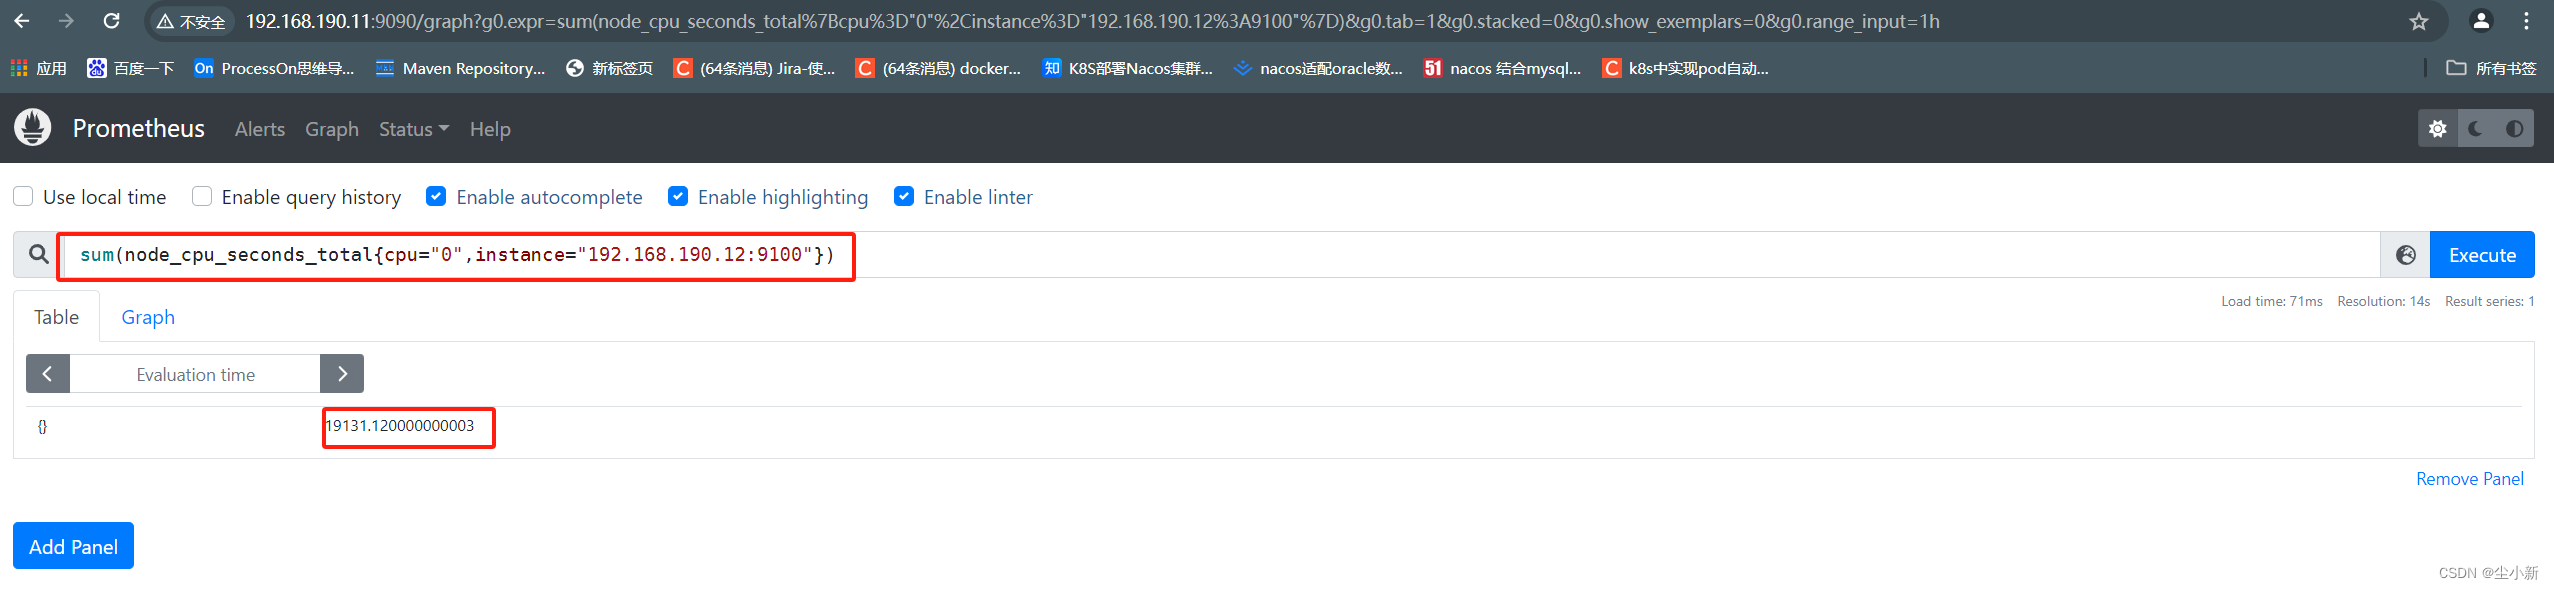
· sum求和
将查询出来的数据,求和计算;
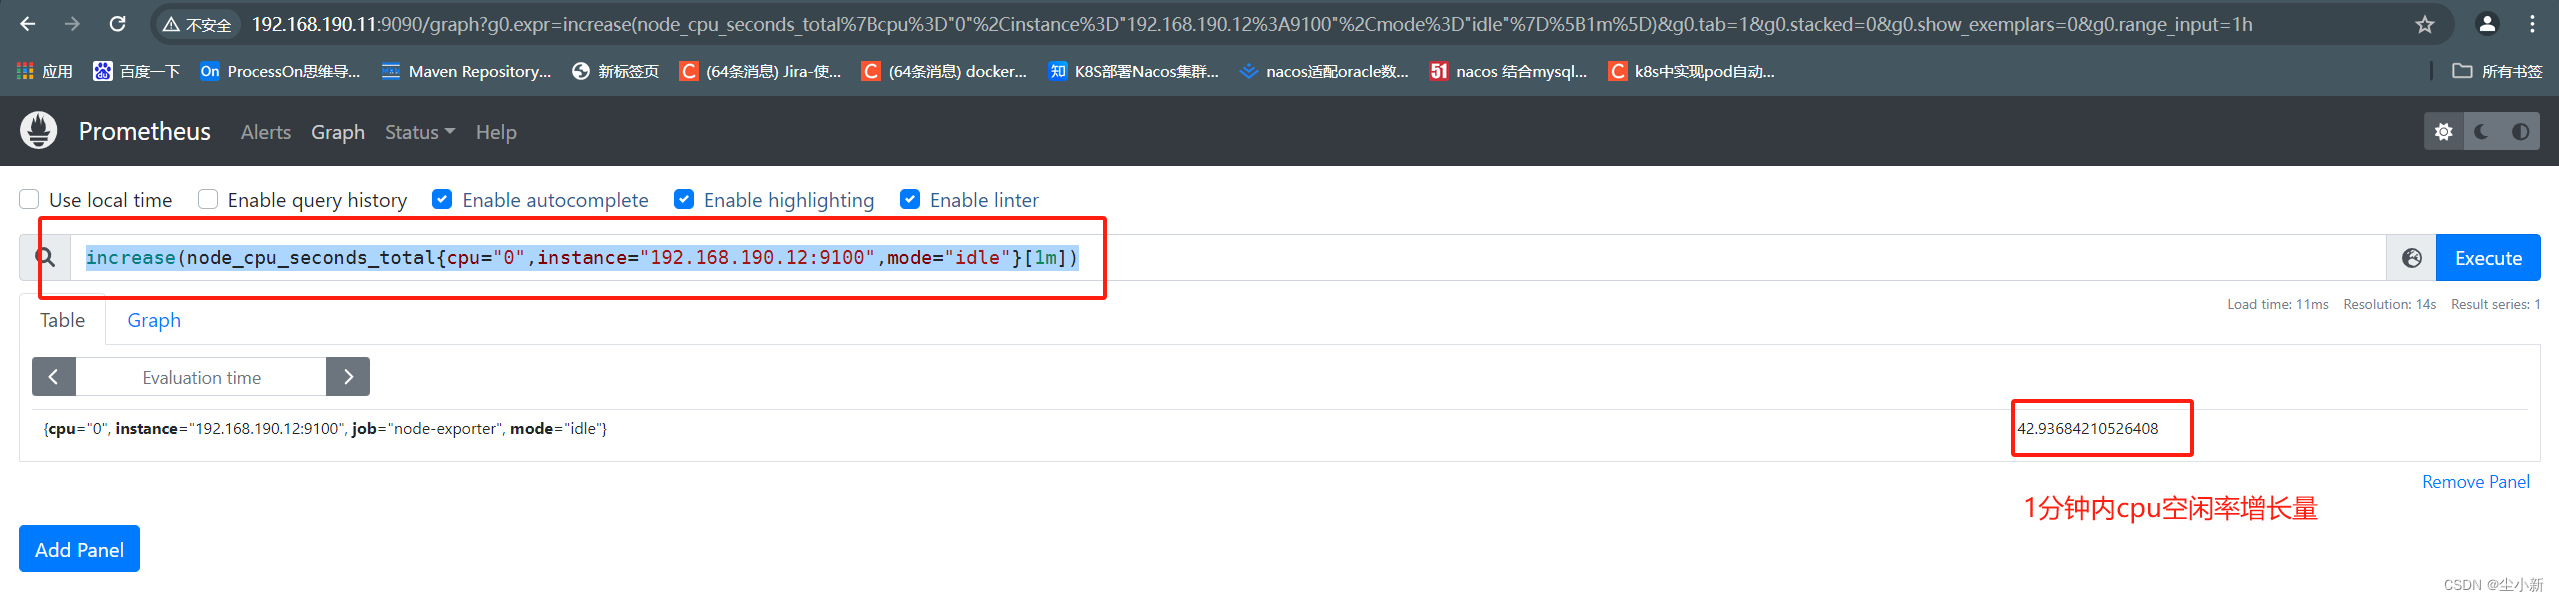
· increase时间段总增长量
查看1分钟内,空闲率增长量
取时间段内的起始第一个值,和最后一个值的差值,就是increase的计算方式。
increase(node_cpu_seconds_total{cpu="0",instance="192.168.190.12:9100",mode="idle"}[1m])
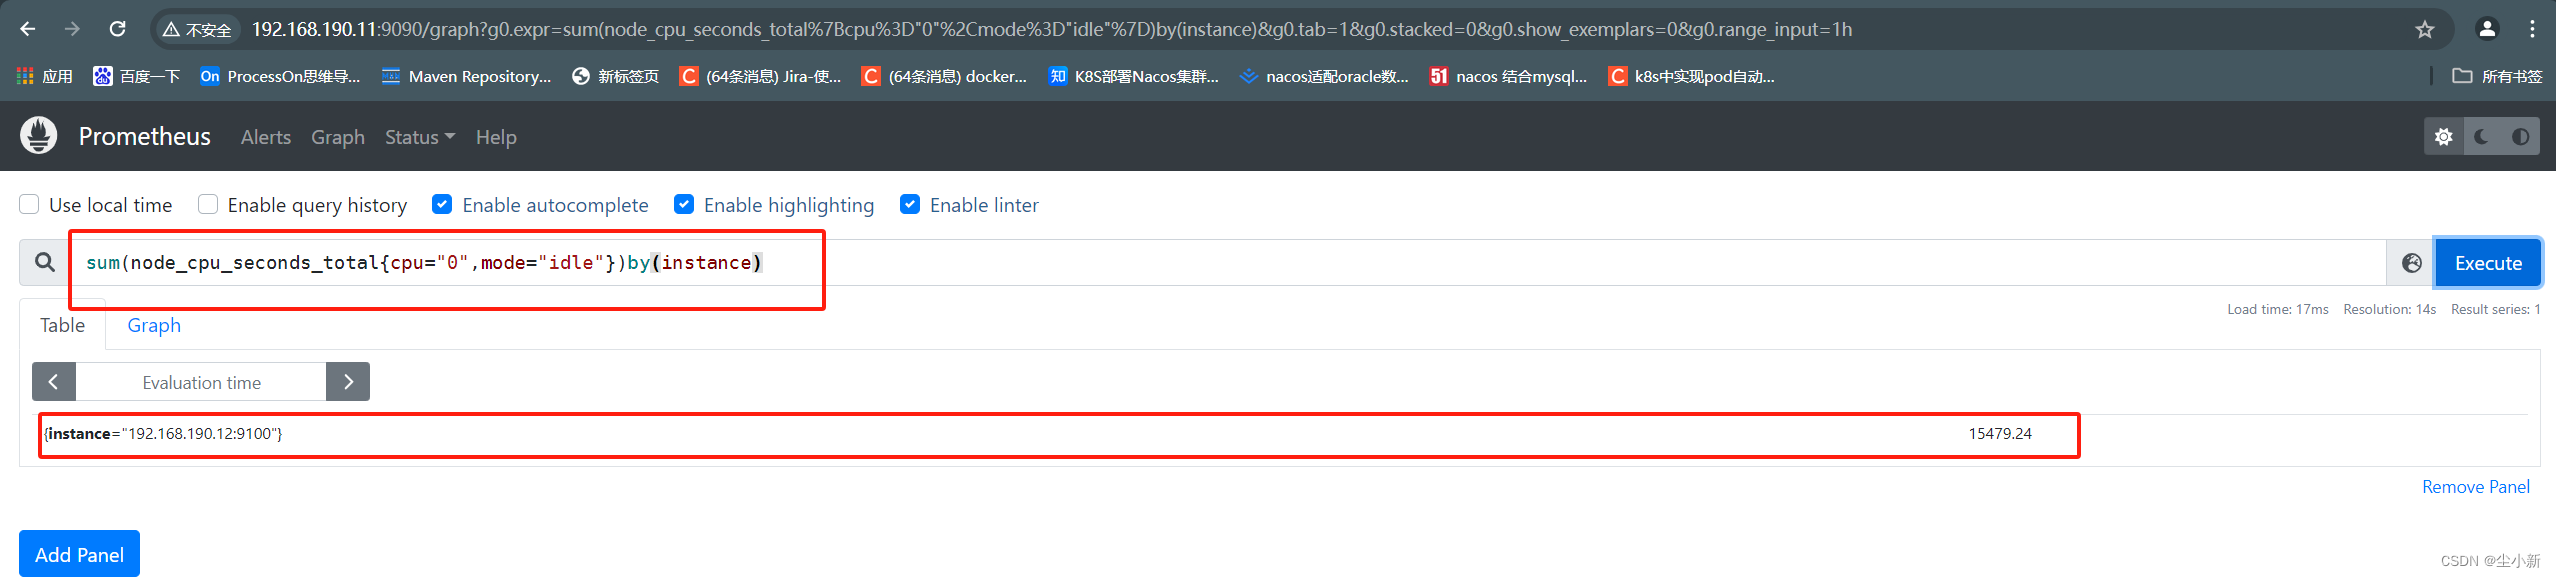
· by函数分组统计
by函数,跟mysql里面的by分组时一个意思,使用起来也几乎一样。
案例:查询所有节点的cpu空闲率,安装监控节点分组;
sum(node_cpu_seconds_total{cpu="0",mode="idle"})by(instance)
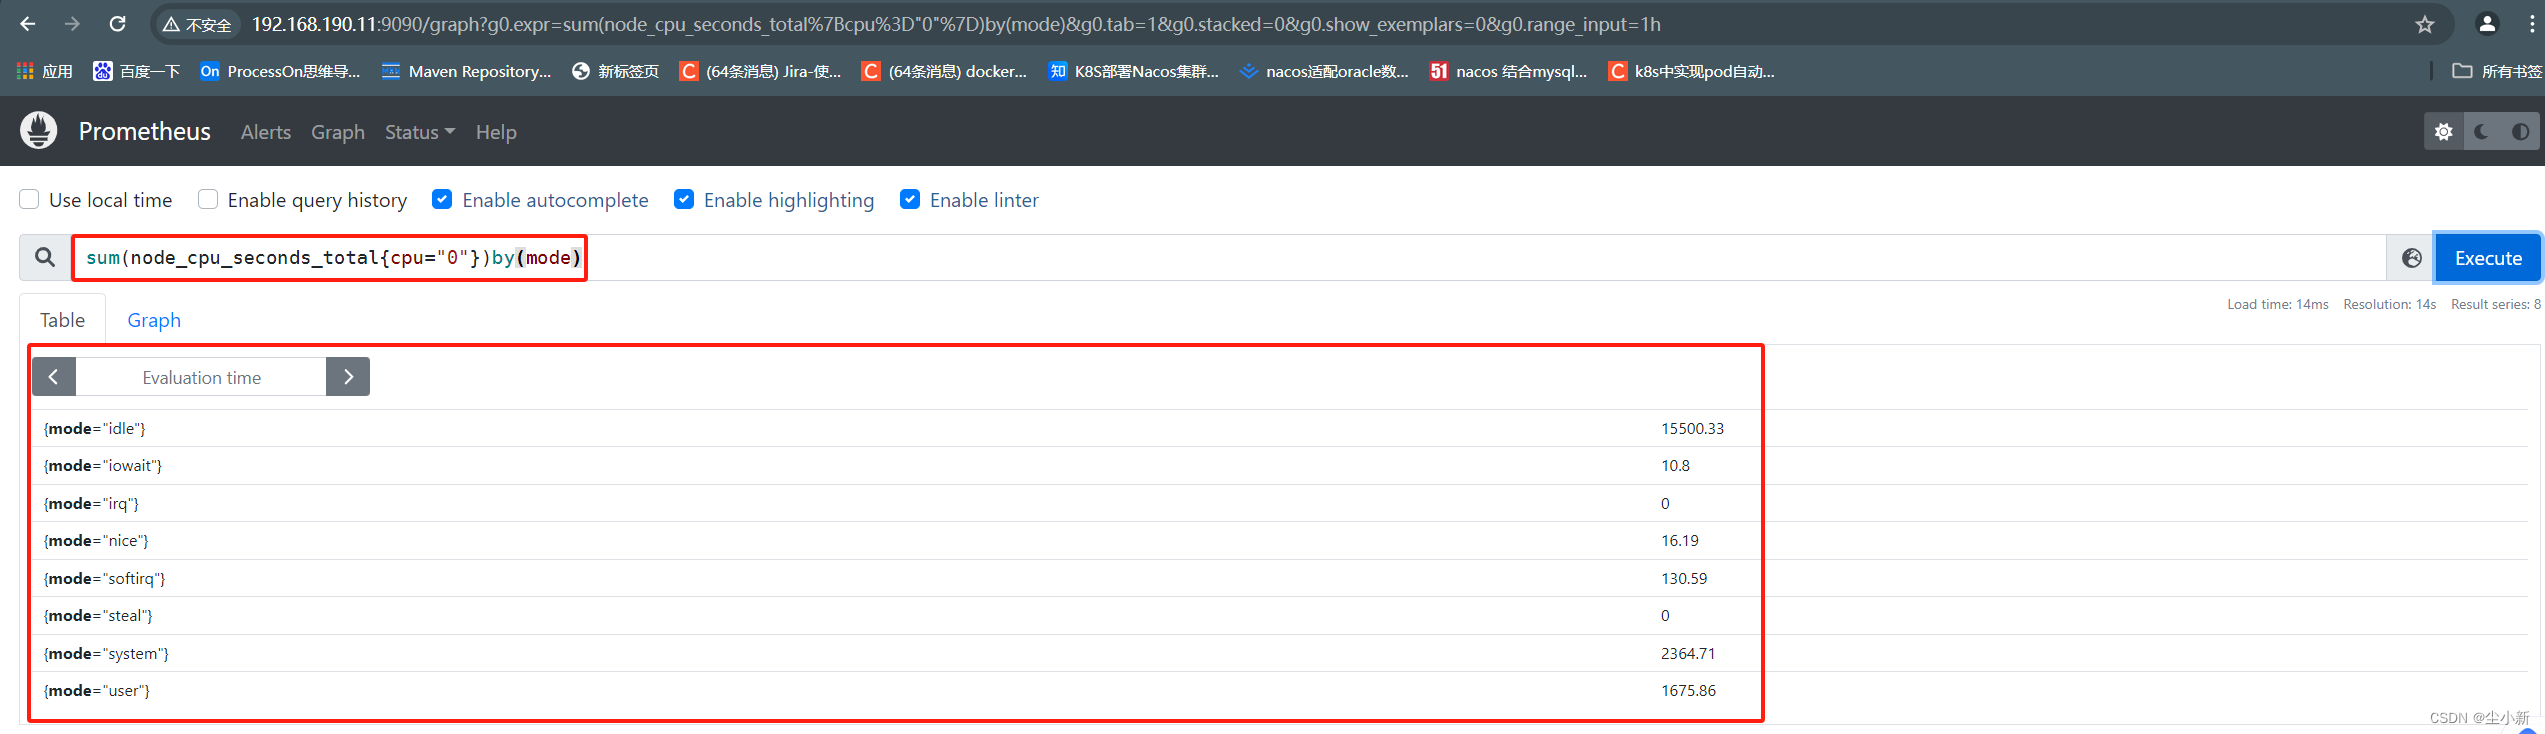
sum(node_cpu_seconds_total{cpu="0"})by(mode)
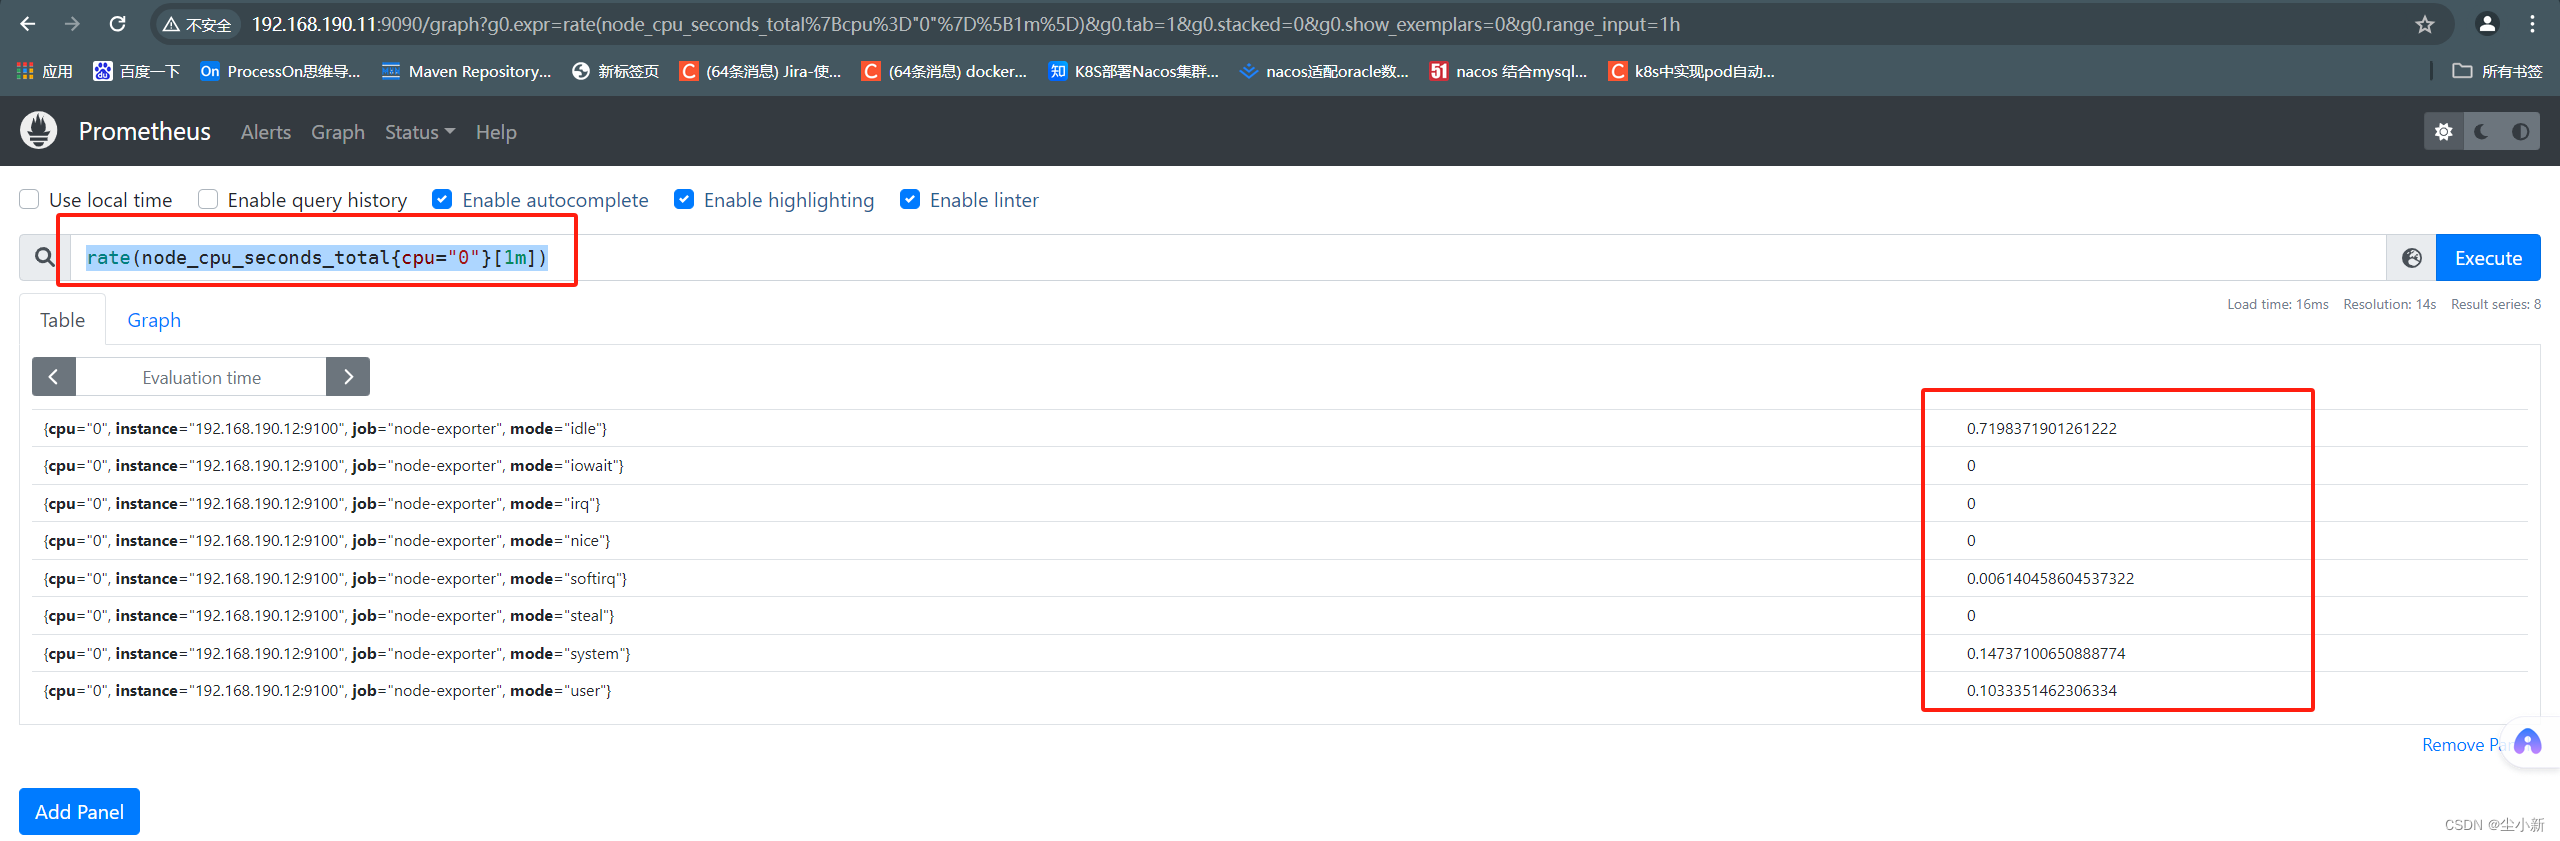
· rate平均增量
案例:查询1分钟之内cpu的空闲值,增长量,按照每秒增长多少,求出这个值。
increase就是时间段内:【最后一个值】 - 【第一个值】
rate就是时间段内:(【最后一个值】 - 【第一个值】)/时间段
rate(node_cpu_seconds_total{cpu="0"}[1m])
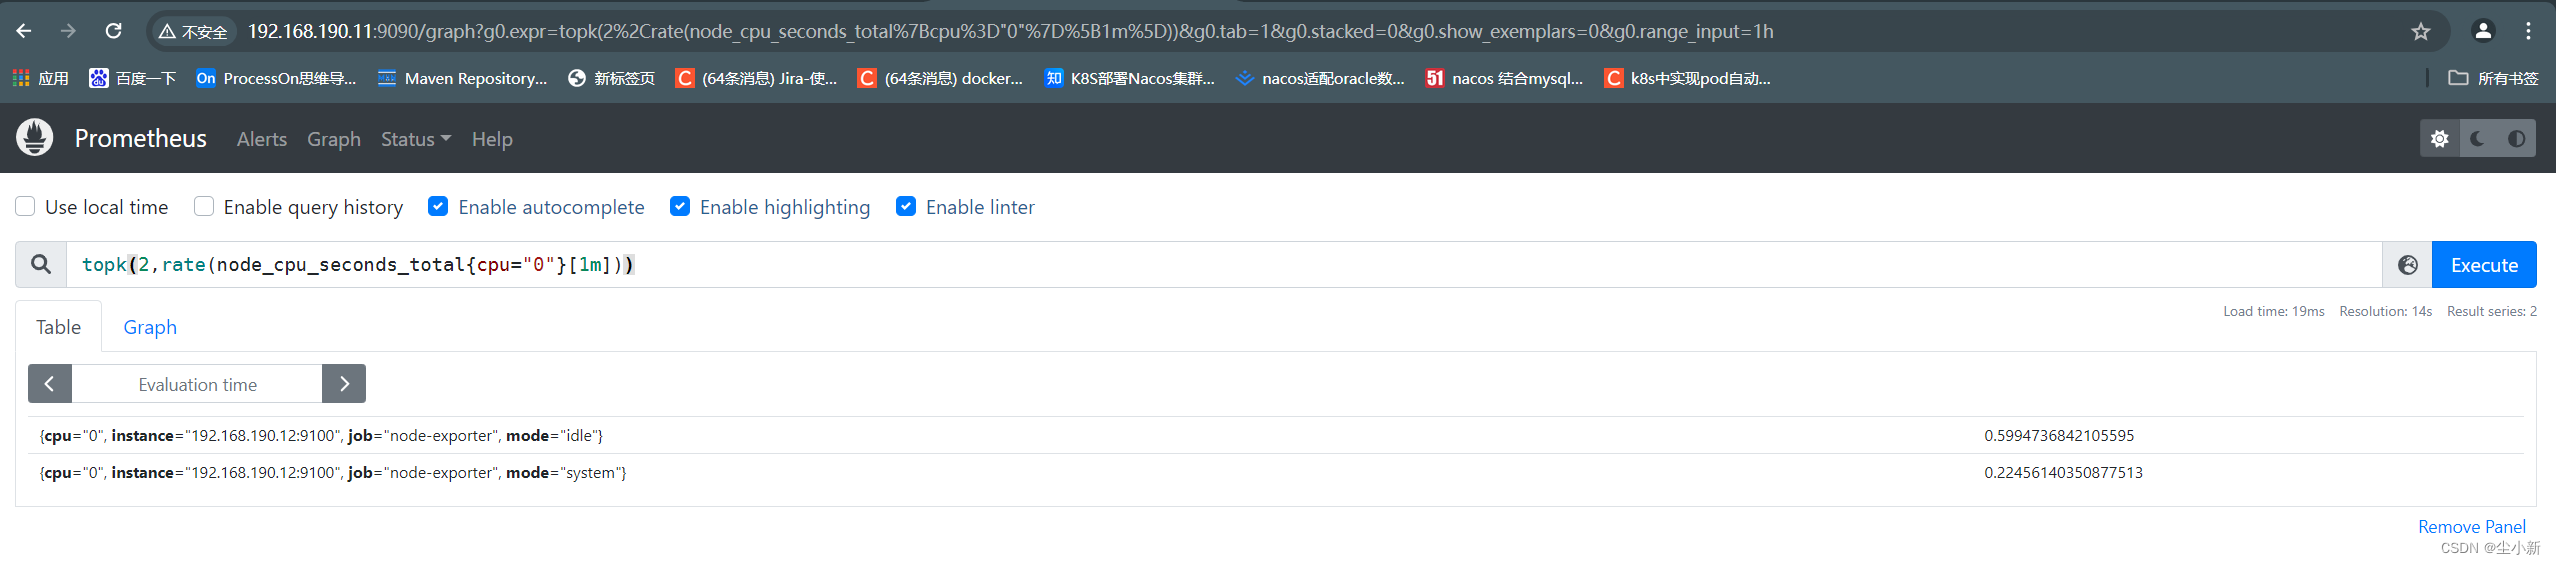
· topk函数
就是把求出来的值的列表,取前几位的意思
由于本次学习,没有安装其他的监控机器,所以演示不完善,大家能明白这个意思就行了;
topk(2,rate(node_cpu_seconds_total{cpu="0"}[1m]))
· count函数-统计计数
案例:查询目前有多少个cpu监控模式(mode)
count(node_cpu_seconds_total{cpu="0"})
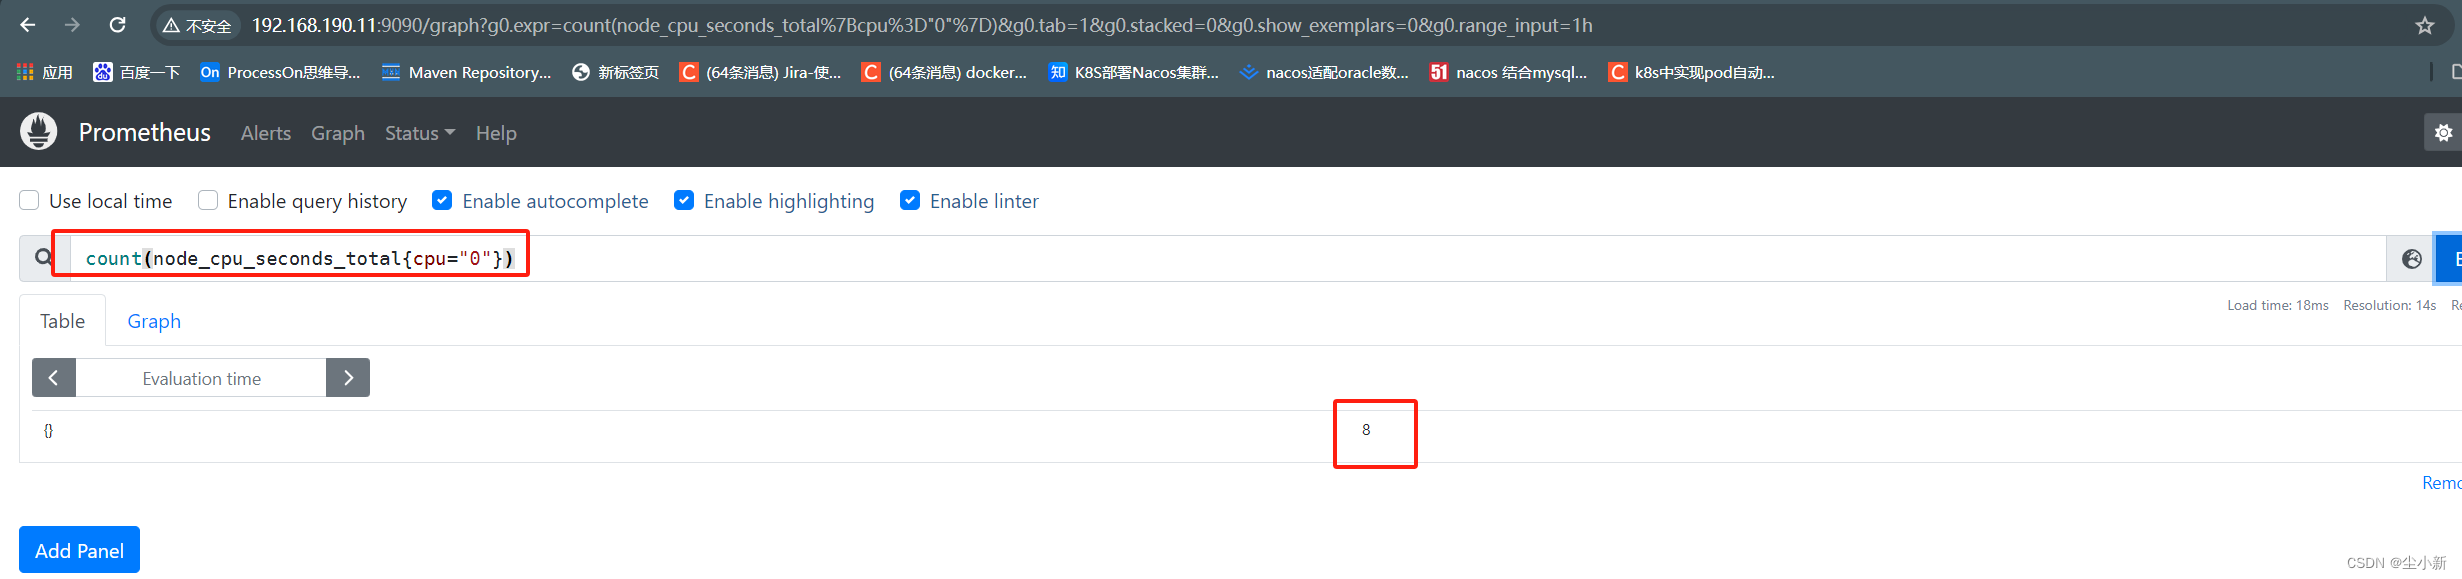
至此,基本函数,大家就有了初步的了解;
4,PromeQL案例
求cpu的空闲率
sum(【cpu总空闲时间】)/sum(【cpu所有使用时间】)
sum(node_cpu_seconds_total{mode="idle"})/sum(node_cpu_seconds_total)
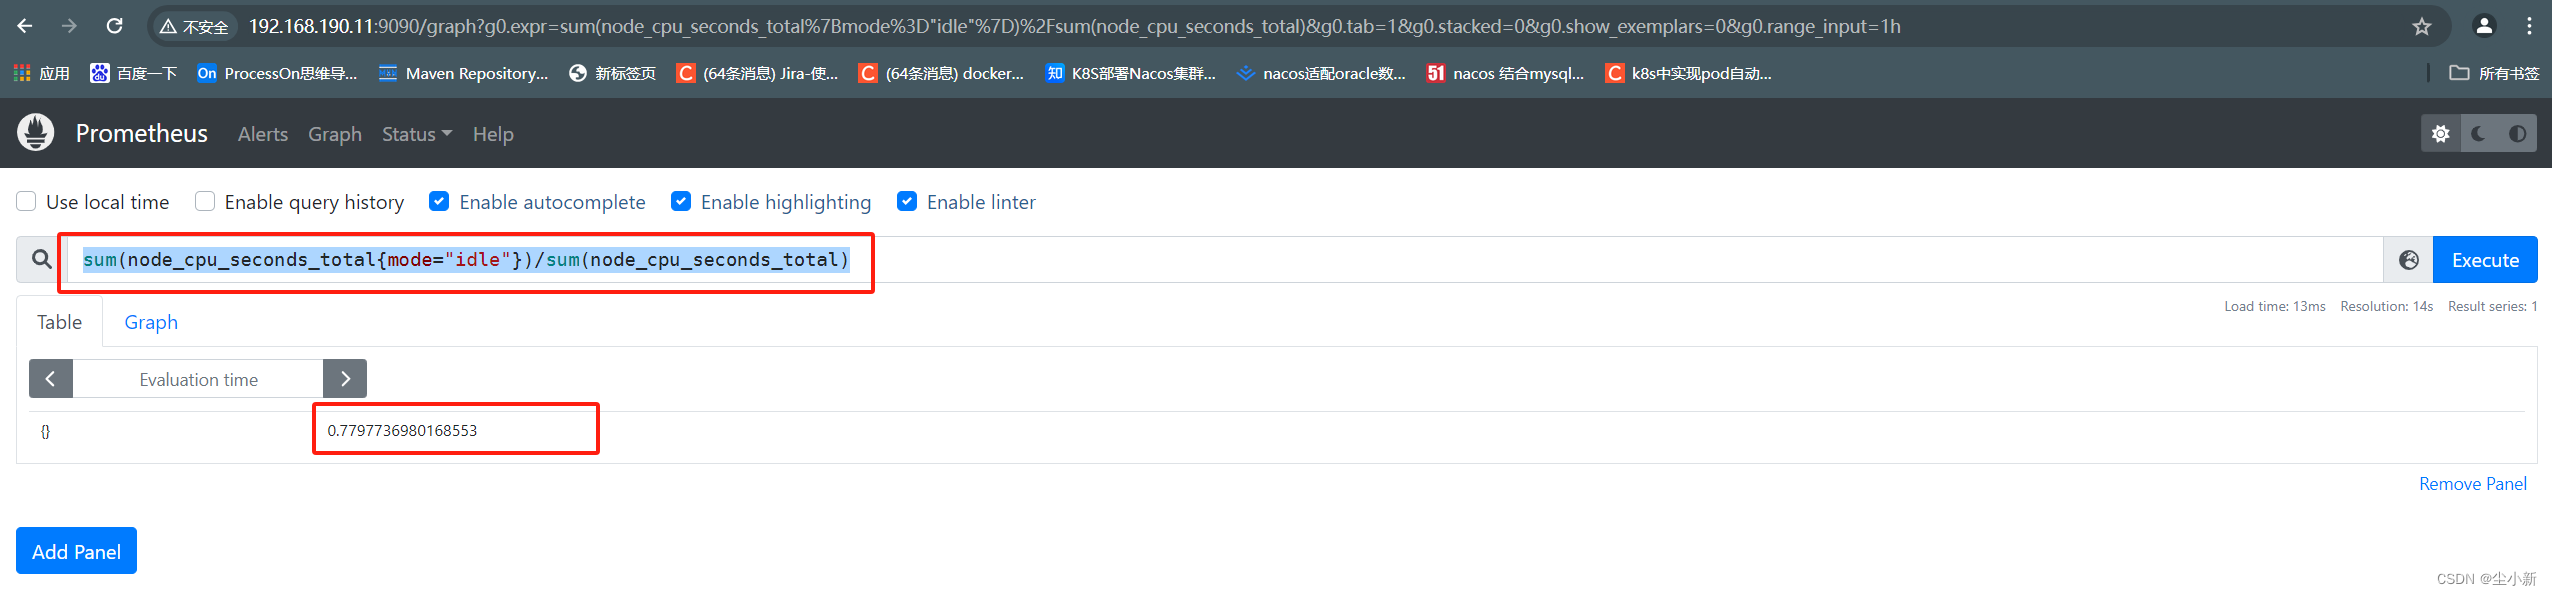
至此,PromeQL的简单了解,就到这了,比较墨迹了,接下来我们先进入下一步学习,在从头回顾一下我们这个PromeQL的不懂的技术点。
五、grafana出图展示数据
1,机器准备
192.168.190.13-prometheus3 1c1g 20GB
2,安装grafana
本次学习,给大家准备了安装包在百度云盘
链接:https://pan.baidu.com/s/1sMJrz1afPqmaW_dypUXQmA?pwd=sotw
提取码:sotw
· 上传软件包
[root@prometheus3 ~]# mkdir /soft
[root@prometheus3 ~]# cd /soft/
[root@prometheus3 soft]# ll
总用量 85616
-rw-r--r--. 1 root root 87670697 5月 15 12:55 grafana-enterprise-10.0.3-1.x86_64.rpm
· 安装grafana
[root@prometheus3 soft]# yum -y localinstall grafana-enterprise-10.0.3-1.x86_64.rpm
· 启动grafana
[root@prometheus3 soft]# systemctl enable --now grafana-server.service
· 检查3000端口是否监听
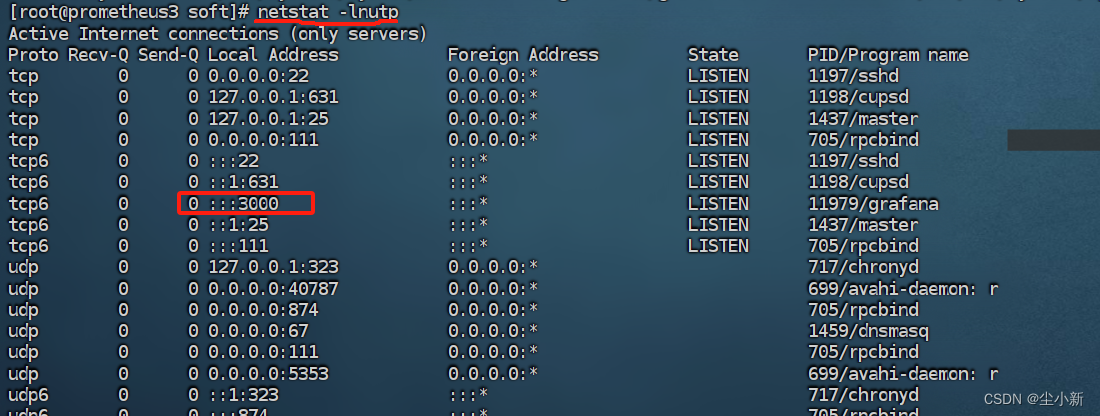
3,浏览器访问grfana
http://192.168.190.13:3000/ 账号密码:admin/admin

· 配置数据源
就是获取prometheus的数据
【home】-【adminstration】-【data sources】-【add data-sources】-【prometheus】
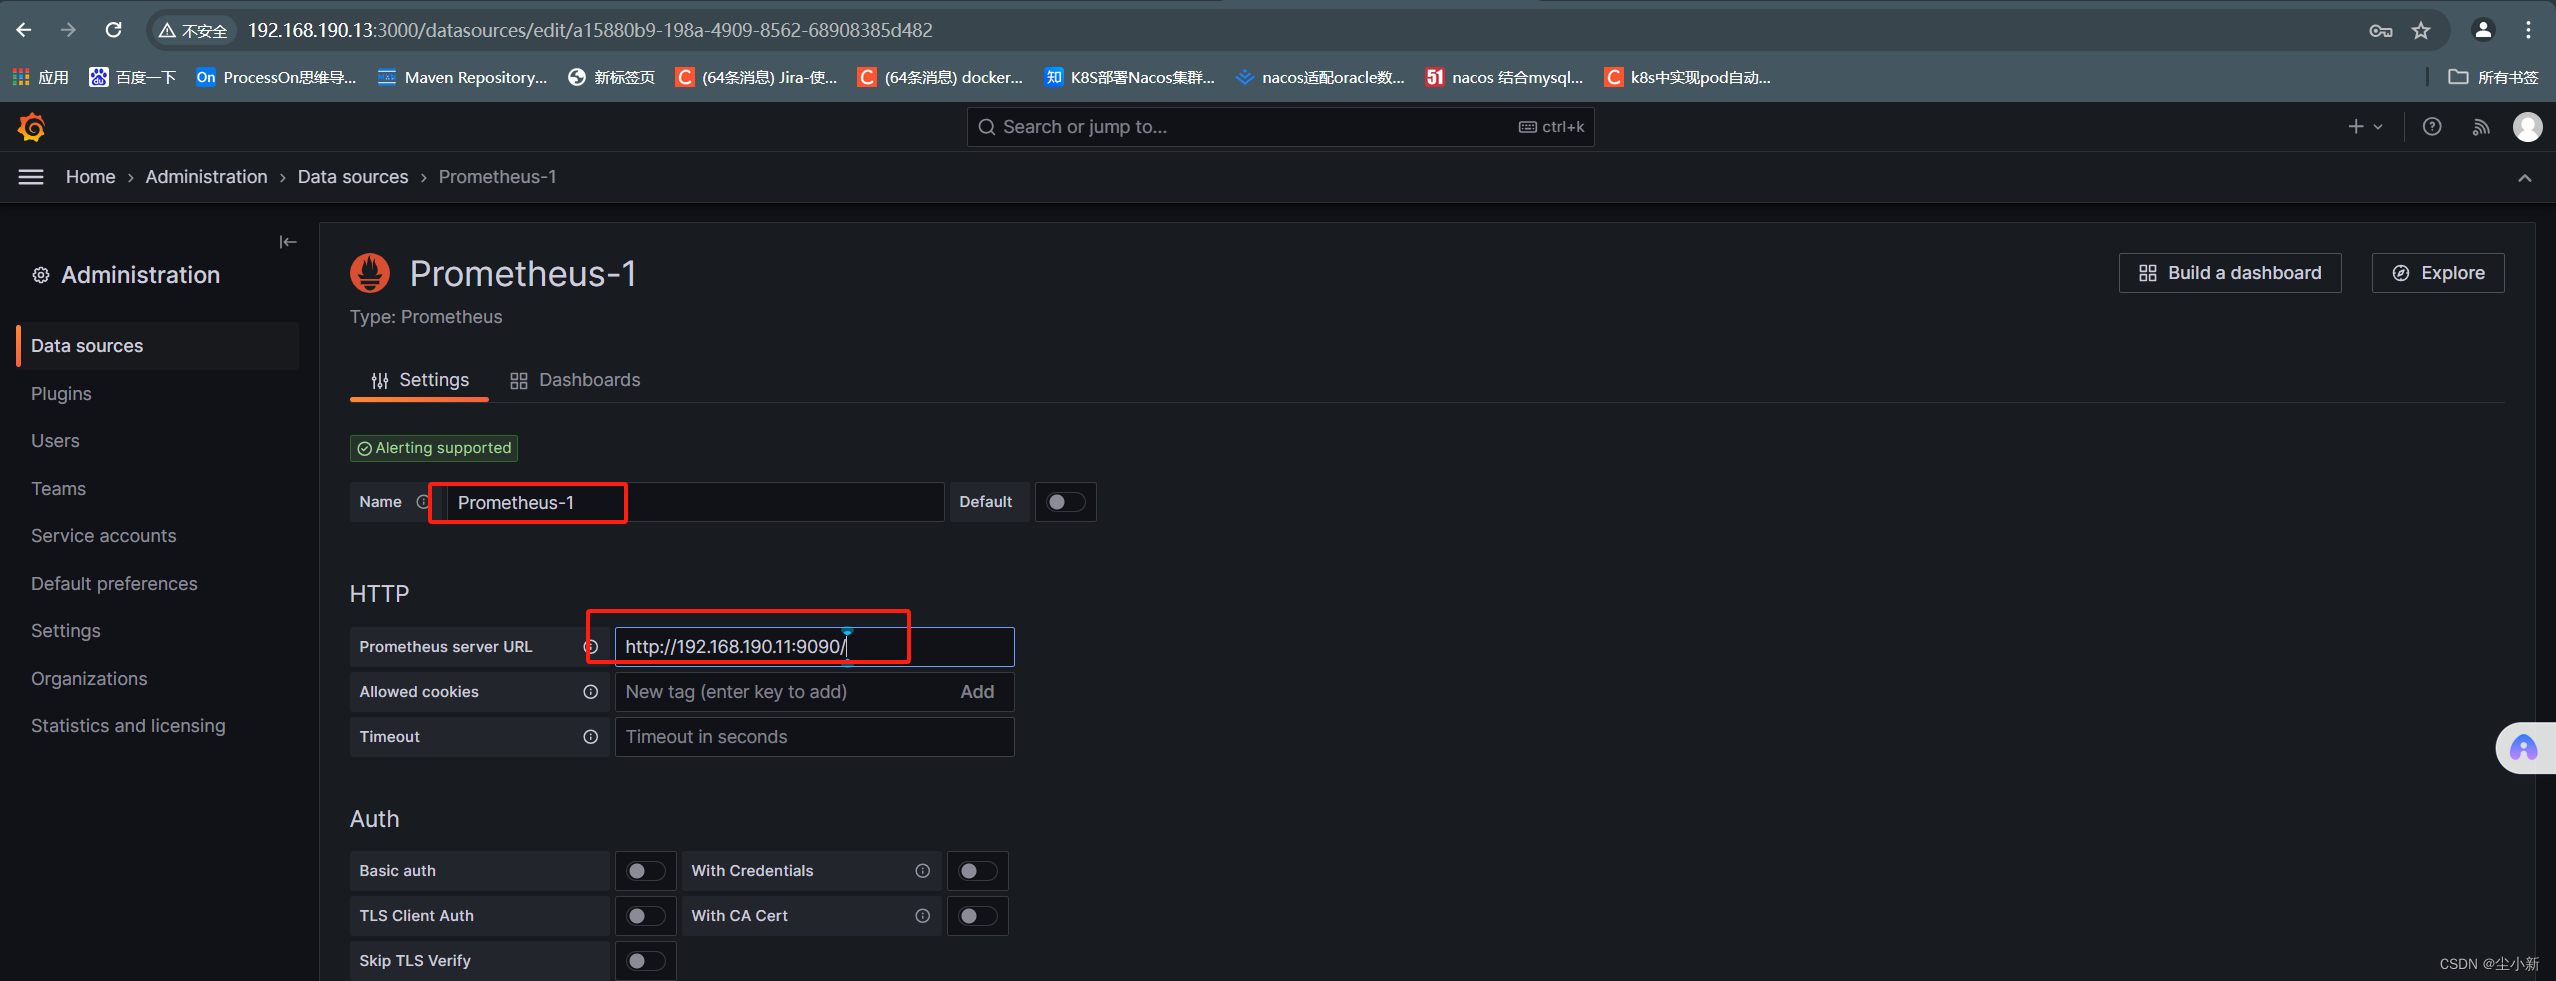 点击save&test
 至此,数据源配置完毕;
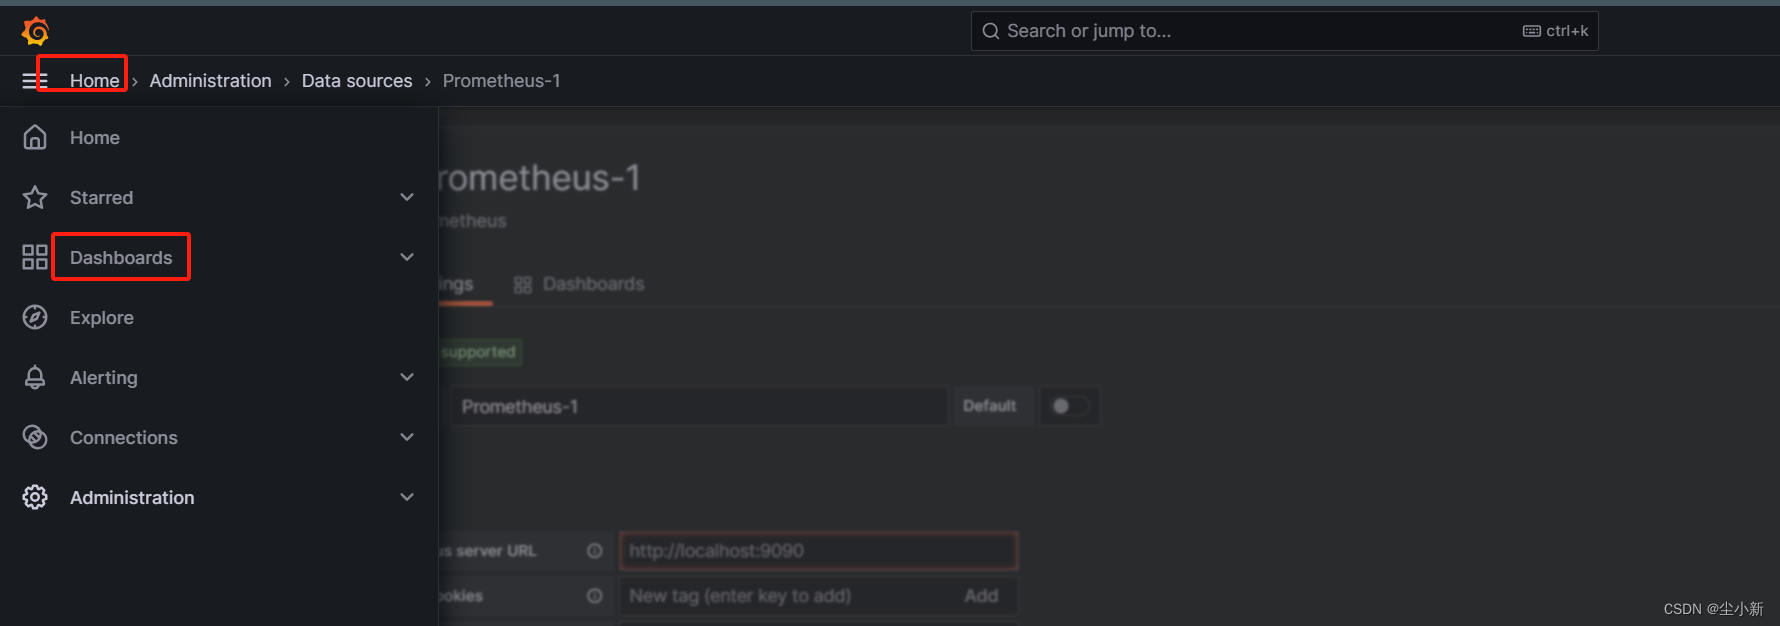
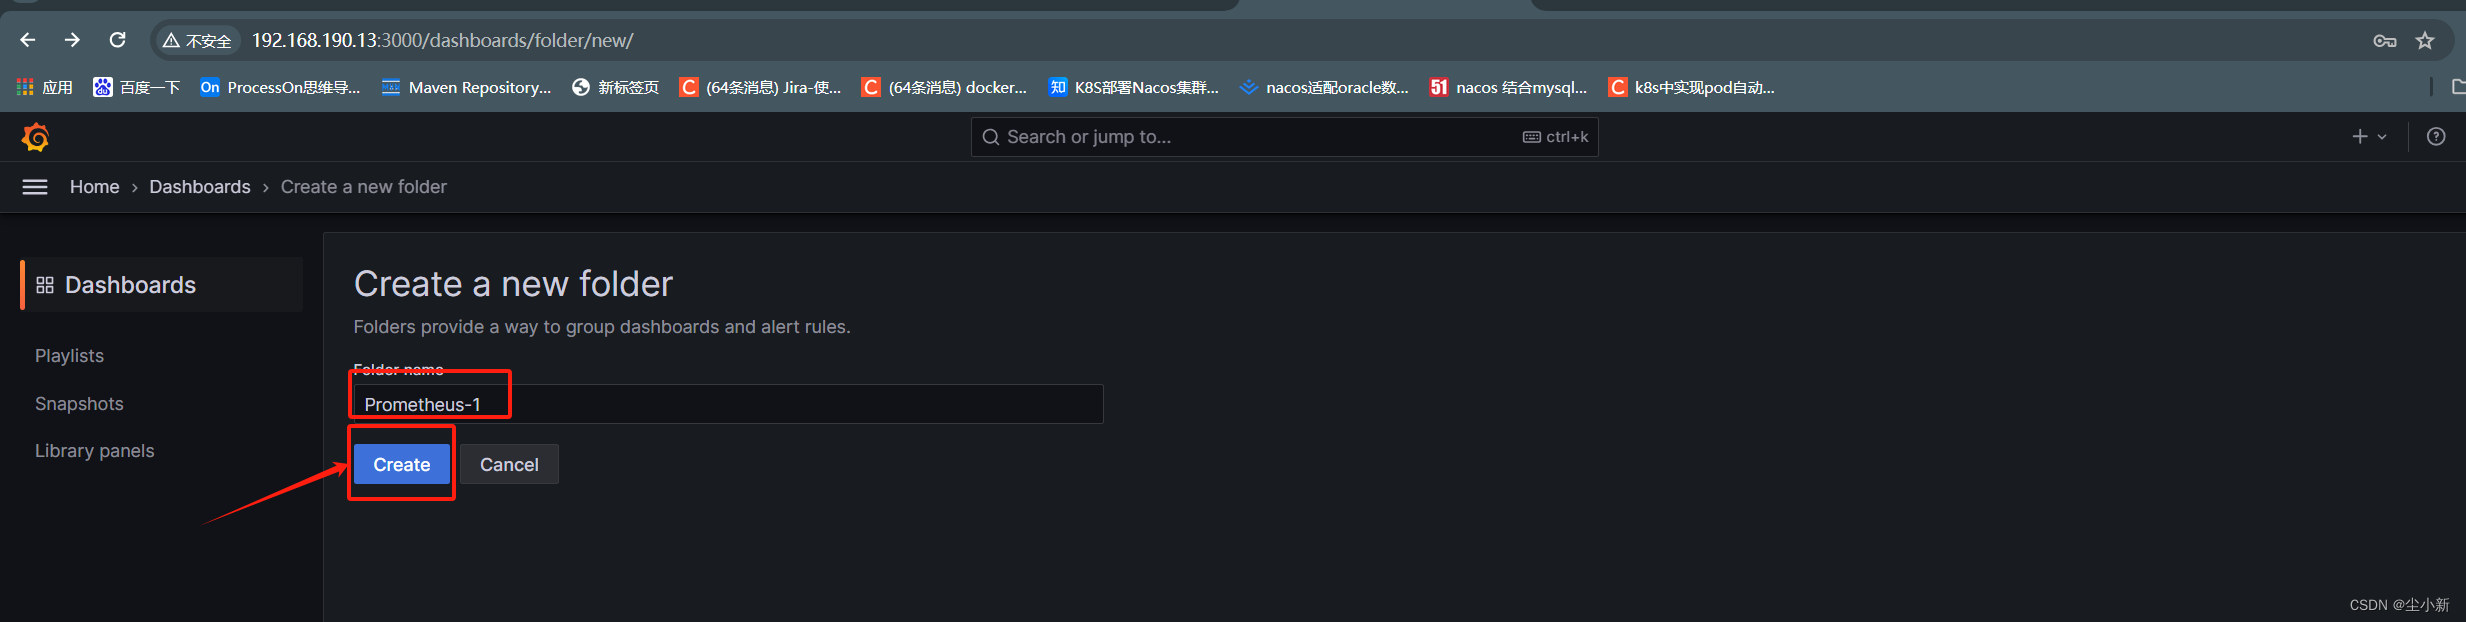
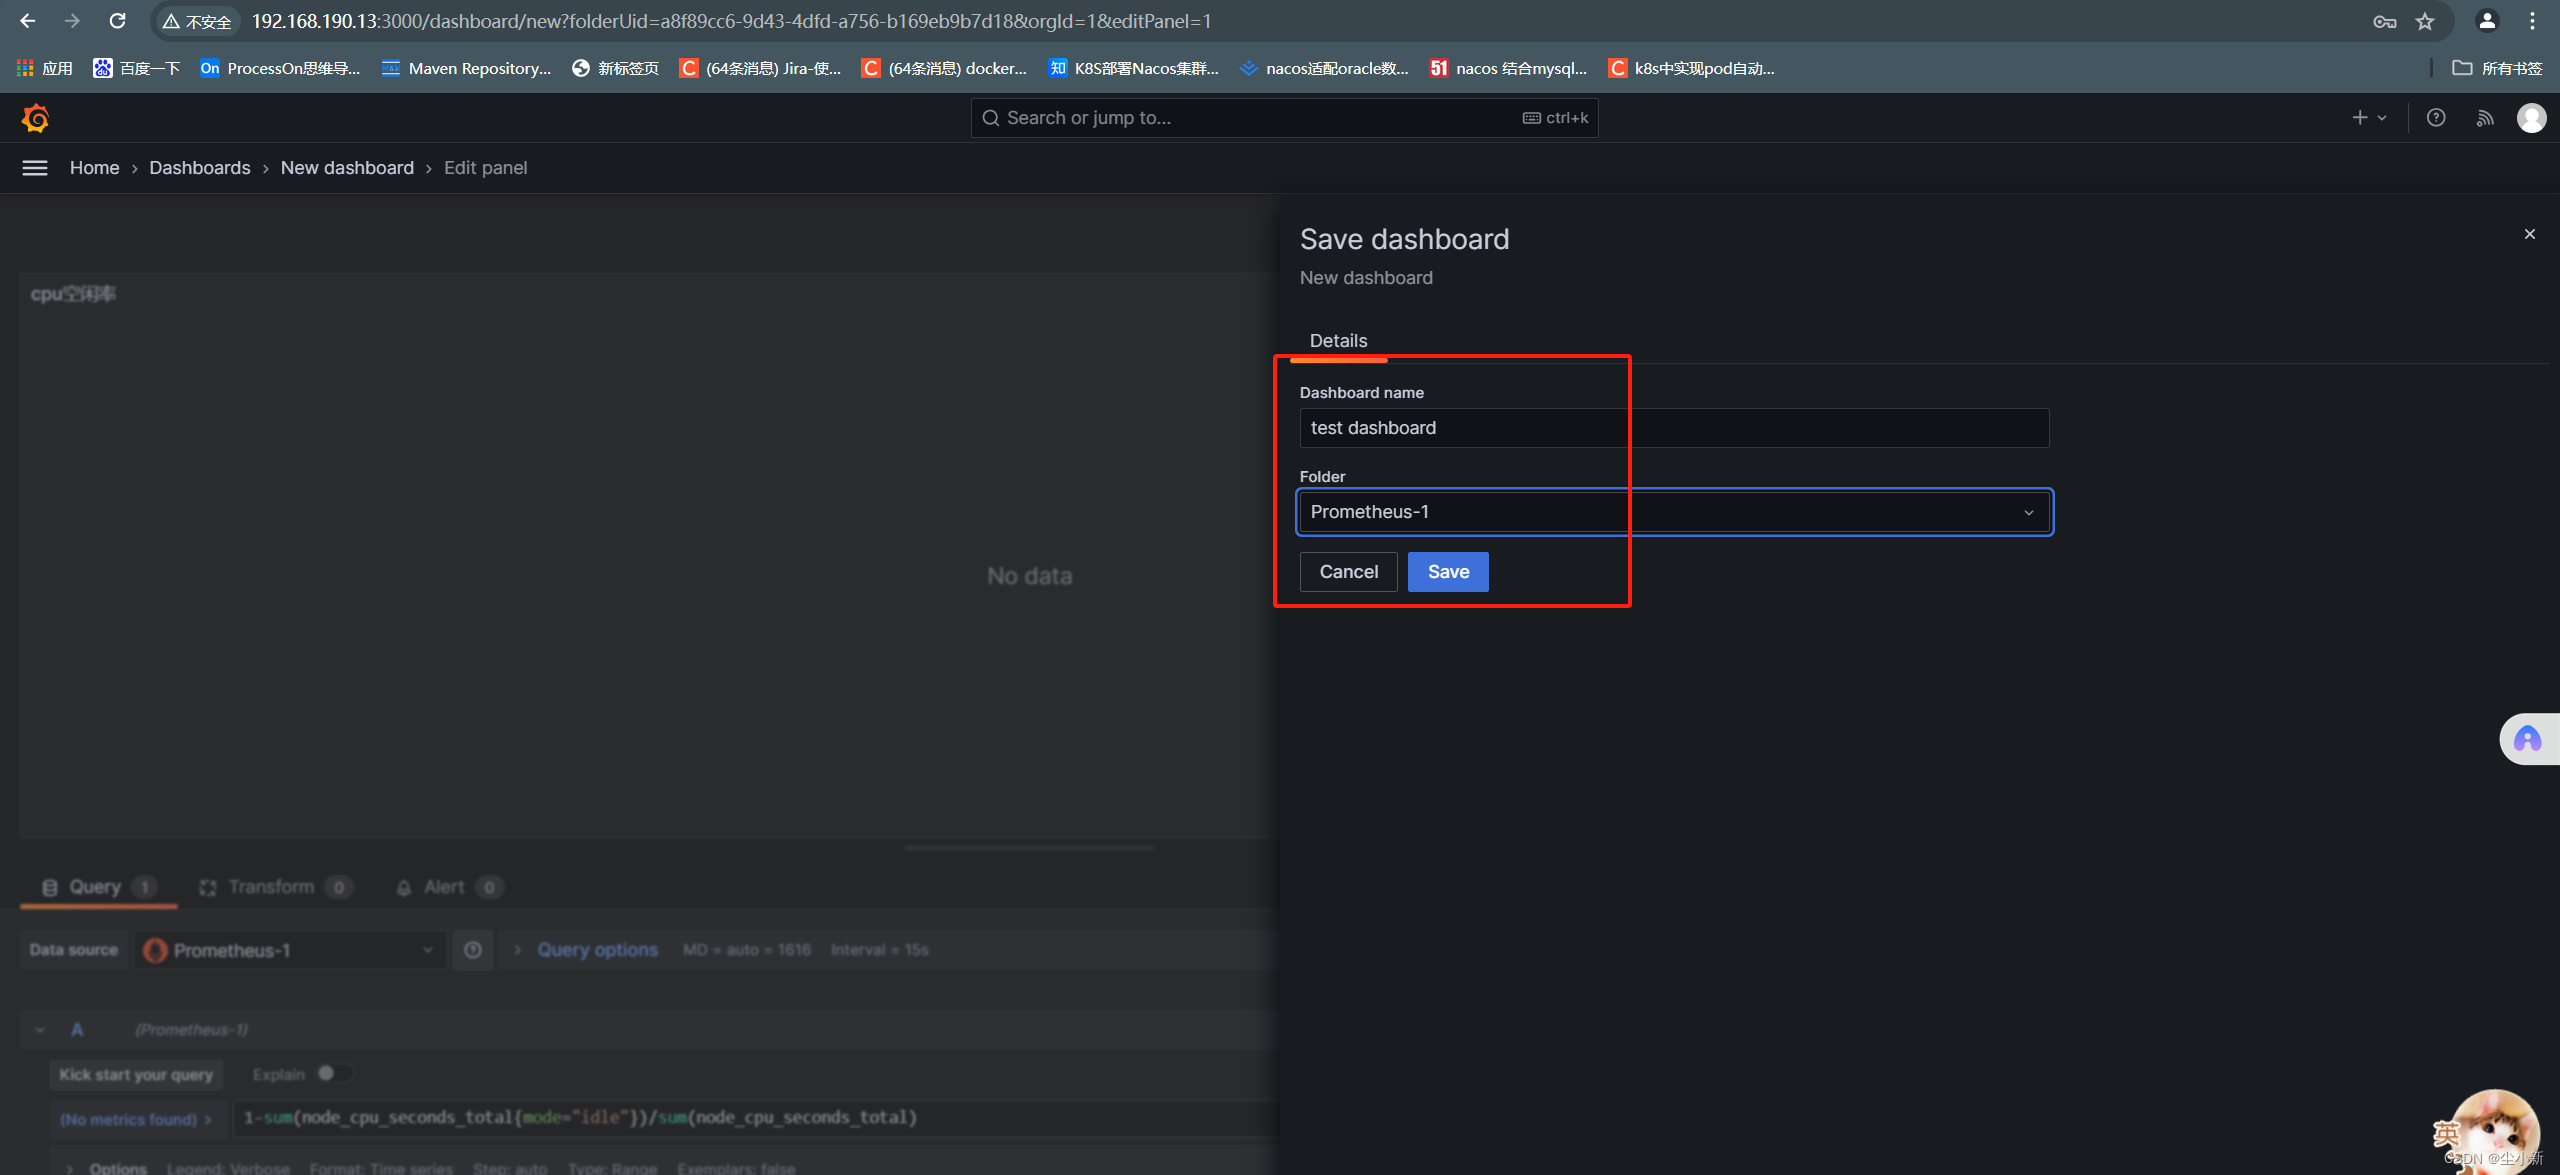
· 新建仪表盘
【home】-【dashboards】-【new】-【new folder】
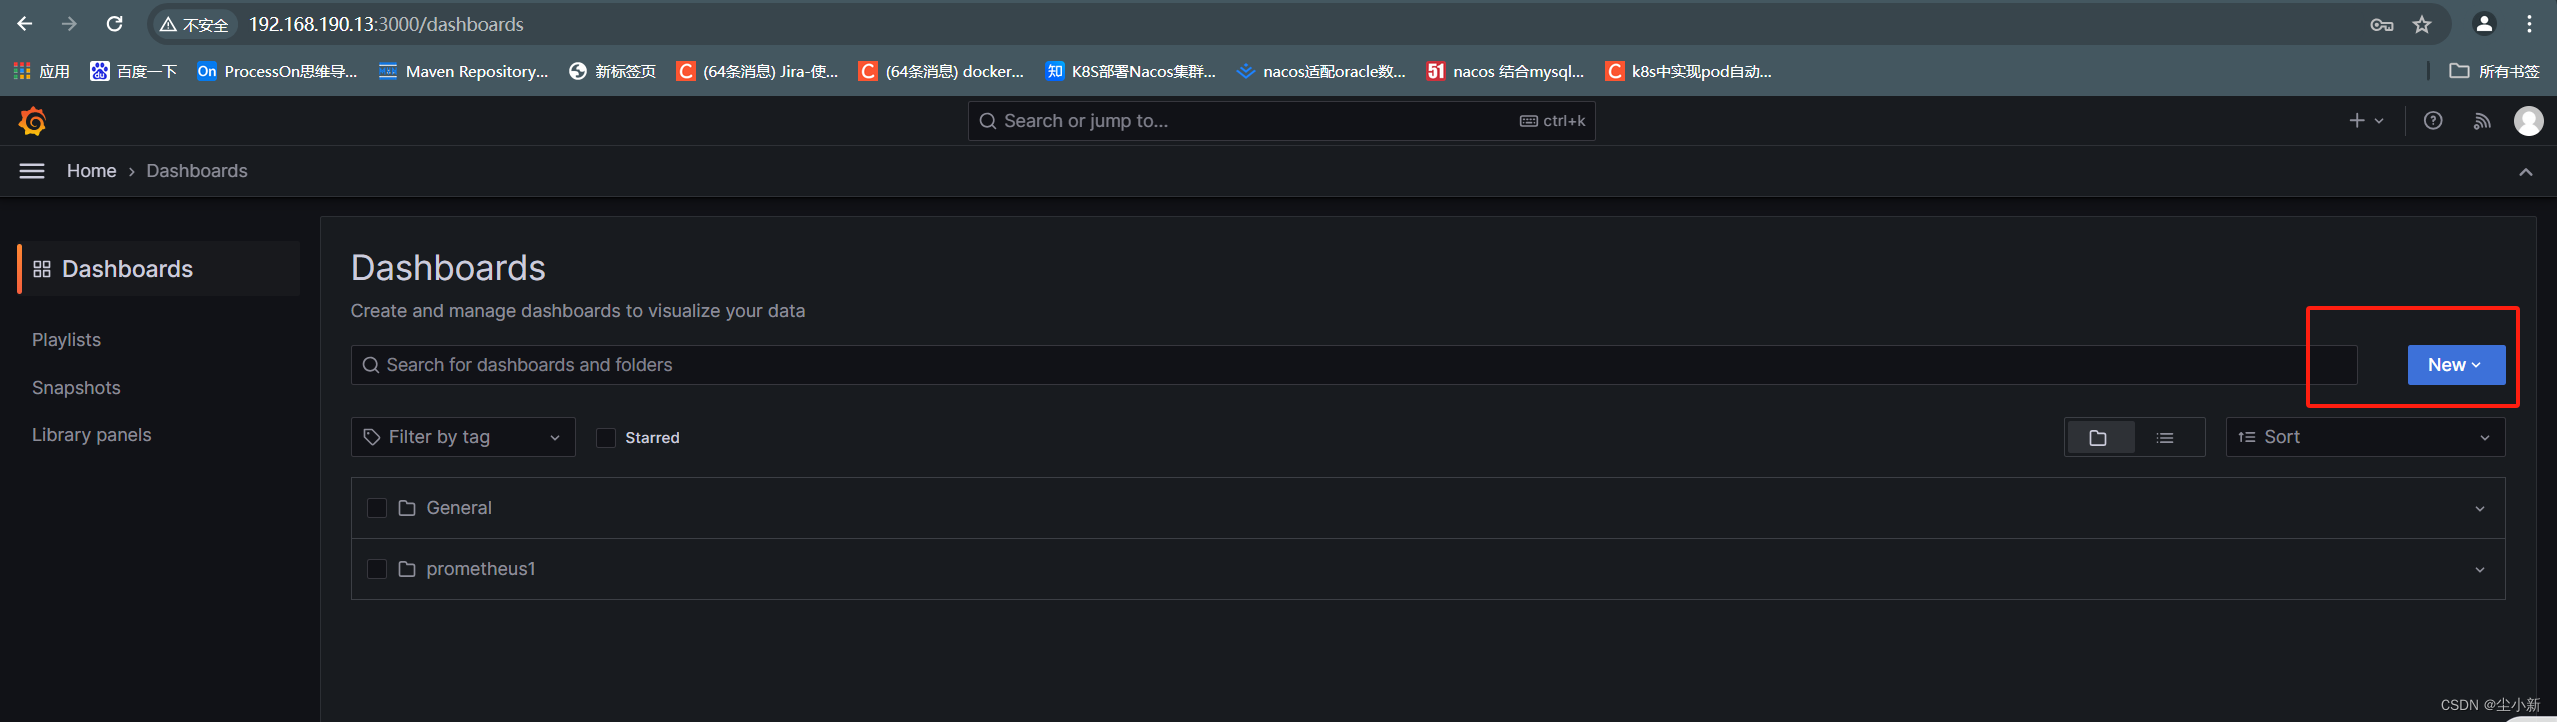
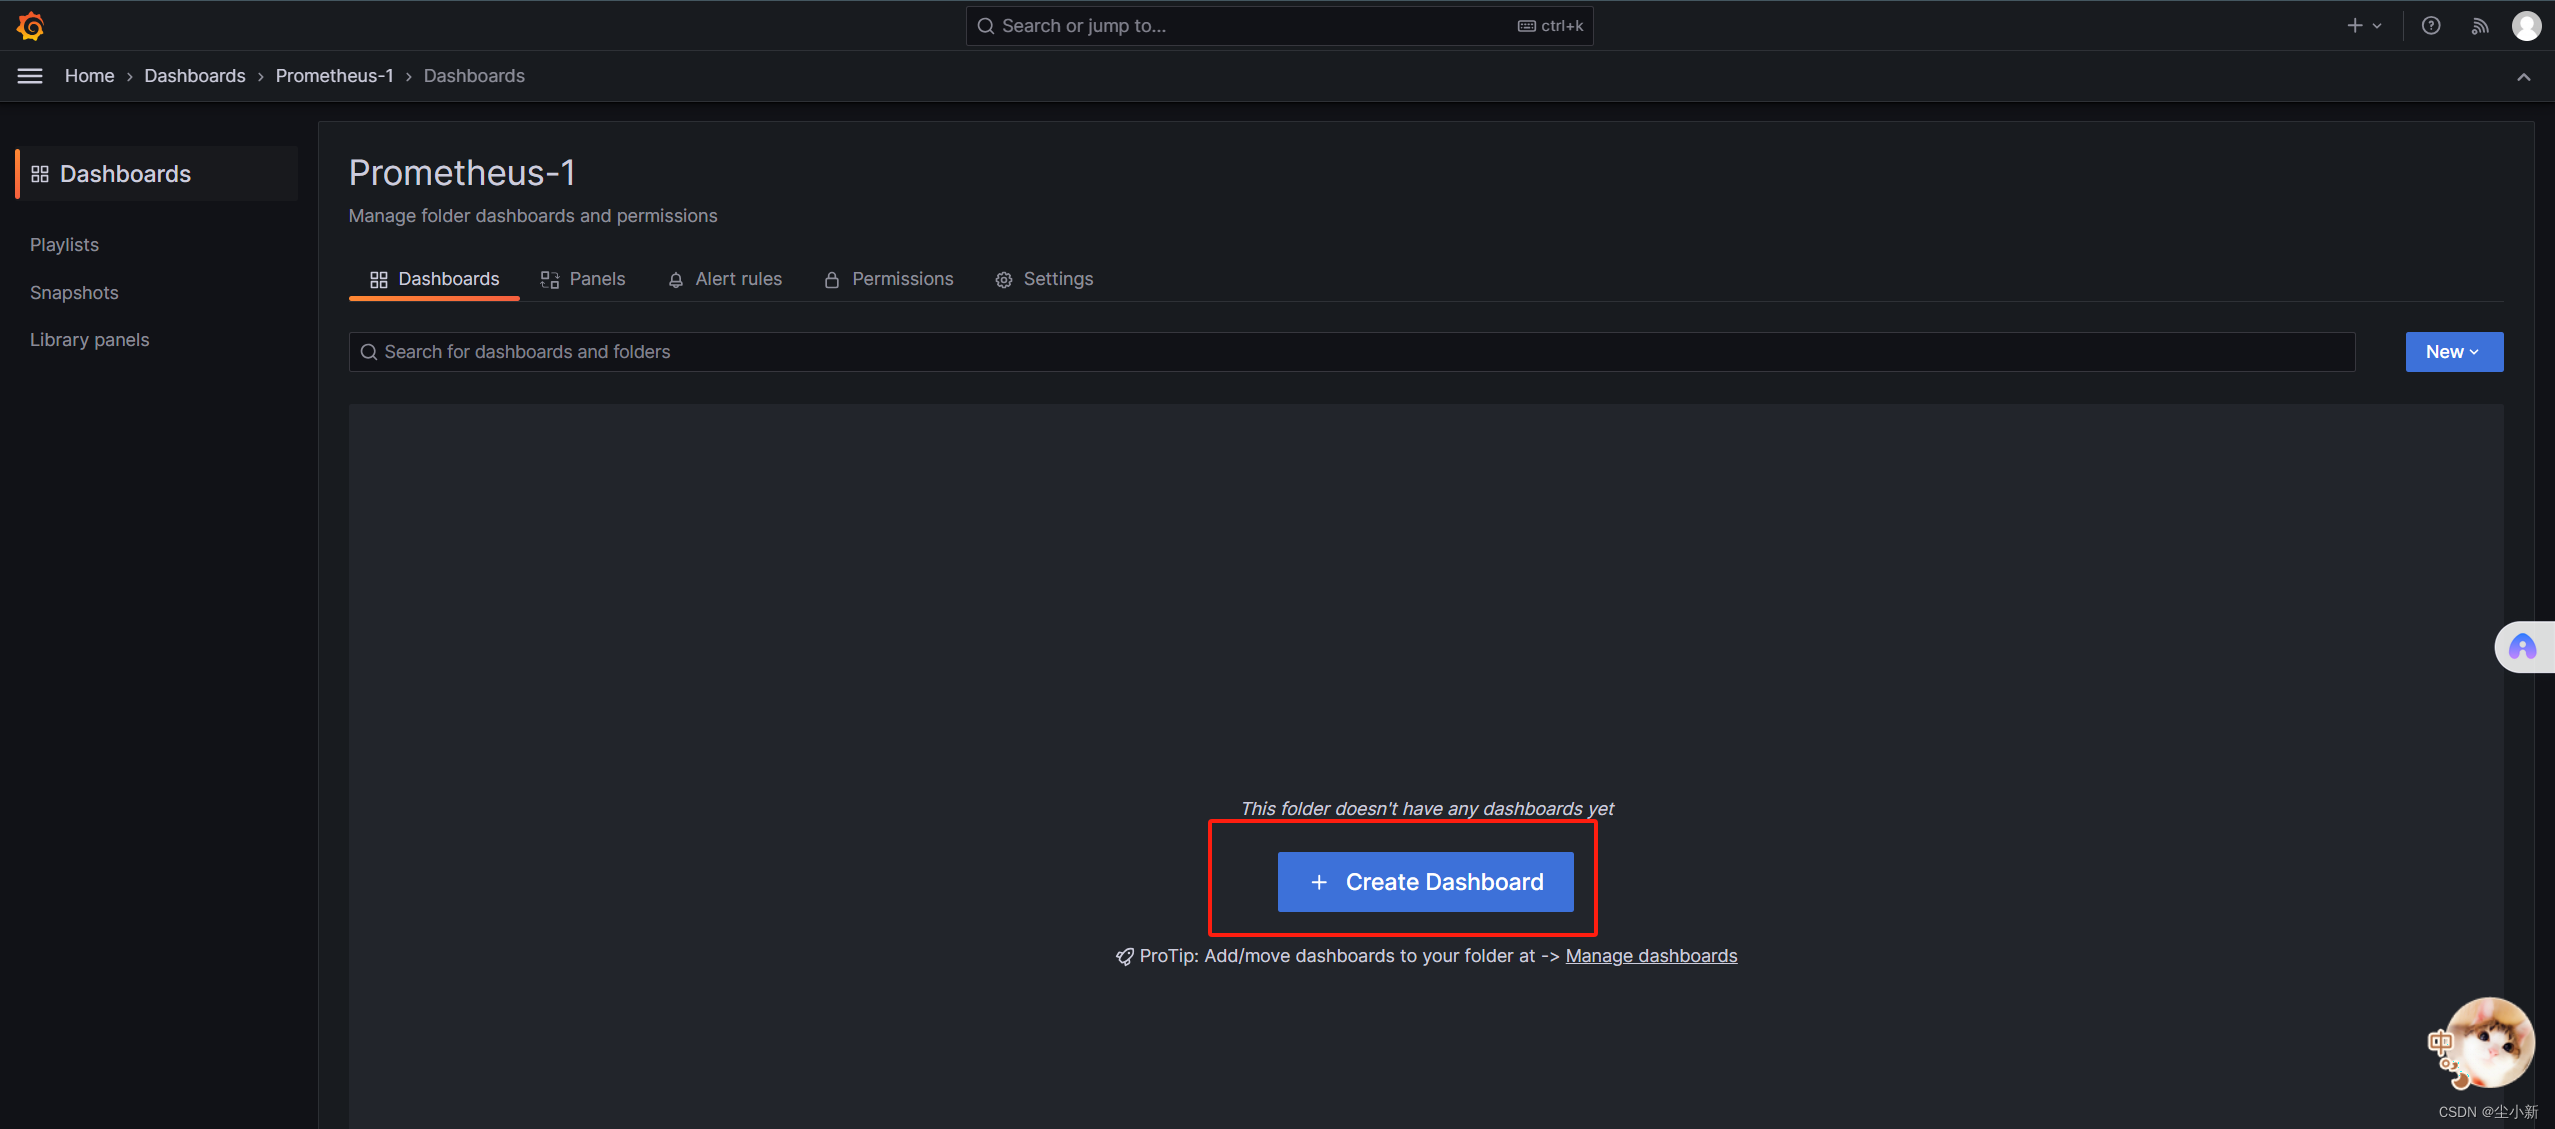
进入目录后,创建仪表盘
【create dashboard】
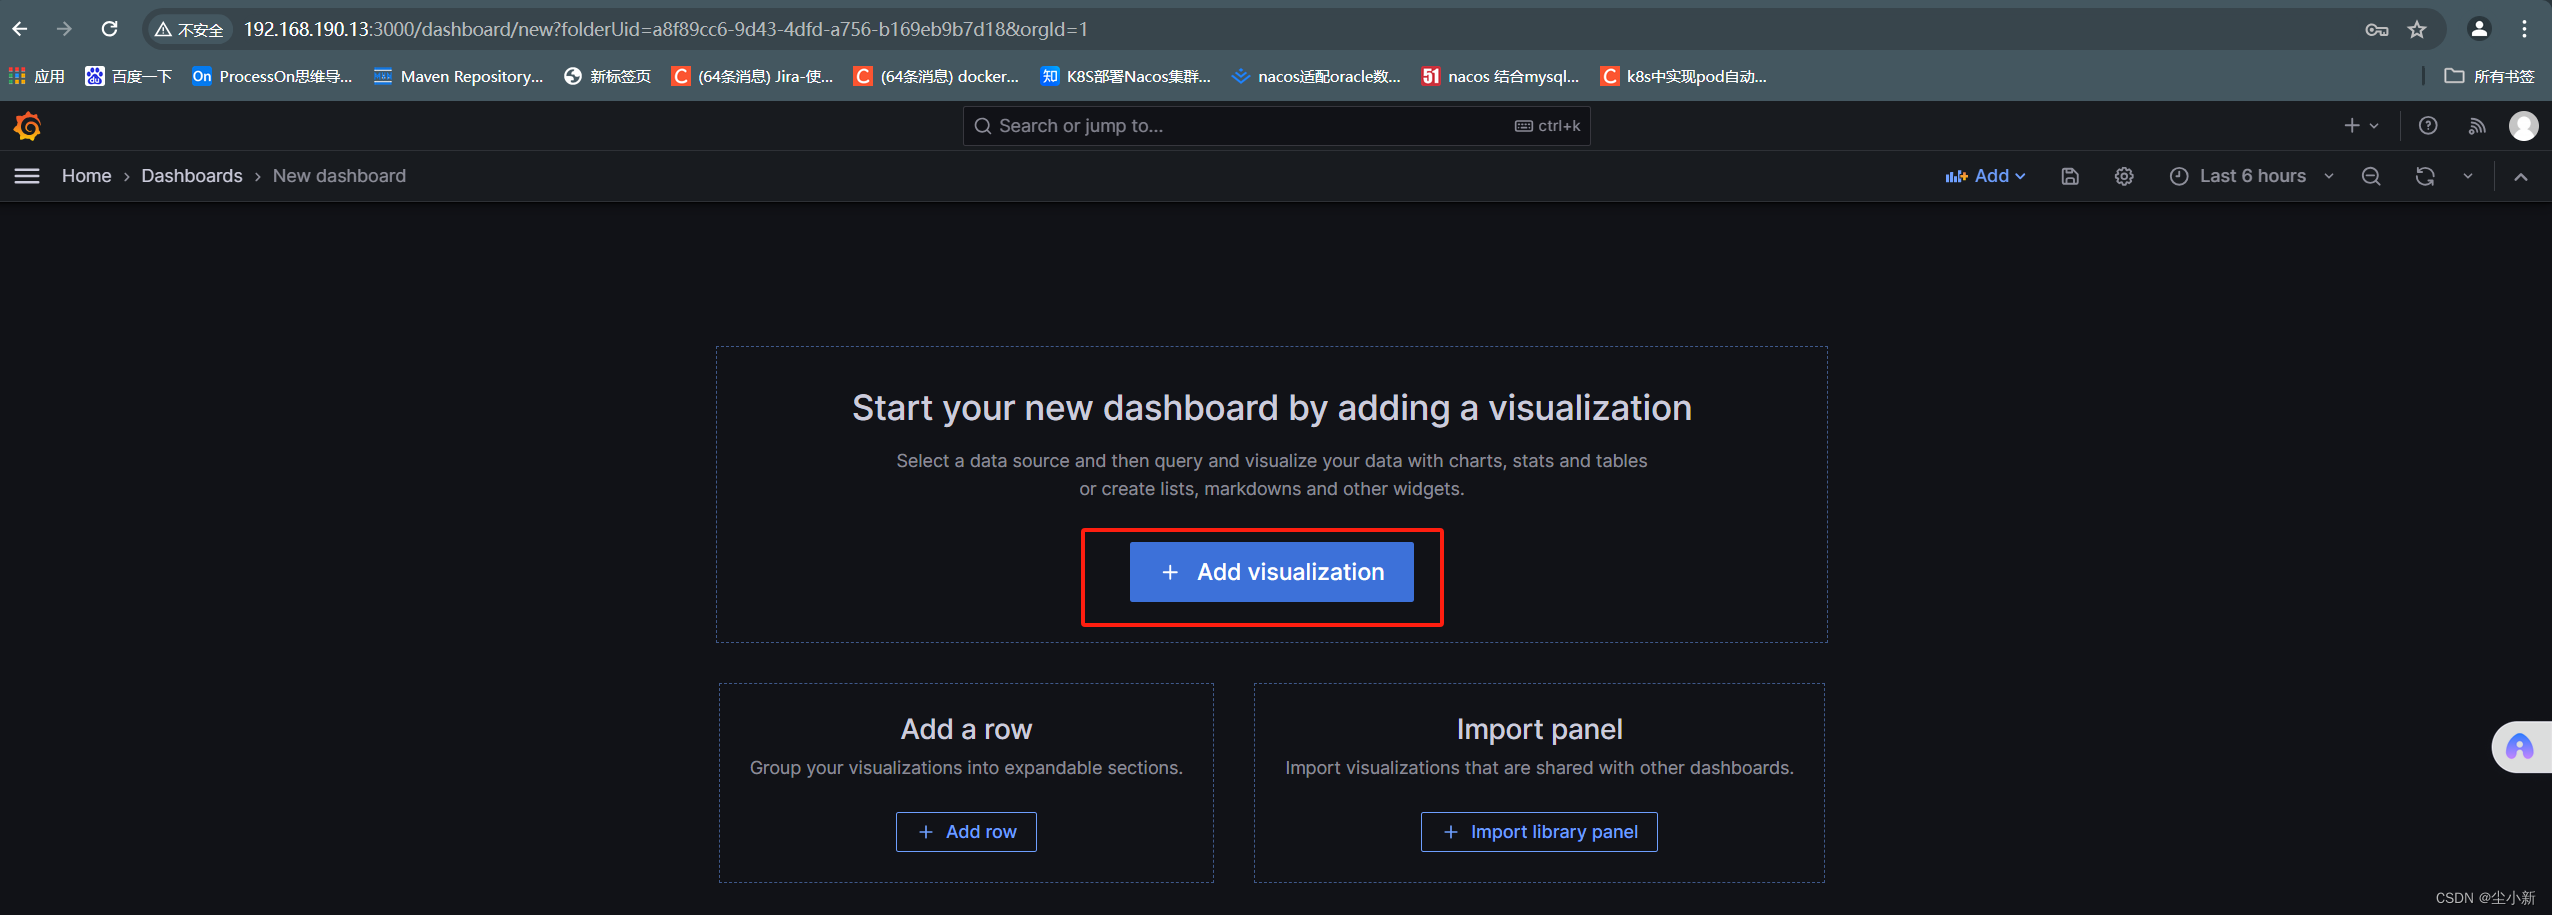
选择数据源
【Add visualization】
选择刚刚添加的数据源
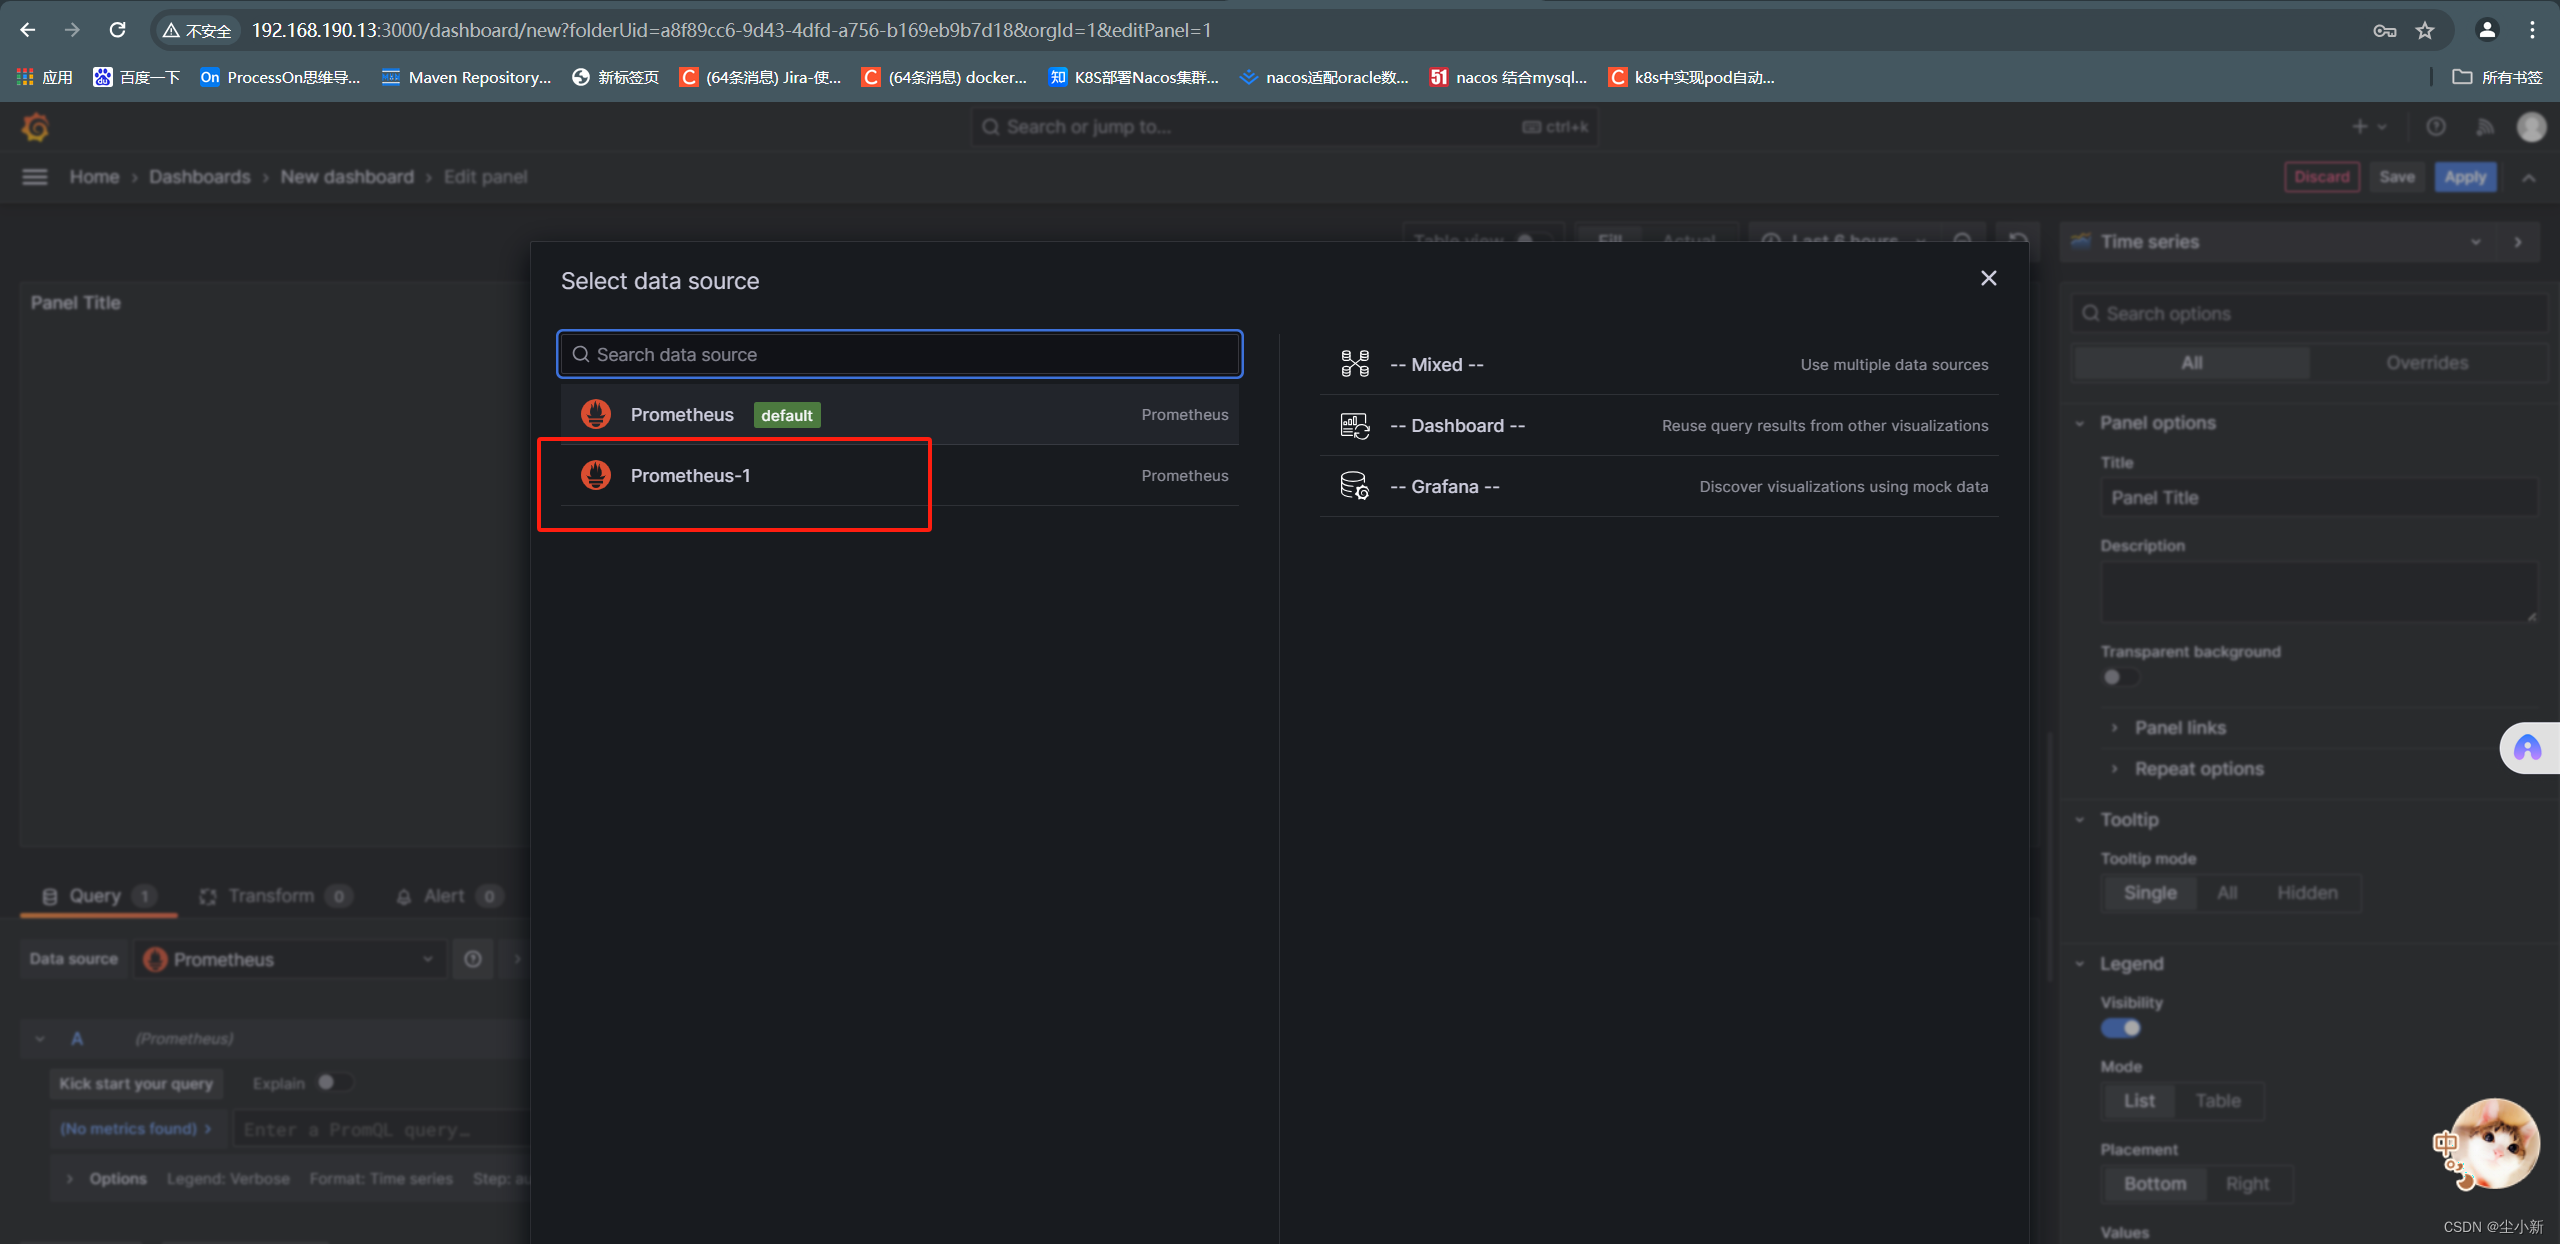
此时进入到,仪表盘的编辑页面;
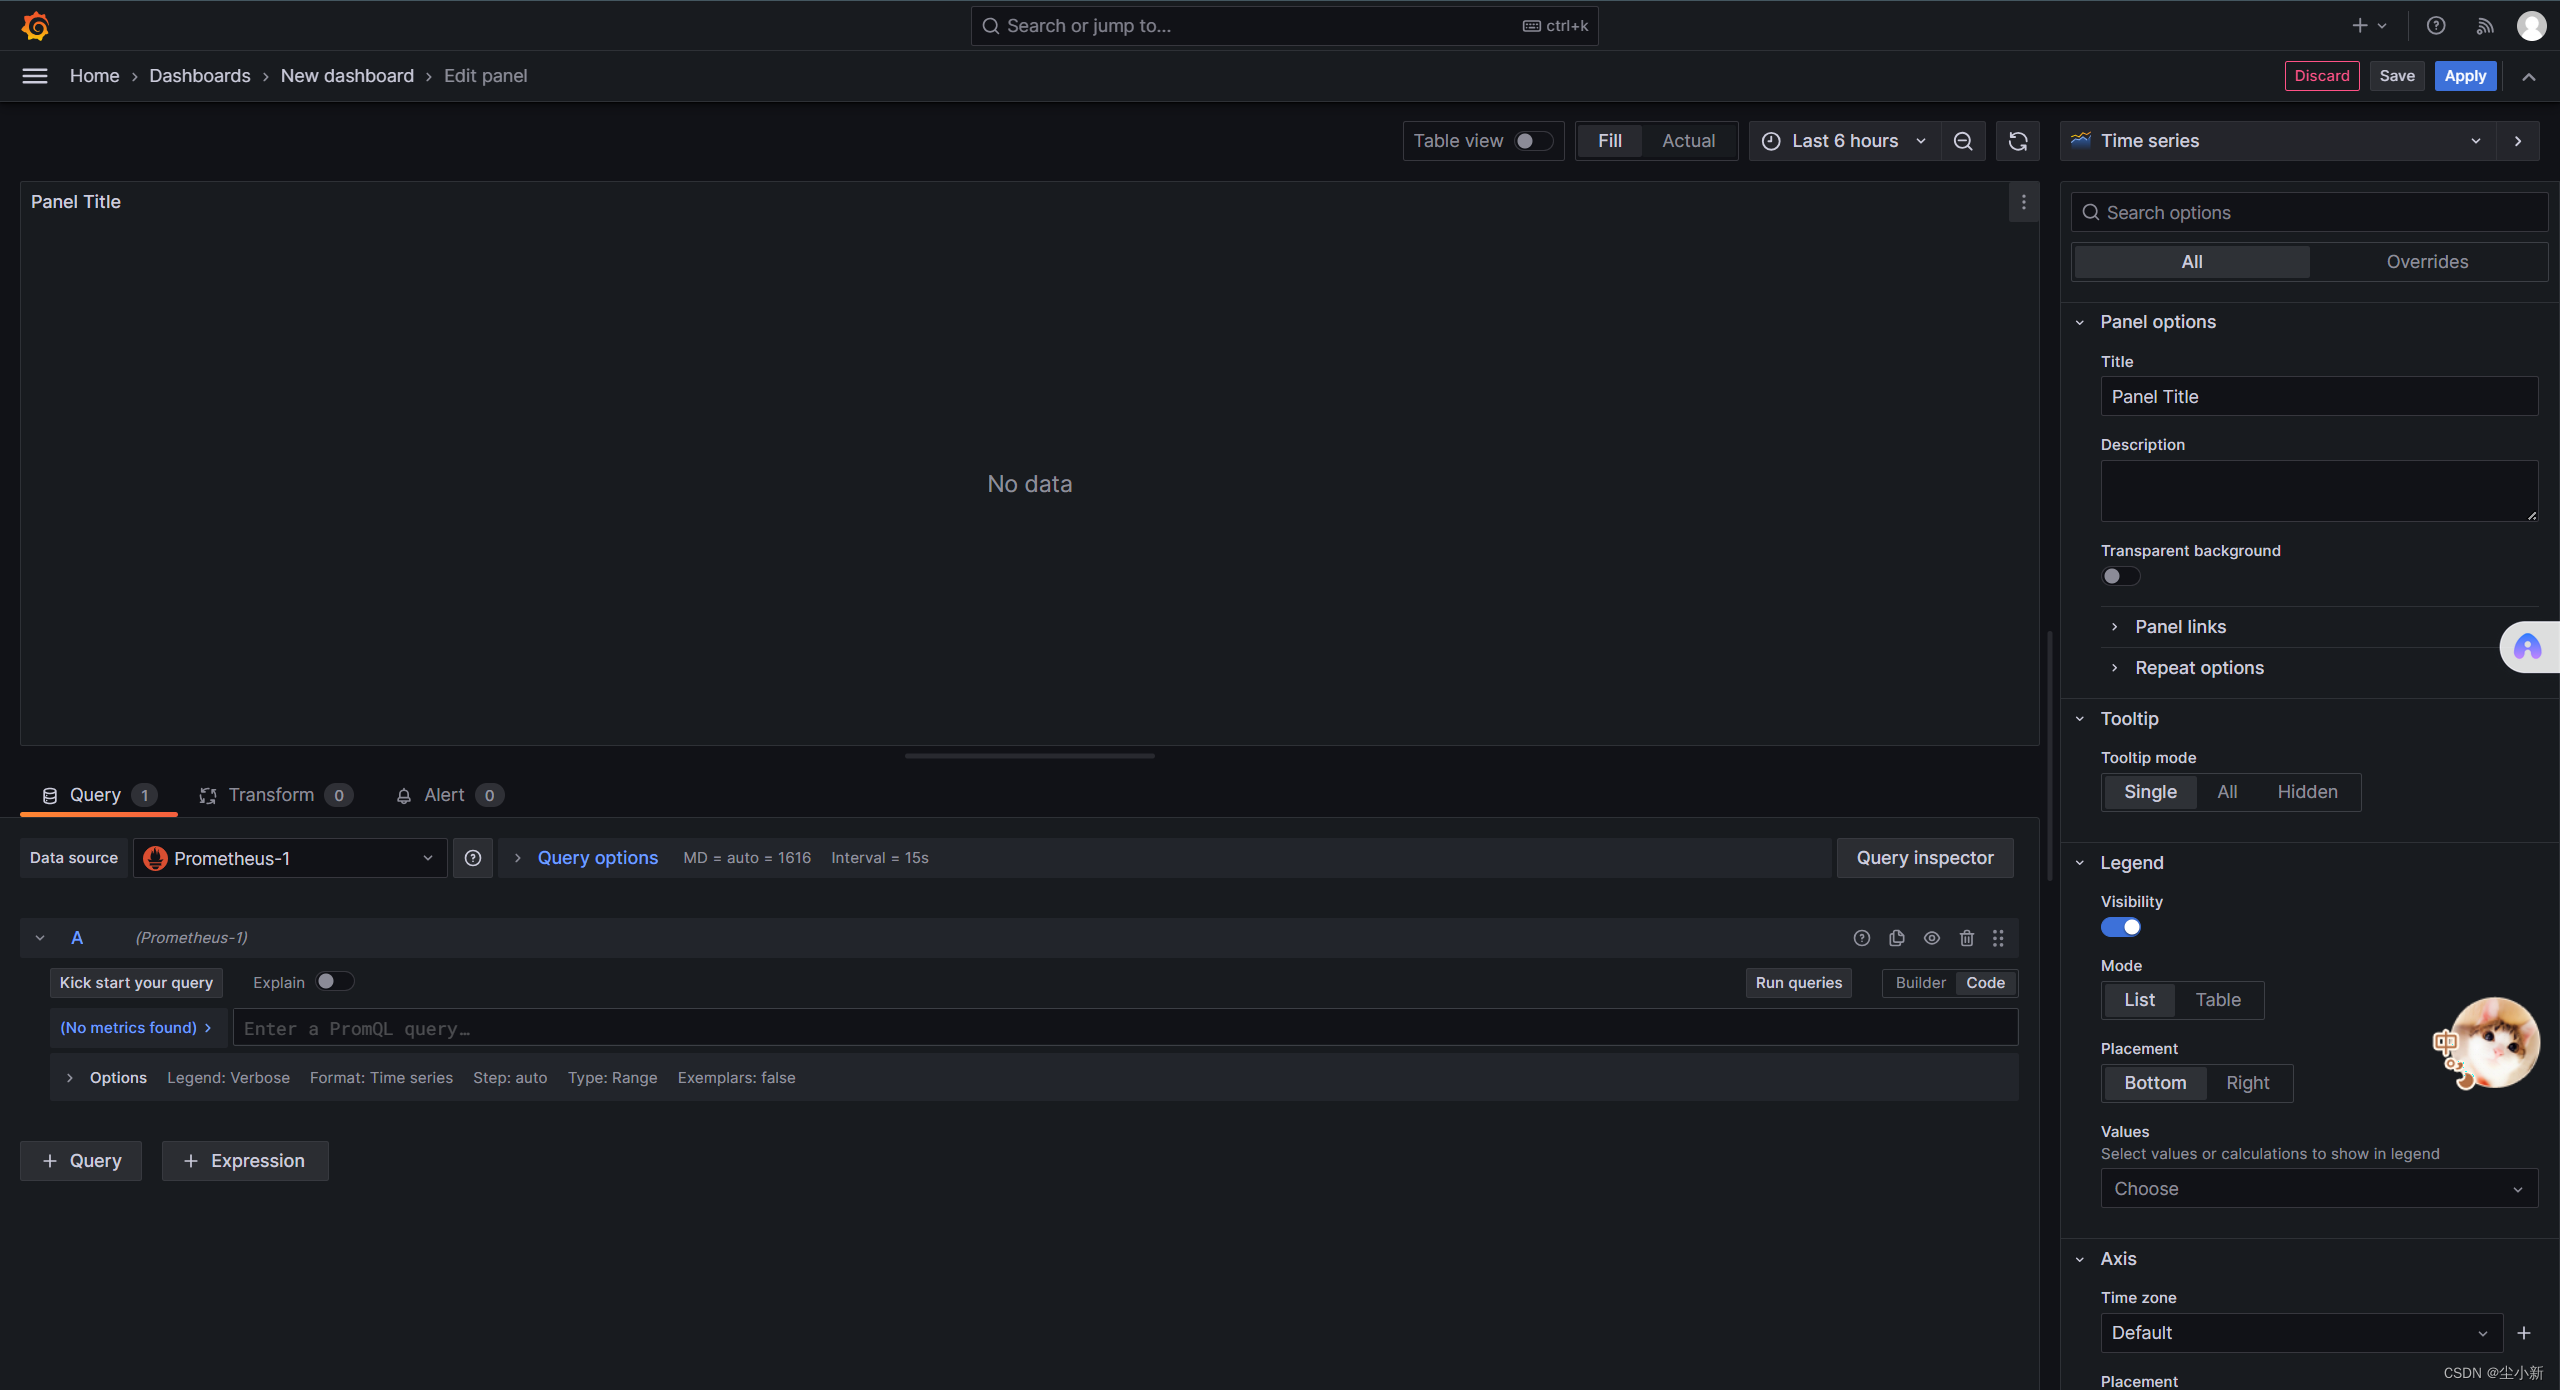
· 创建一个数据展示图
1,测试代码
第一步,测试代码,就是计算一个cpu使用率的PromeQL代码;
测试没问题,就复制;
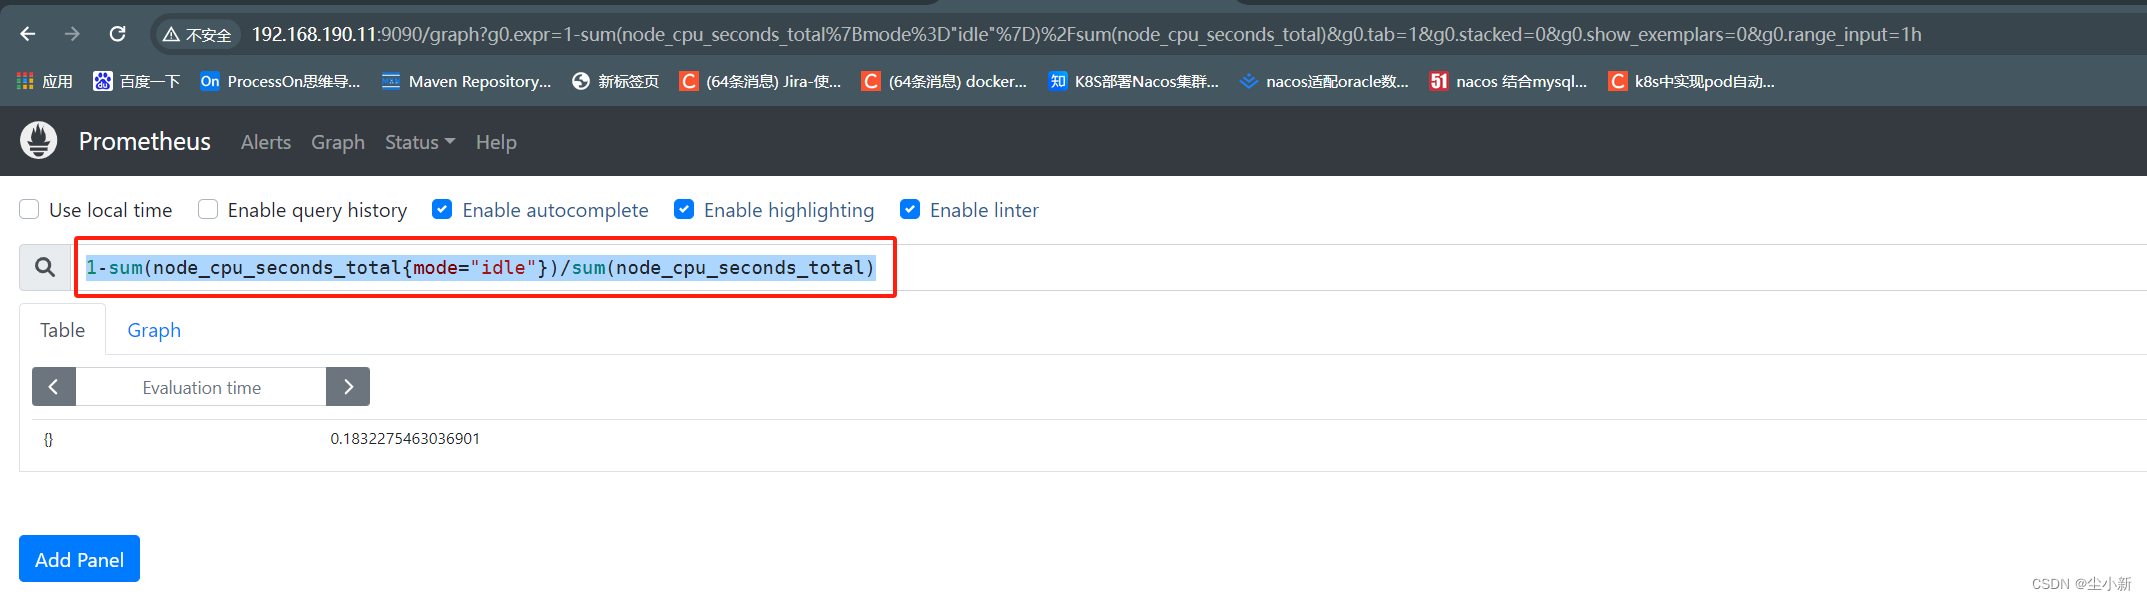
写入grafana图形
1-sum(node_cpu_seconds_total{mode="idle"})/sum(node_cpu_seconds_total)
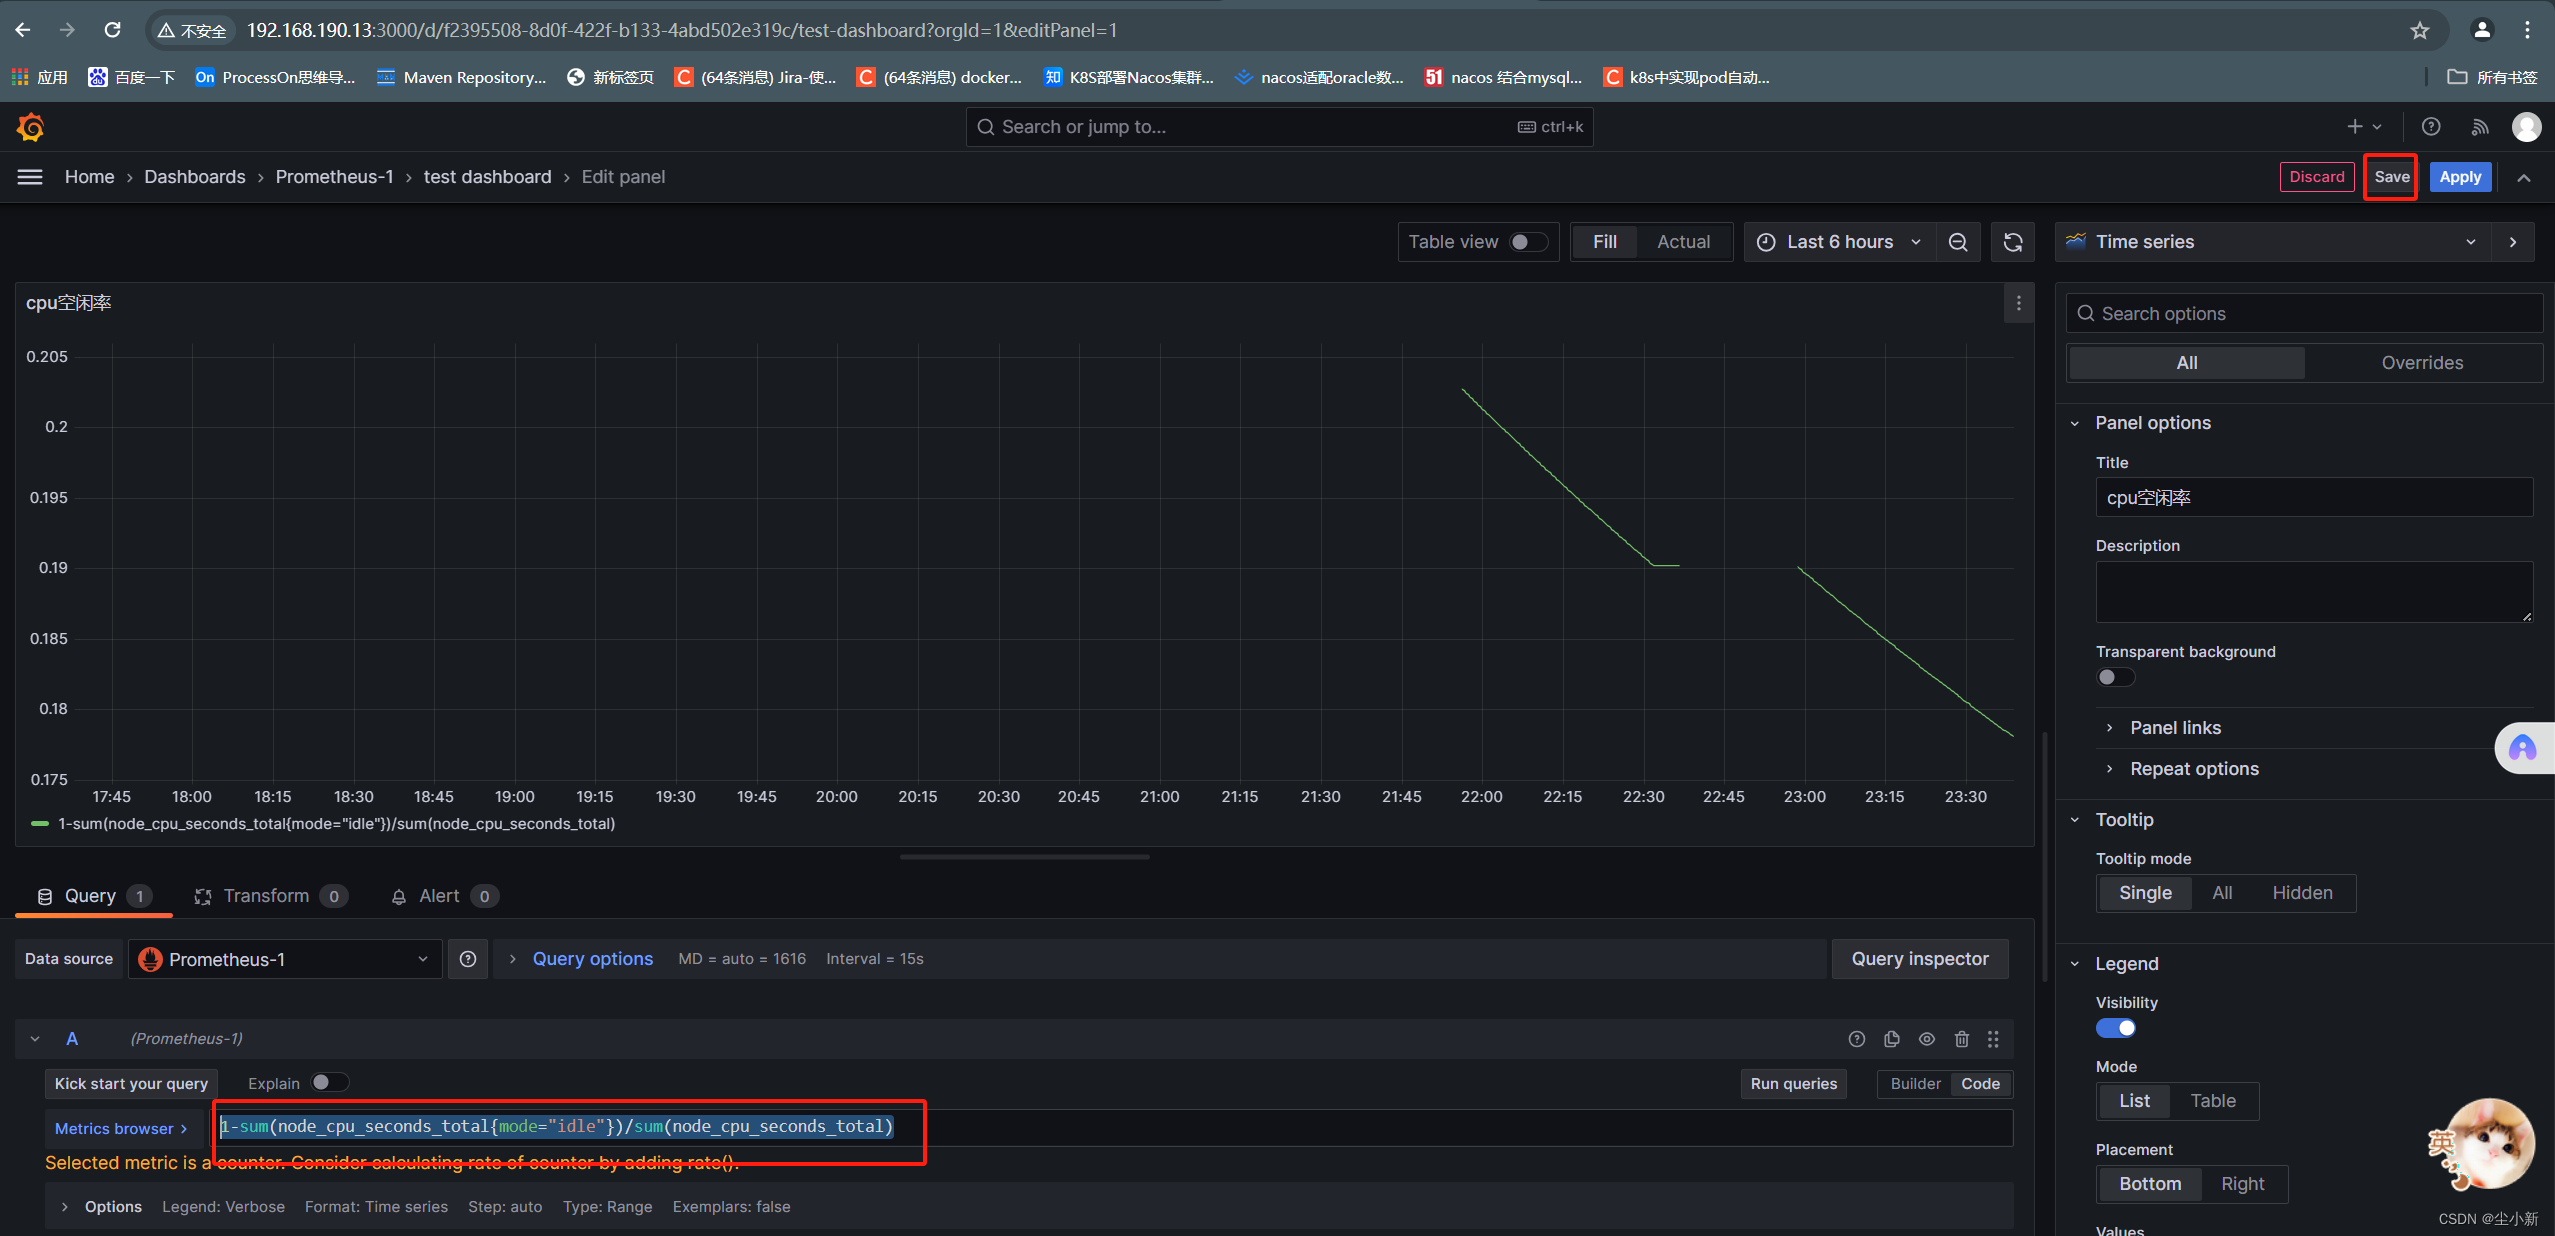 点右上角save保存
4,下载开源的仪表盘
#grafana官网查询dashboard模板id
https://grafana.com/grafana/dashboards
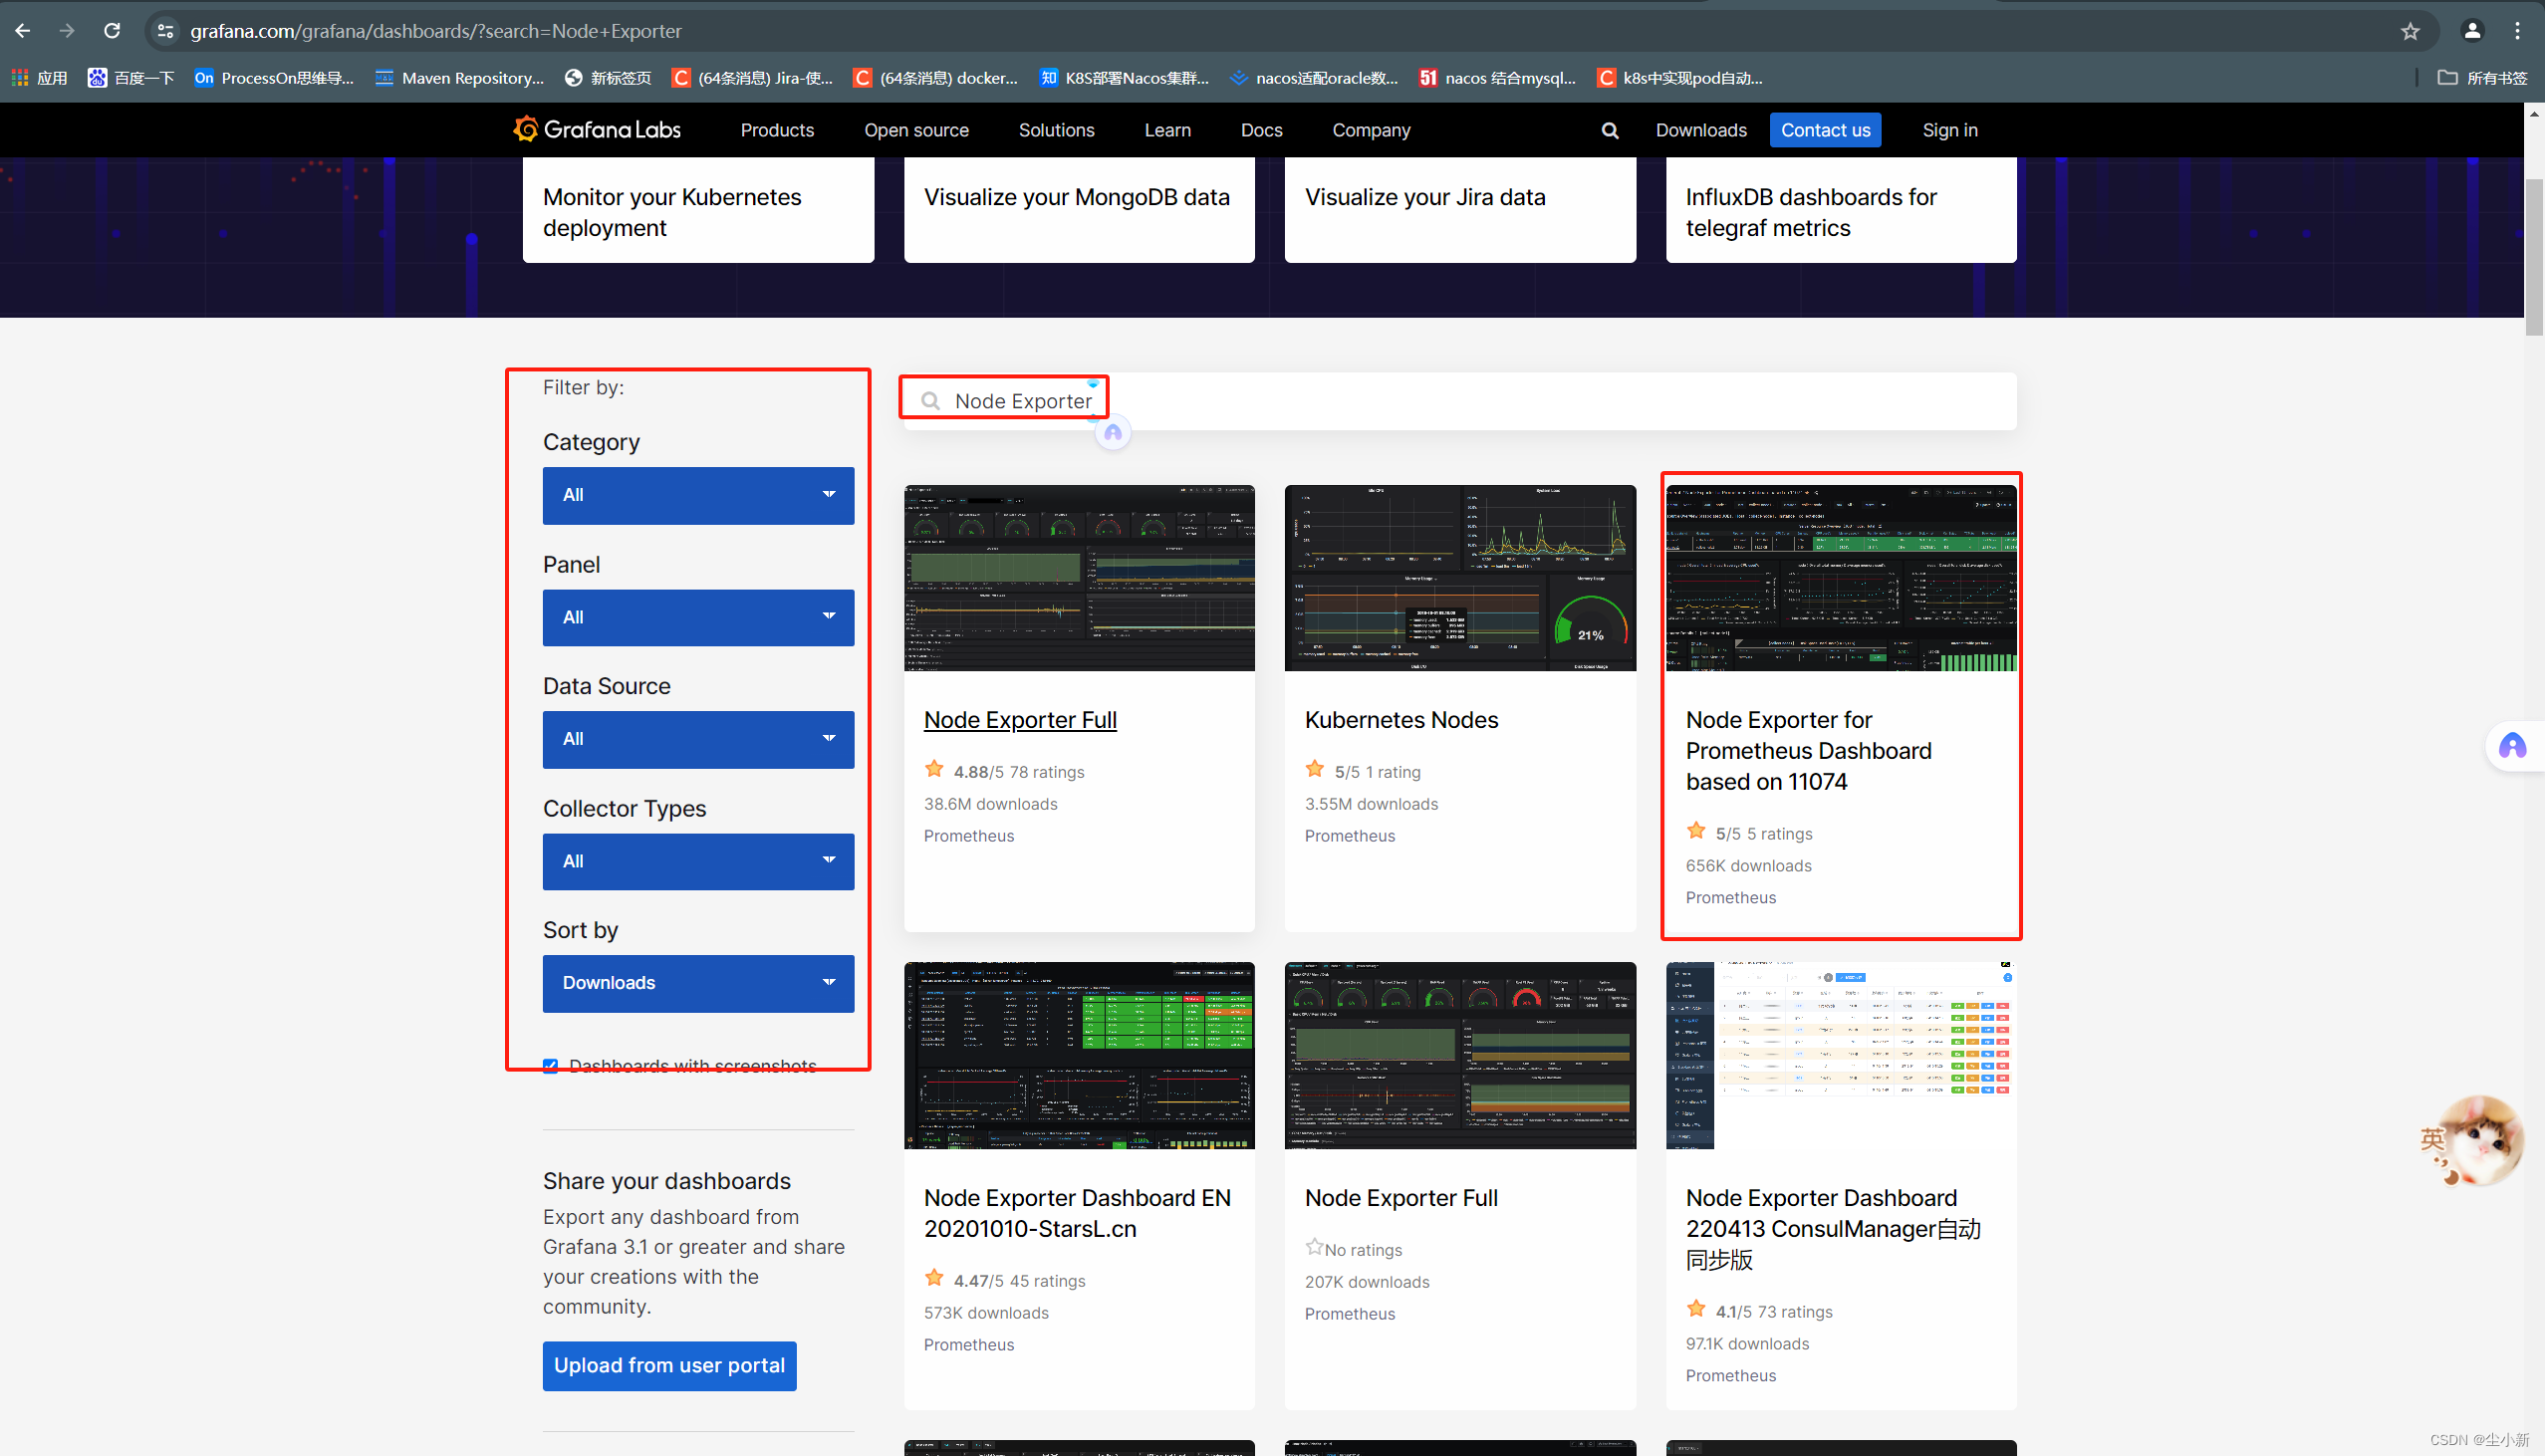
· 下载仪表盘
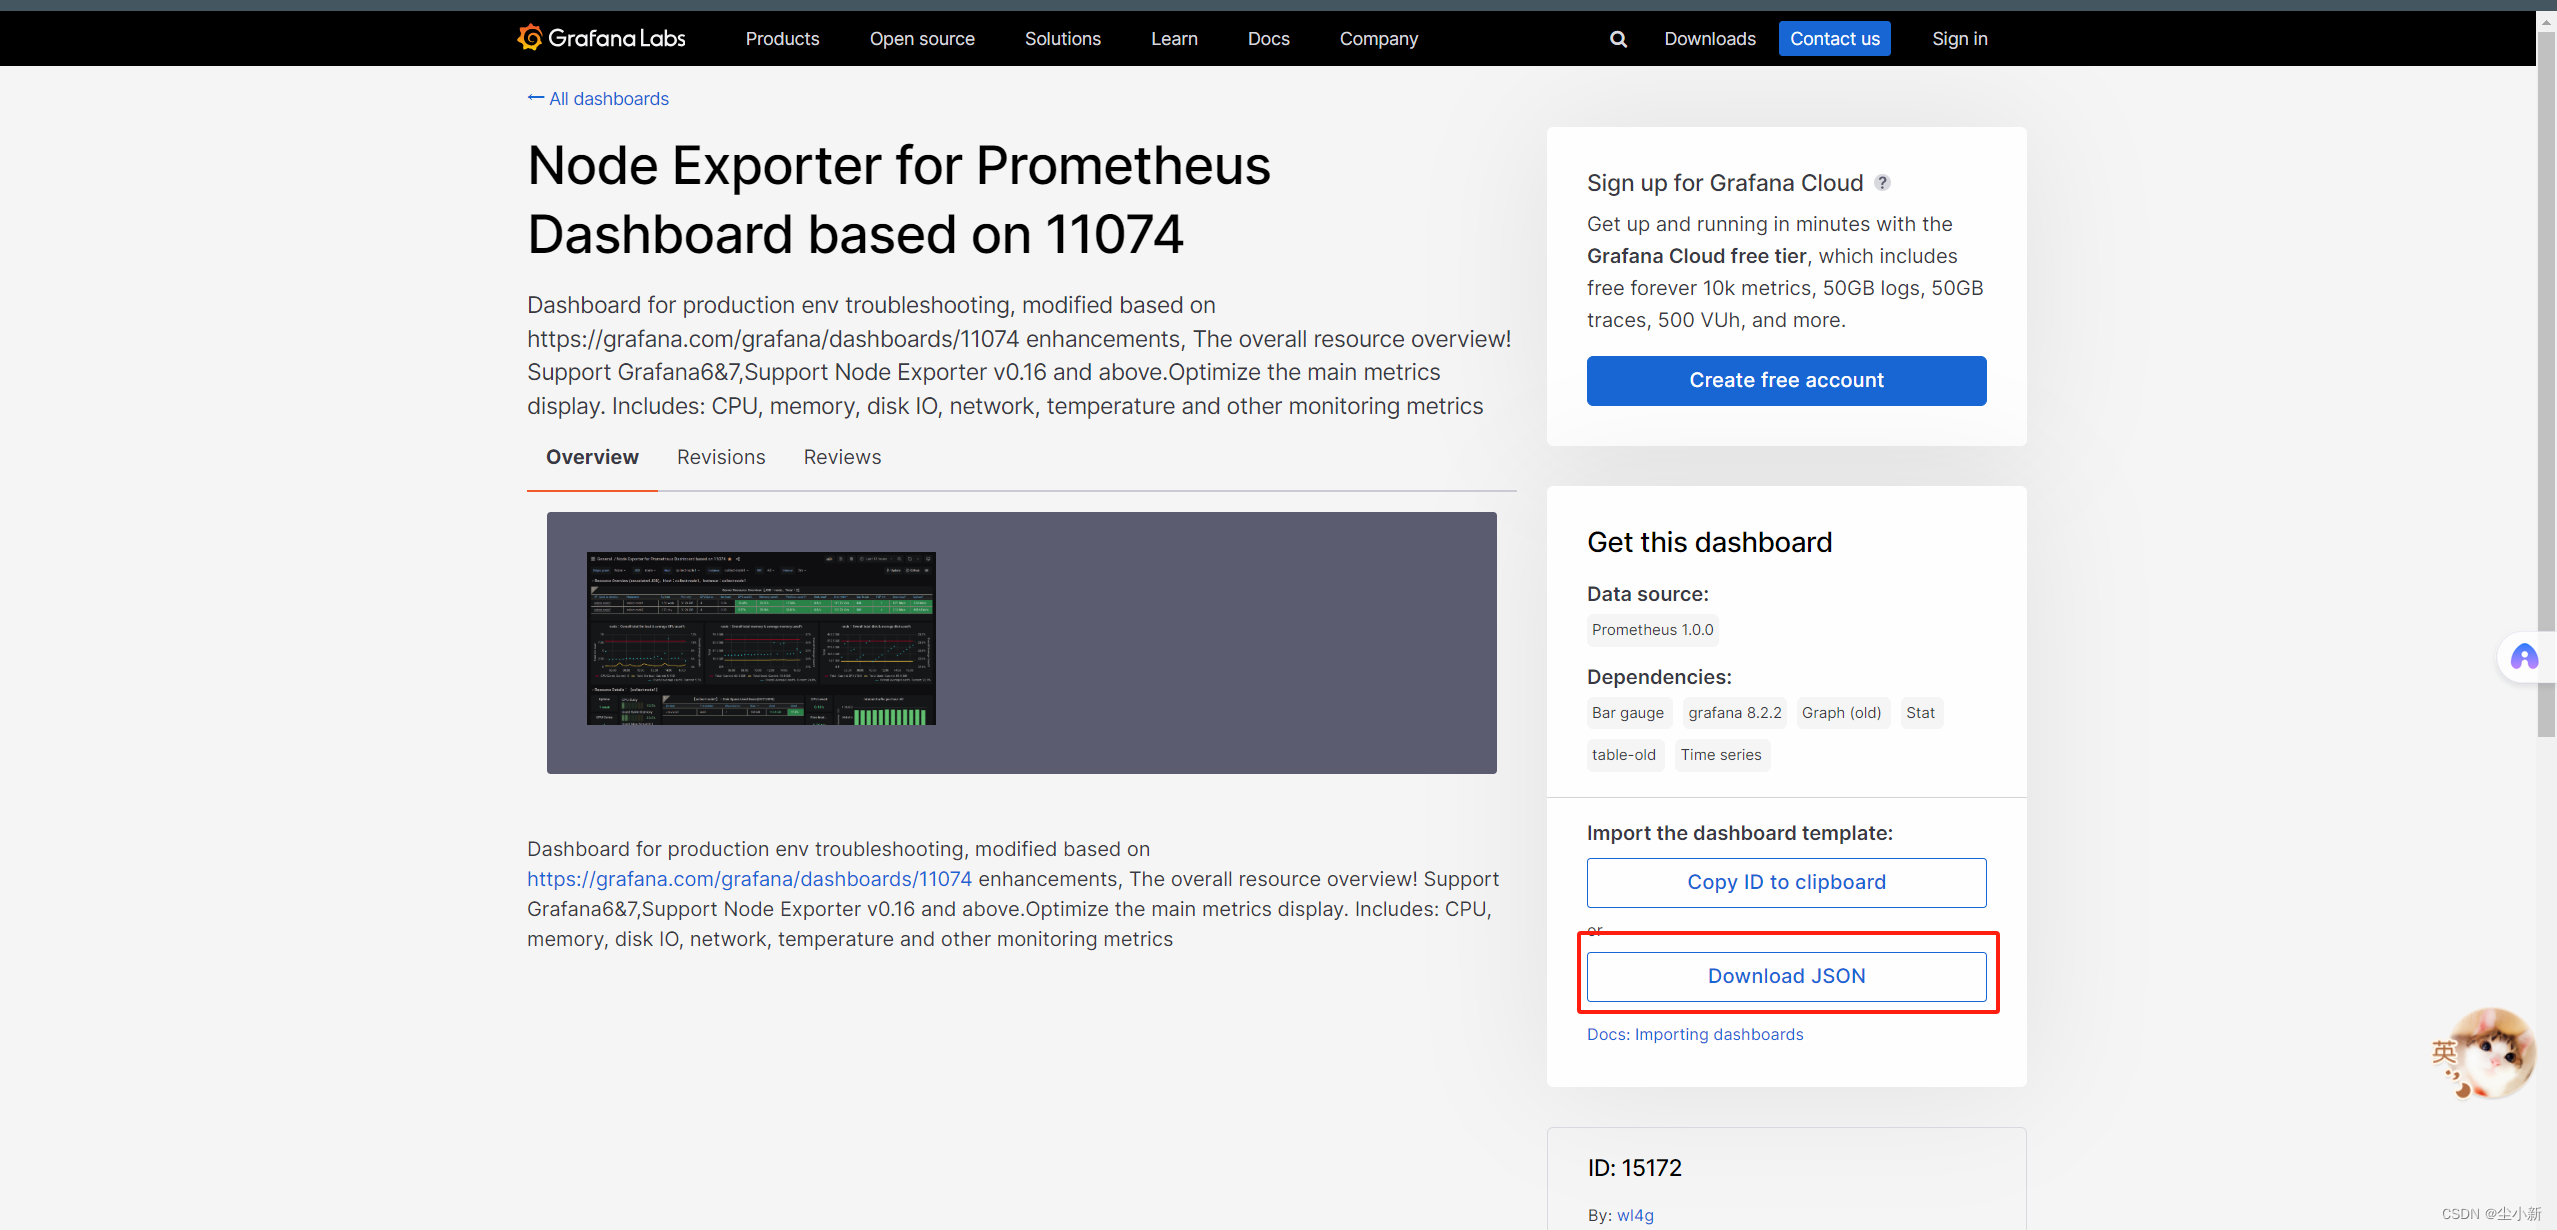
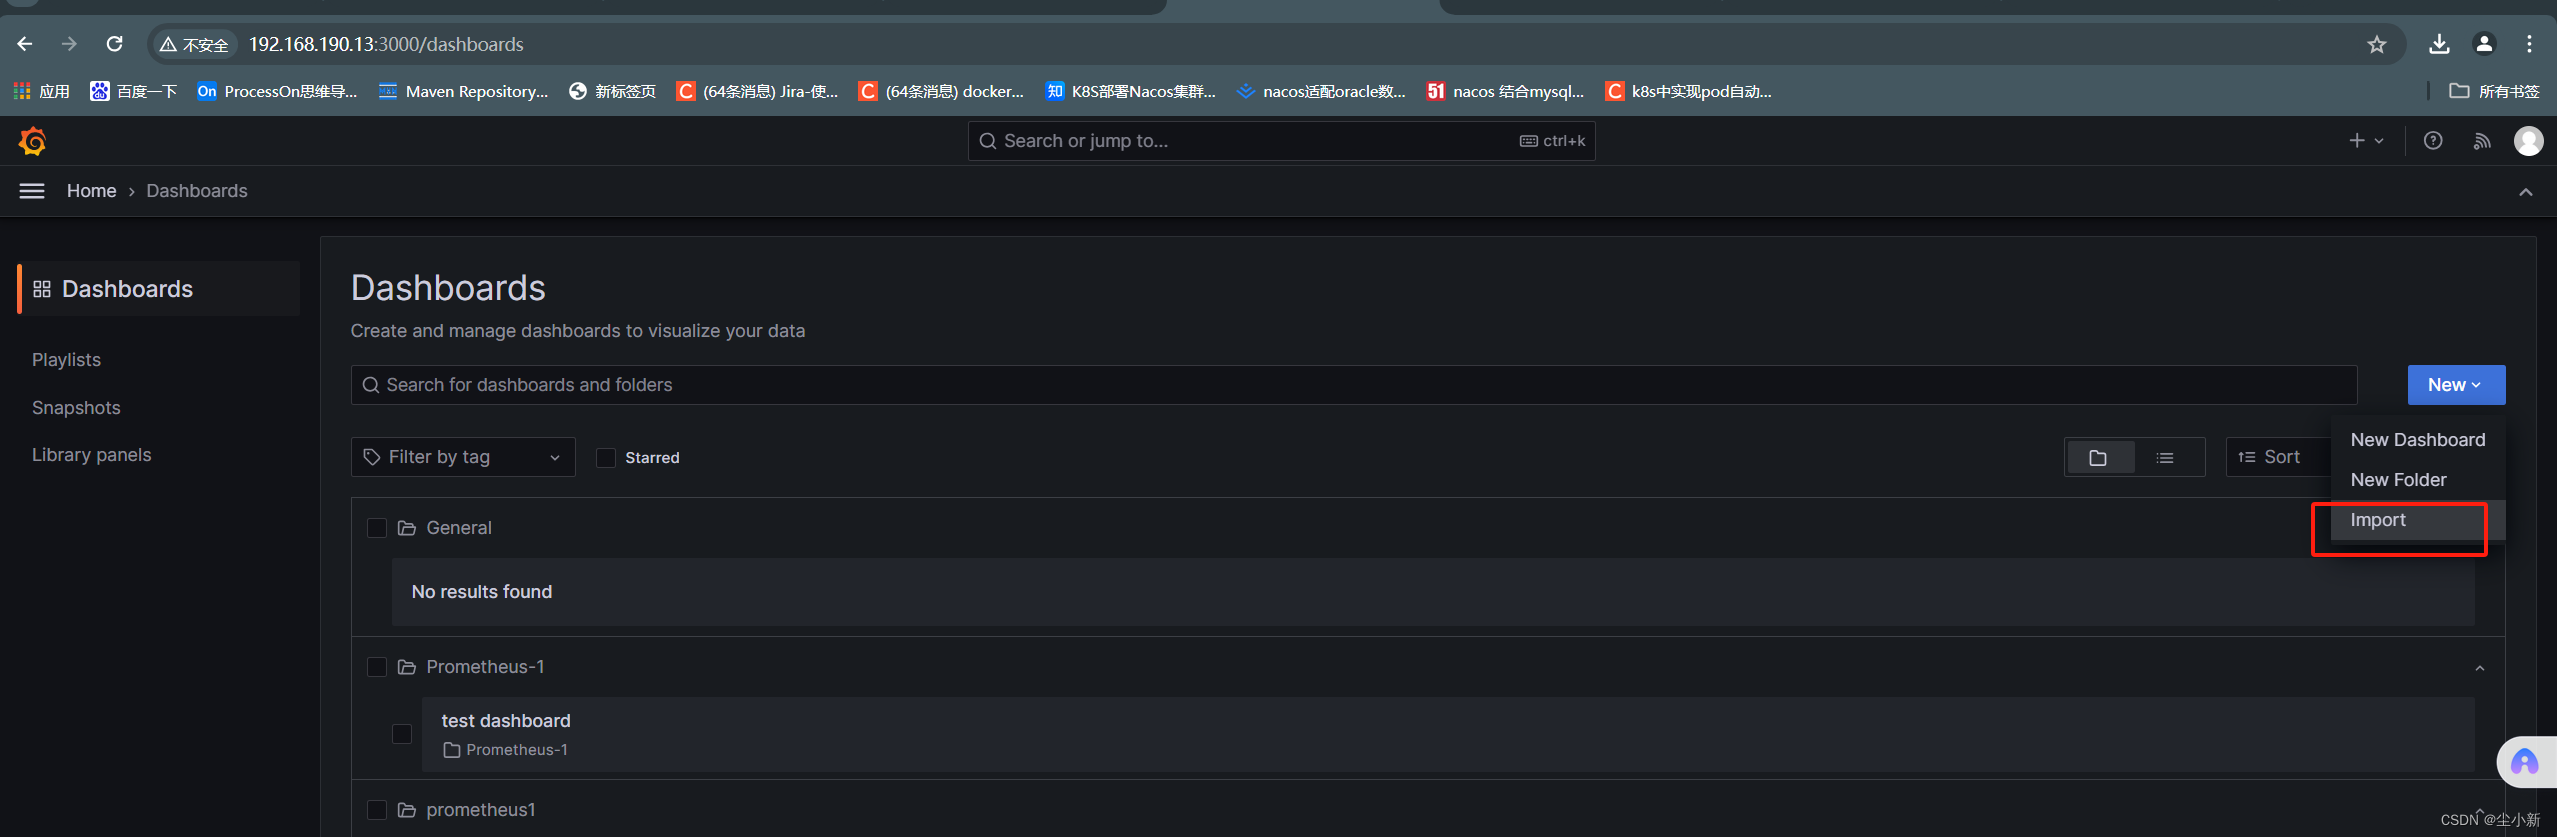
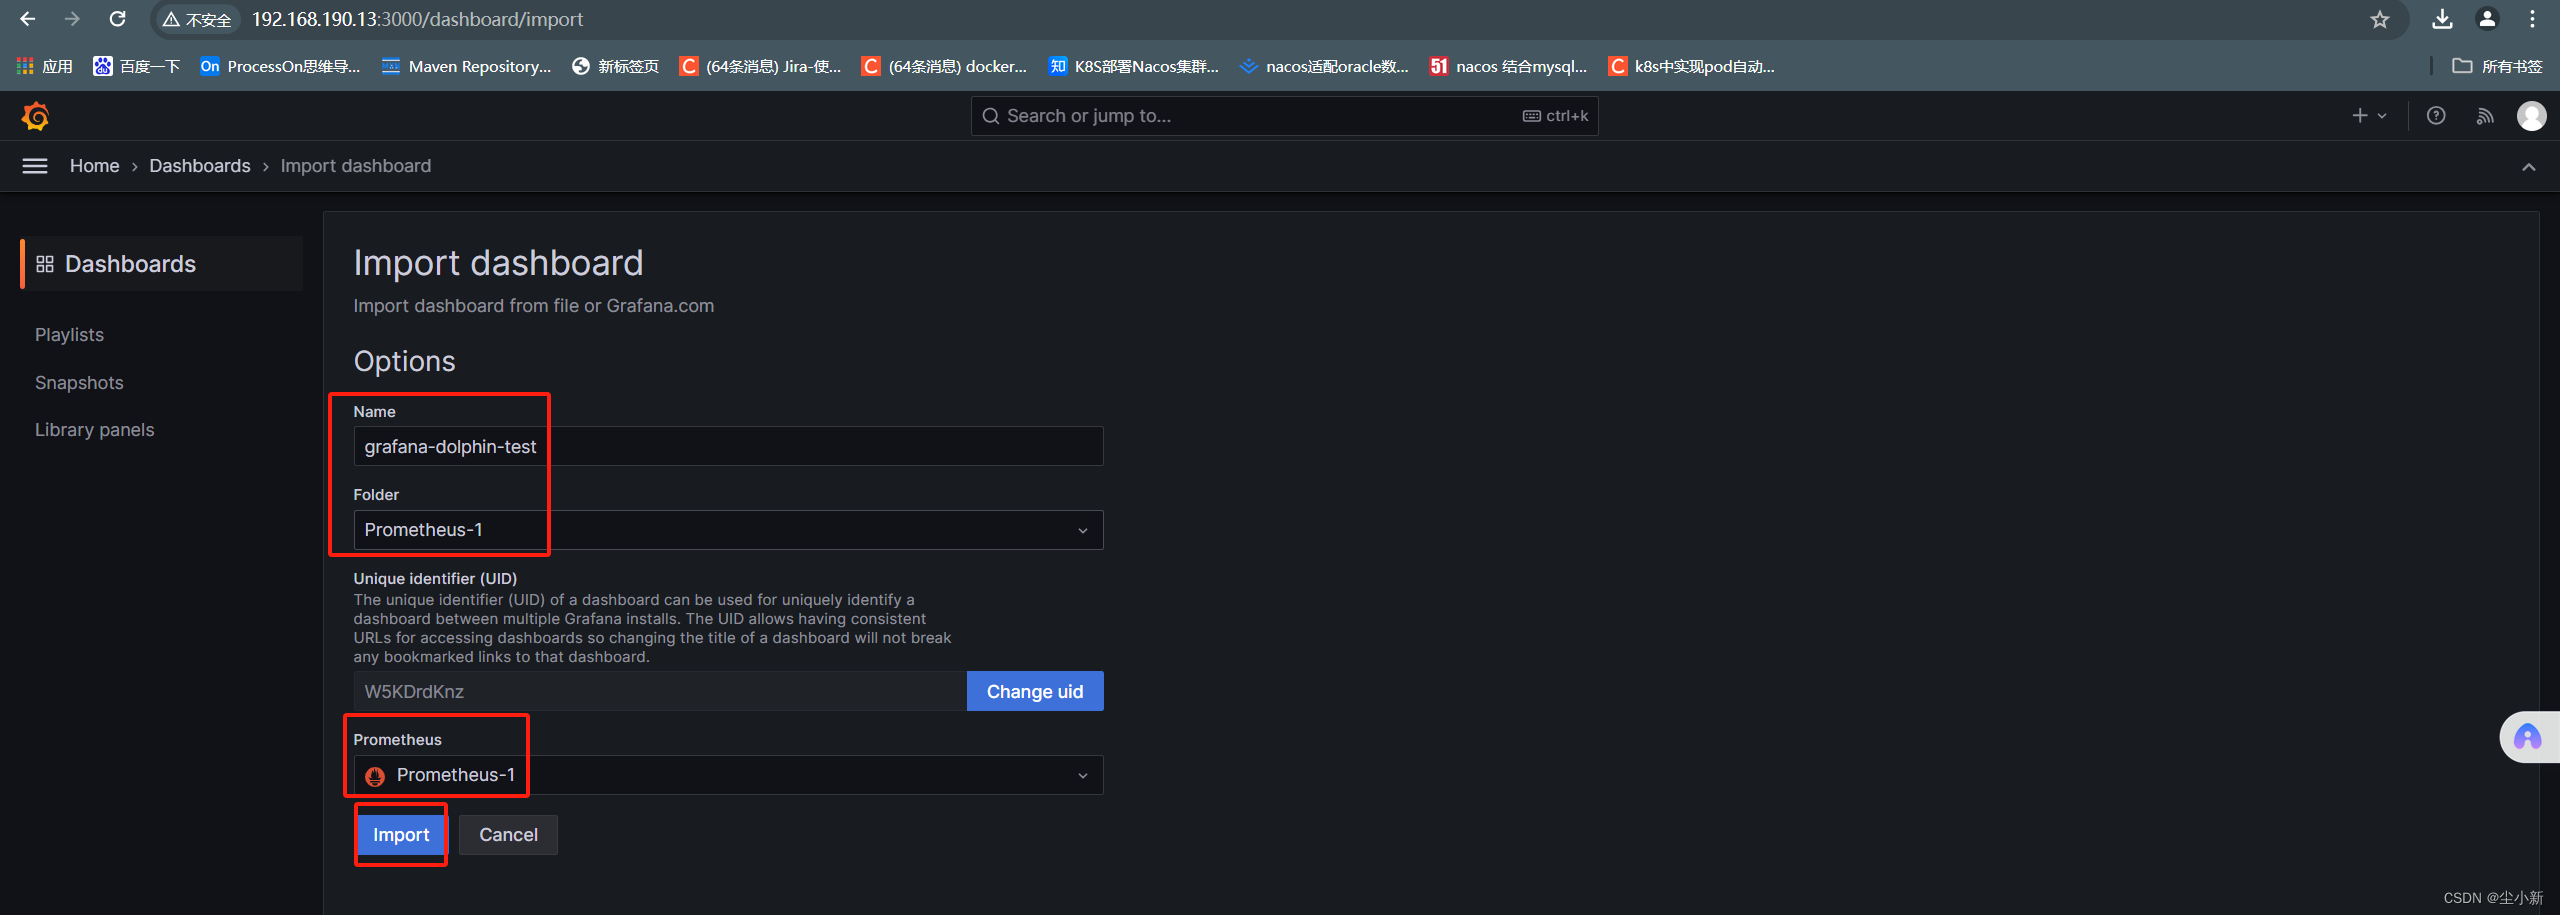
· 上传仪表盘json文件到grafana
【home】-【dashboard】-【new】-【import】
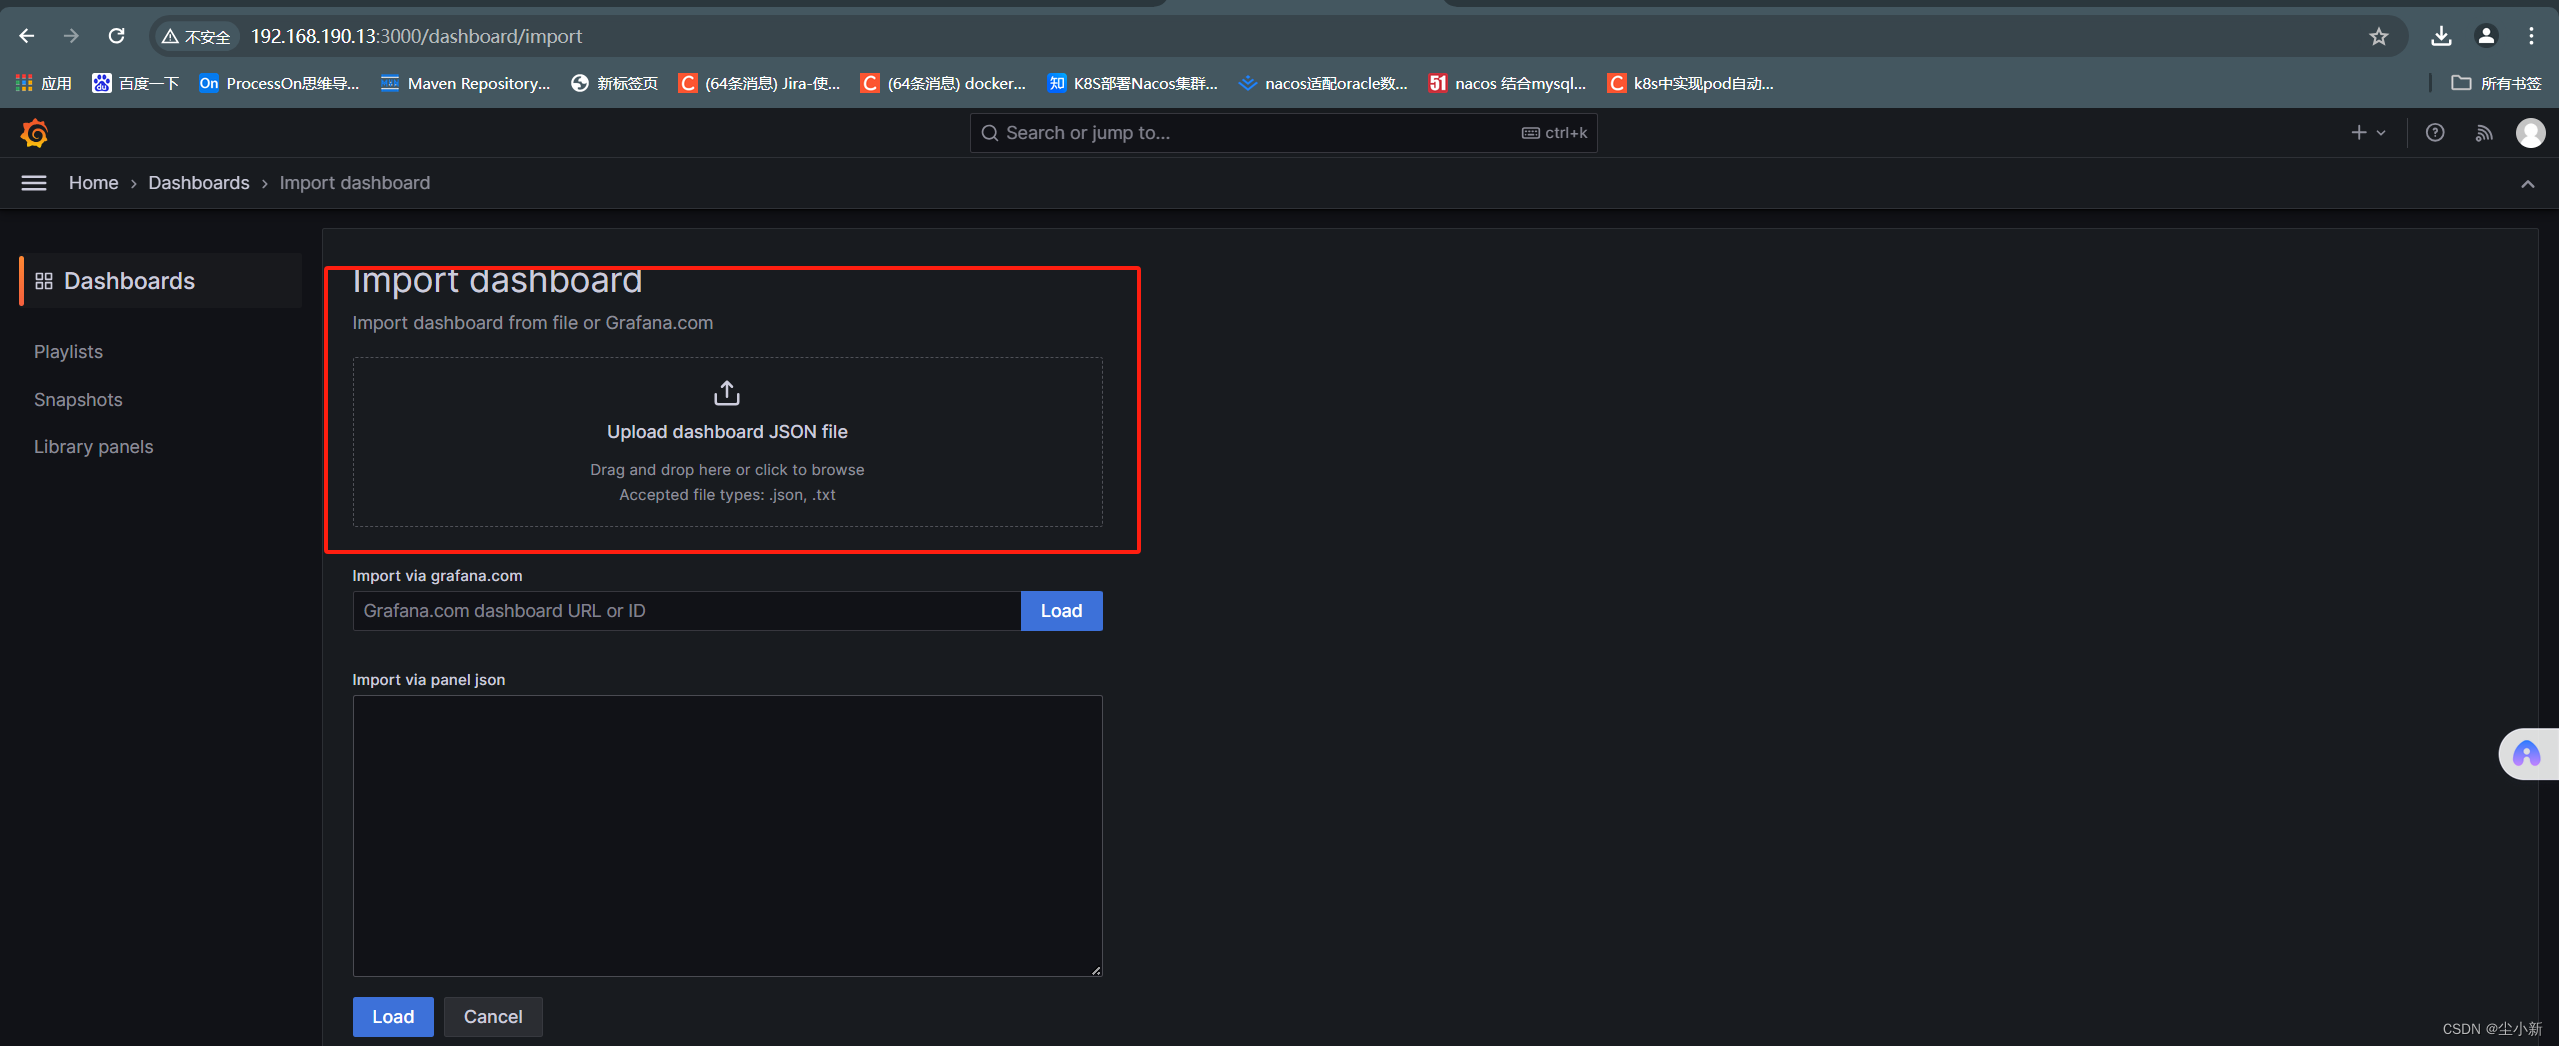
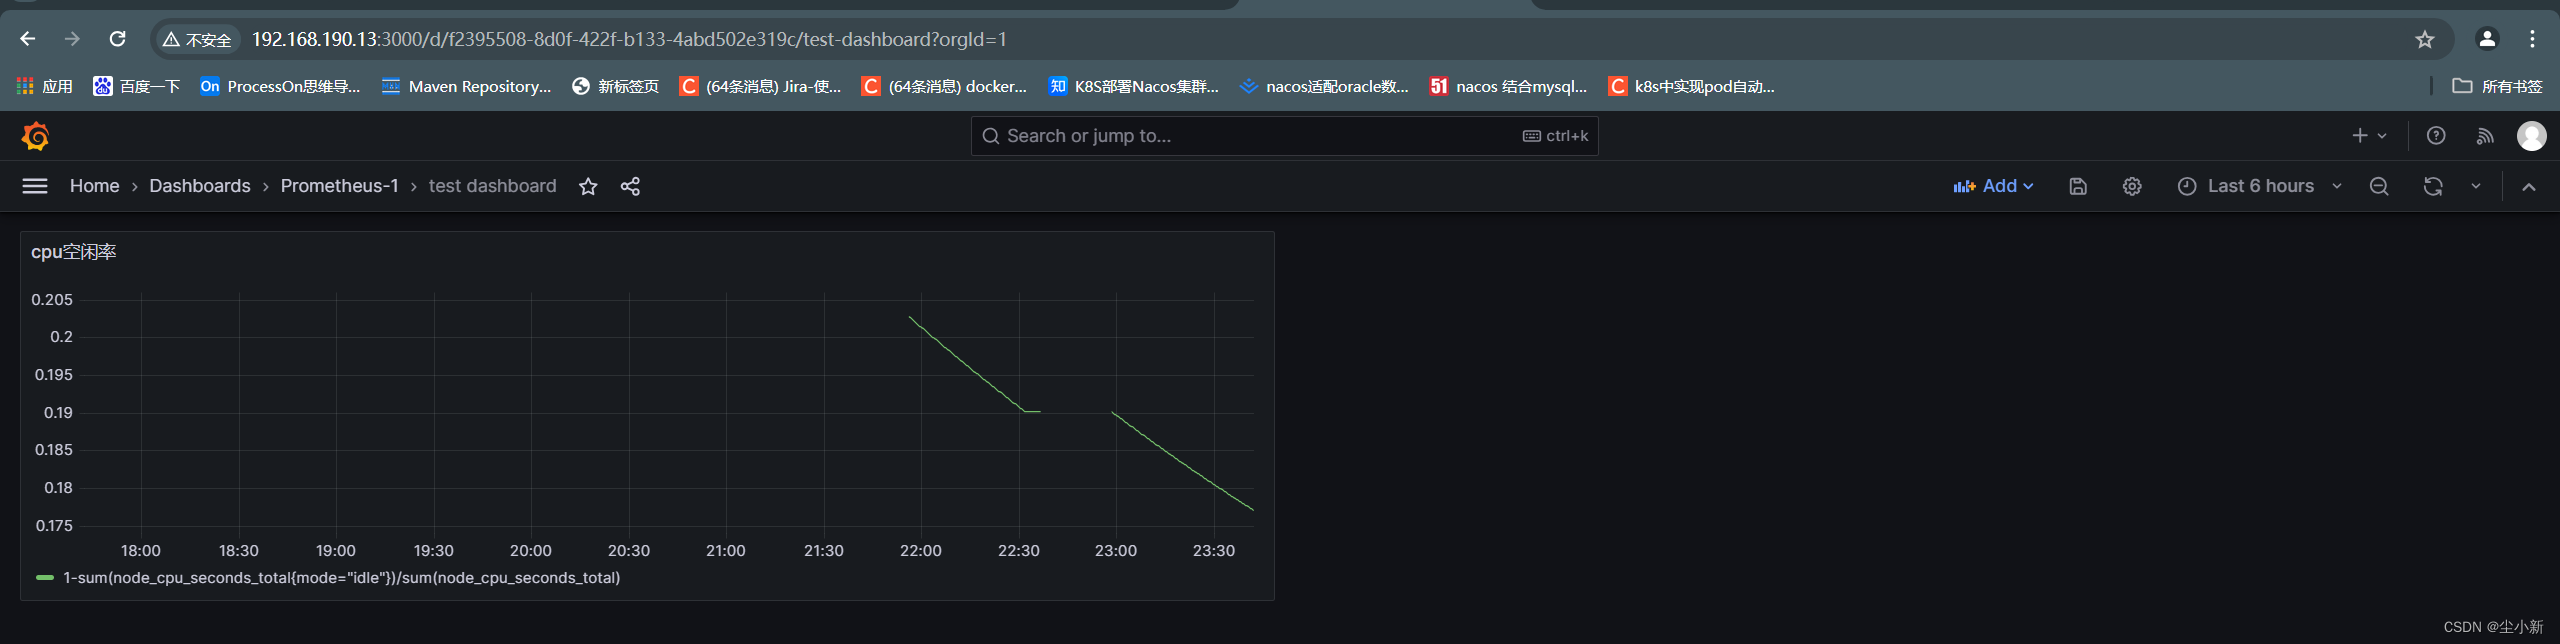
· 回到自己的dashboard列表点进去查看
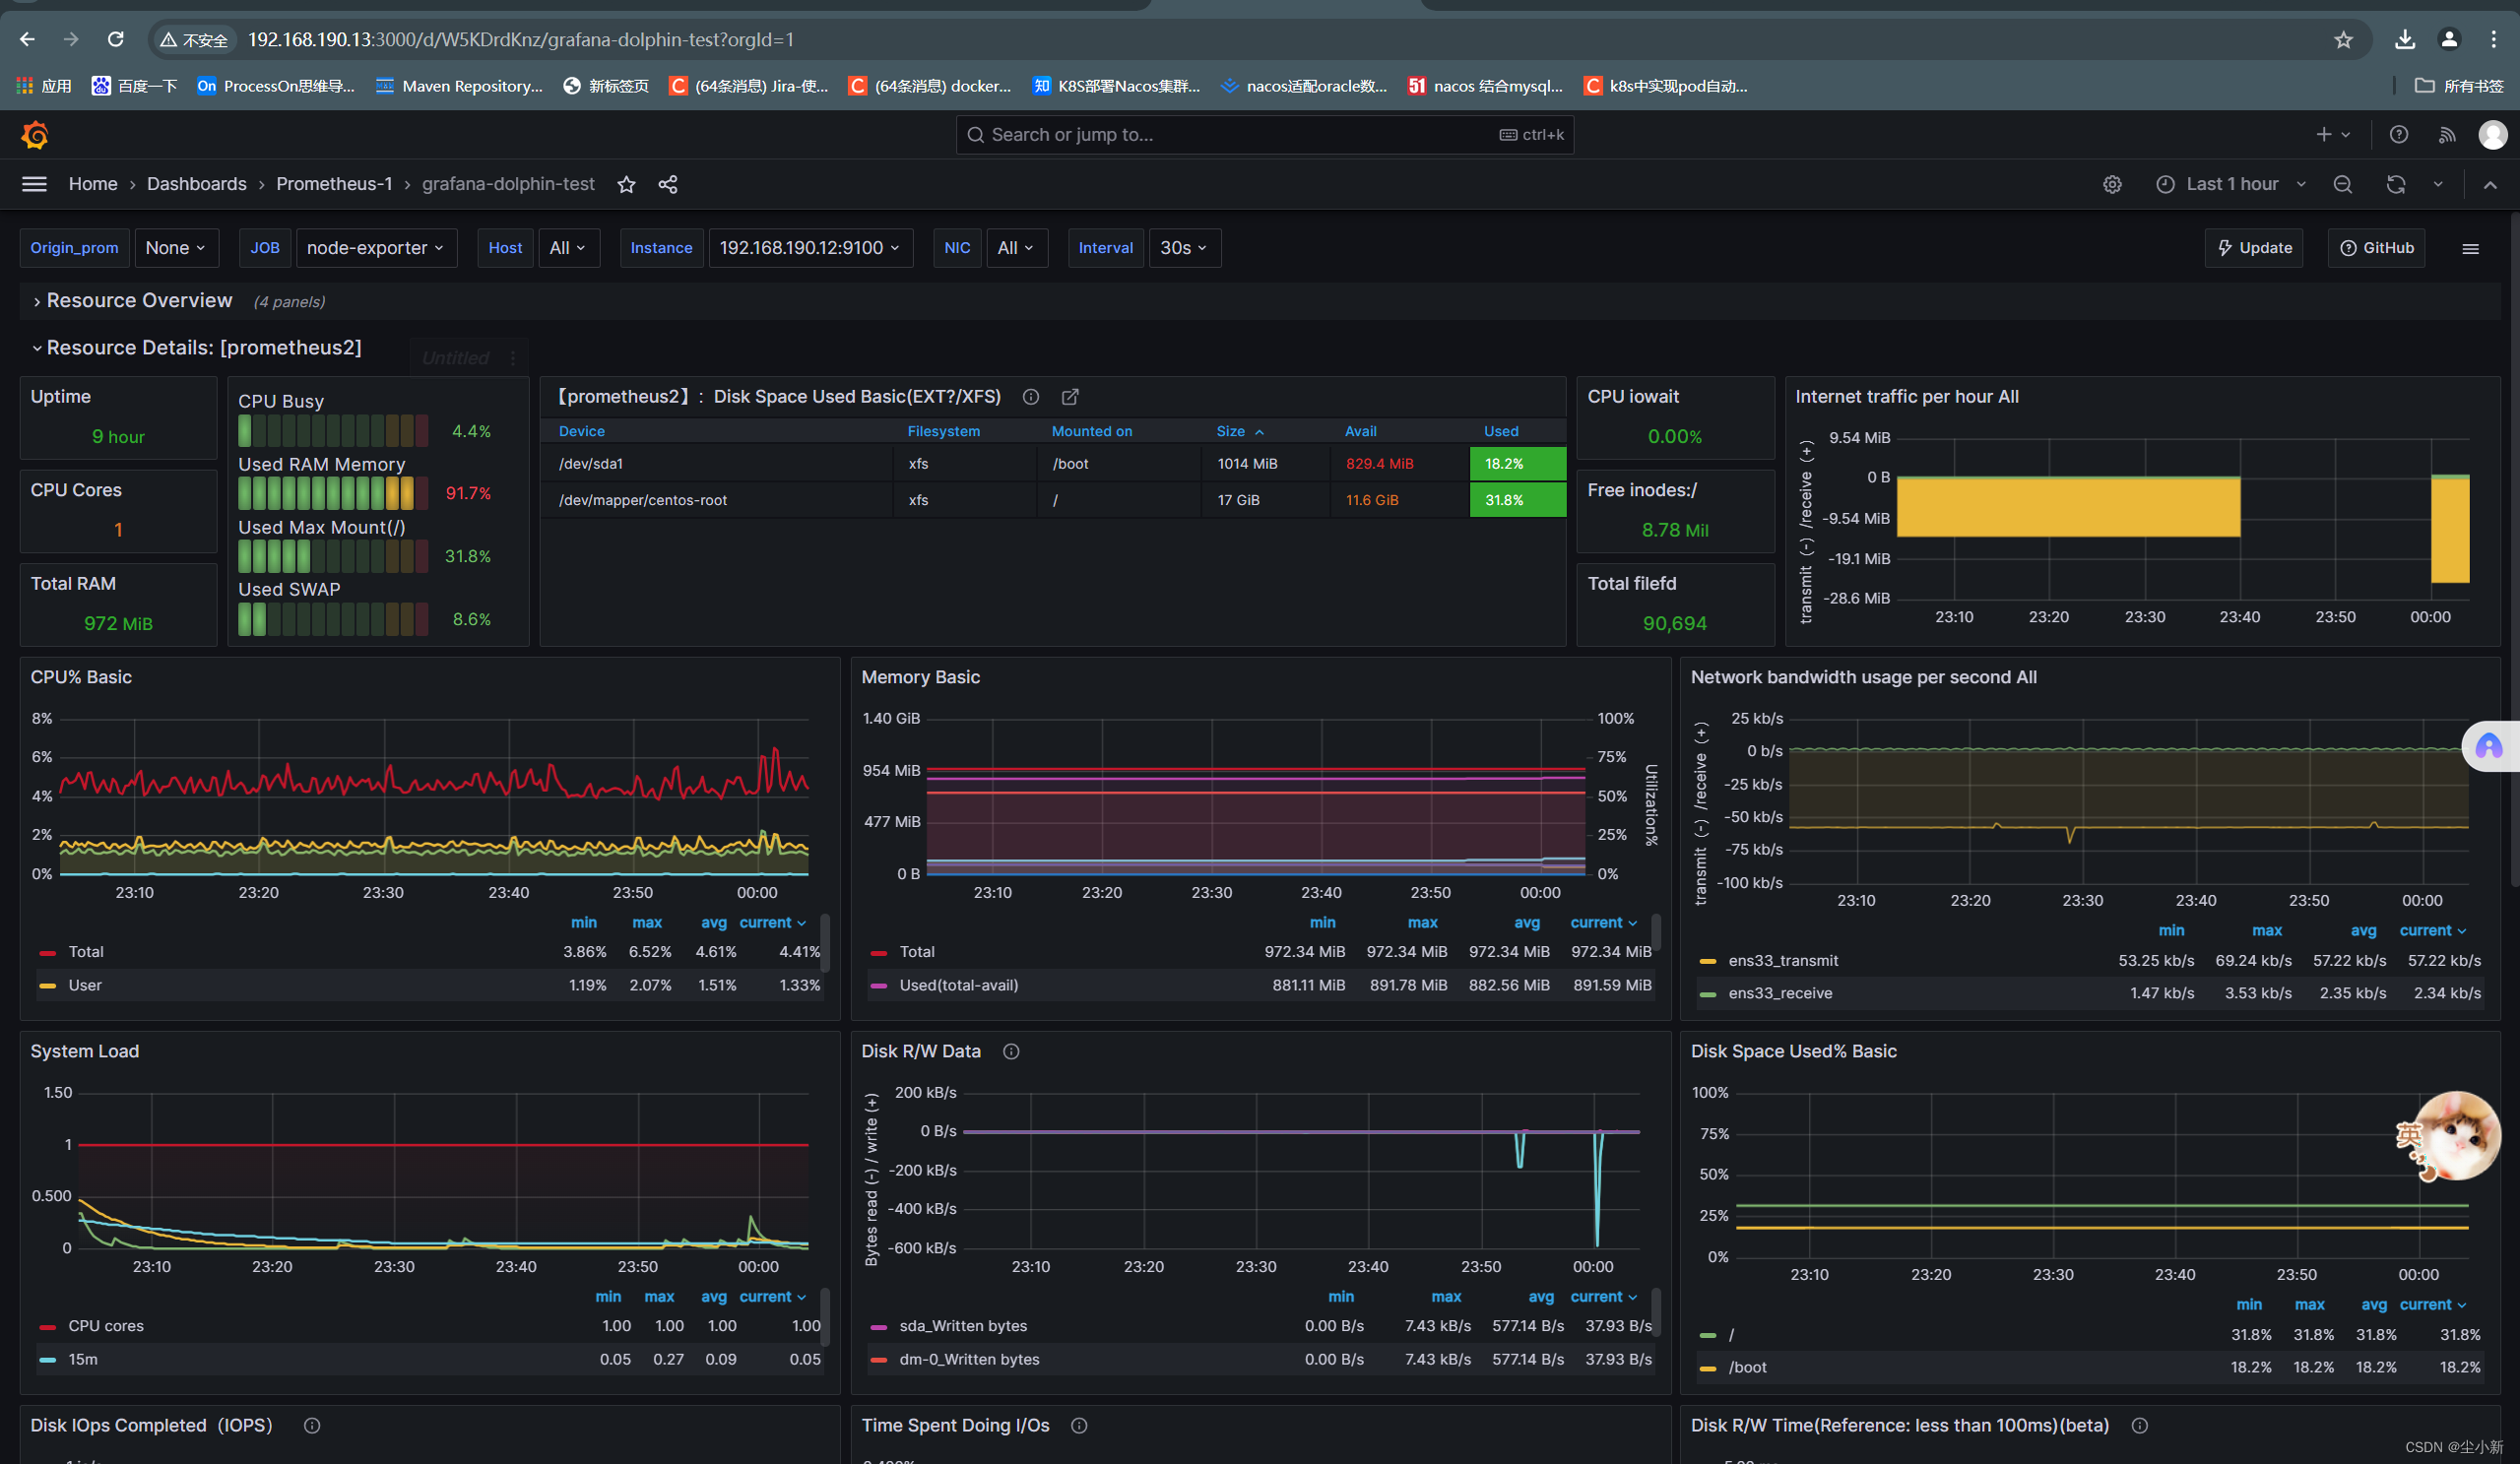
至此,我们的服务器节点监控,学习完毕。


 6787
6787

 被折叠的 条评论
为什么被折叠?
被折叠的 条评论
为什么被折叠?
 到【灌水乐园】发言


