


写在前面
虽然微生信生物写过许多的东西,但是确实做好很细心,很认真,并且考虑到大家的运行环境的教程并不多,随着我的成长,这些方面的东西,也慢慢在大家的反馈中得到了注意,并逐渐提高。比如今天这篇:有的话请留言,会有人运行不出来吗?
月牙
虽然ggpot中支出20多种电点形状,但是却没有这样一个点向月亮一样引人注目,今天这个包来了,为了让我们都的图形像月亮一样引人注目。
实战
安装载入依赖R包
#--下载安装包#----
install.packages("gggibbous")

#-载入包#——-------
library(gggibbous)
library(ggplot2)
构造数据 基本月牙绘制
#> Loading required package: ggplot2
dat <- data.frame(x = 1:5, y = 1, size = 2^(0:4))

dat
#----使用geom_moon函数绘制月牙
ggplot(data = dat, aes(x, y, size = size)) +
  geom_moon()
———-图

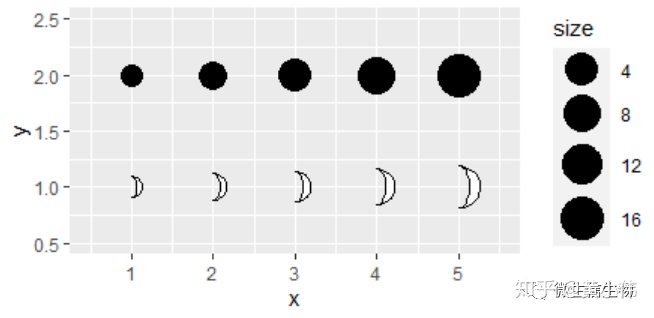
下面我们比对一下moom和geom_point的大小关系
#--对比月牙和普通原点的大小关系#---
ggplot(data = dat, aes(x, y, size = size)) +
  geom_moon() +
  geom_point(y = 2) +
  lims(x = c(0.5, 5.5), y = c(0.5, 2.5)) +
  scale_size(range = c(5, 10))
图
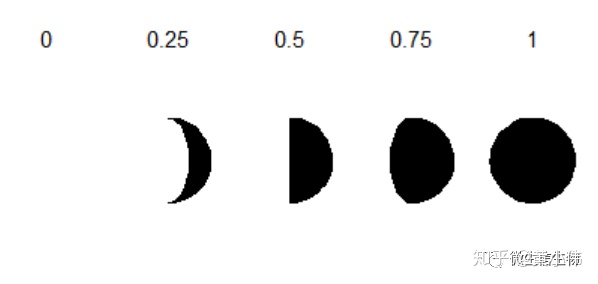
填充不同的颜色
#------设置填充为黑色#-------
dat = data.frame(x = 1:5, y = 0, ratio = 0:4 * 0.25)
dat
ggplot(data = dat, aes(x = x, y = y)) +
  geom_moon(aes(ratio = ratio), size = 20, fill = "black") +
  geom_text(aes(y = y + 1, label = ratio)) +
  lims(x = c(0.5, 5.5), y = c(-1, 1.4)) +
  theme_void()
图
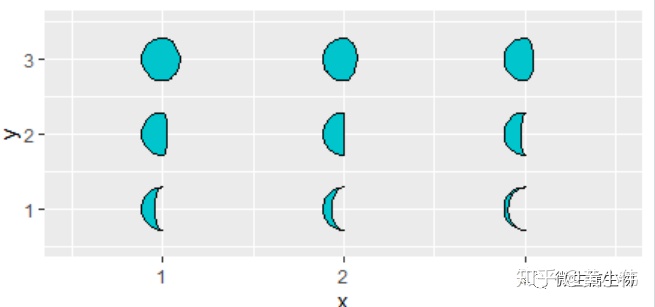
如何绘制不同方向的月牙
key_glyph:参数,默认朝左
tidymoons <- data.frame(
x = rep(1:3, 6),
y = rep(rep(3:1, each = 3), 2),
ratio = c(1:9 / 10, 9:1 / 10),
right = rep(c(TRUE, FALSE), each = 9)
)

##--如何话朝向右边的月牙#-------
ggplot() +
  geom_moon(
    data = subset(tidymoons, !right),aes(x, y, ratio = ratio, right = right), fill = "turquoise3",
    key_glyph = draw_key_moon_left
  ) +
  lims(x = c(0.5, 3.5), y = c(0.5, 3.5))
图
对月牙两个部分都进行填充
#-如何设置左右两个部分的颜色#-----------

ggplot(tidymoons) +
  geom_moon(aes(x, y, ratio = ratio, right = right, fill = right)) +
  lims(x = c(0.5, 3.5), y = c(0.5, 3.5))

#------左右颜色,同时映射大小#-------

ggplot(tidymoons, aes(x, y, ratio = ratio, right = right, size = 2^x)) +
  geom_moon(data = subset(tidymoons, right), fill = "violetred") +
  geom_moon(
    data = subset(tidymoons, !right), fill = "turquoise3",
    key_glyph = draw_key_moon_left
  ) +
  lims(x = c(0.5, 3.5), y = c(0.5, 3.5)) +
  scale_size("size", range = c(5, 10), breaks = 2^(1:3))
图

ggplot(tidymoons) +
  geom_moon(
    aes(x, y, ratio = ratio, right = right, fill = right, size = 2^x),
    key_glyph = draw_key_full_moon
  ) +
  lims(x = c(0.5, 3.5), y = c(0.5, 3.5)) +
  scale_size("size", range = c(5, 10), breaks = 2^(1:3)) +
  scale_fill_manual(values = c("firebrick1", "dodgerblue2")) +
  theme(legend.box = "horizontal")
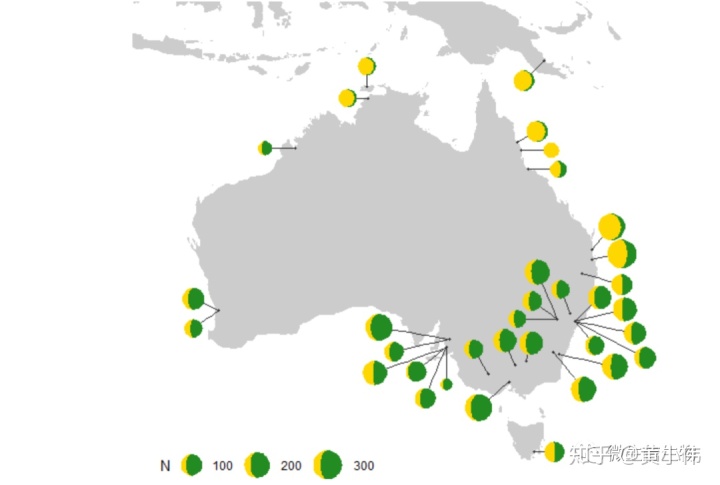
在不同图形中叠加使用moon
这一点作为gplot对象来讲,已经不奇怪了,下面是例子
#---作为多对象同地图结合

dmeladh_adj <- dmeladh
dmeladh_adj$long <- dmeladh$Longitude + c(
  -2, 0, -2, 2, -3, 3, 3, 2, 3, 4, -2.5, -2.5, -1, -2, -2.5, -4, 2.5,
  5, 6, 7, 2, -7, -5.5, -3, 0, -7, -2, 3, 5.5, 0.5, -1, -1.5, -3, 2)
dmeladh_adj$lat <- dmeladh$Latitude + c(
  -2, 2, 0, 1, 0, 0, 0, 2, 0.5, -1, 1, -1.5, 2, 4, 1.5, 0, 2,
  1, -1, -3, -2, 1, -1, -2, -3, -2, -4, -3, -1, 1.5, 2, 2, -2, 0)

moonmap <- ggplot(dmeladh_adj, aes(long, lat)) +
  geom_polygon(
    data = map_data(
      "world", region = "(Australia)|(Indonesia)|(Papua New Guinea)"),
    aes(group = group),
    fill = "gray80"
  ) +
  geom_segment(aes(xend = Longitude, yend = Latitude), color = "gray20") +
  geom_point(aes(Longitude, Latitude), size = 0.75, color = "gray20") +
  scale_size(range = c(4, 10)) +
  coord_map(xlim = c(110, 160), ylim = c(-45, -5)) +
  theme_void() +
  theme(
    legend.position = c(0.05, 0.05),
    legend.direction = "horizontal",
    legend.justification = c(0, 0)
  )

moonmap +
  geom_moon(
    aes(ratio = AdhS / 100, size = N),
    right = FALSE, fill = "gold", color = "gold",
    key_glyph = draw_key_moon_left
  ) +
  geom_moon(
    aes(ratio = AdhF / 100, size = N),
    fill = "forestgreen", color = "forestgreen"
  )
图
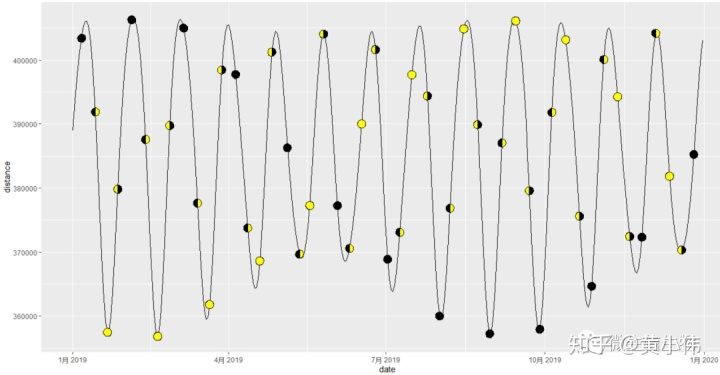
叠加,月牙点线图
moonphase <- subset(lunardist, !is.na(phase))
moonphase$percent <- ifelse(
  moonphase$phase == "new", 0, ifelse(moonphase$phase == "full", 1, 0.5))

ggplot(lunardist, aes(date, distance)) +
  geom_line() +
  # Plotting the lower layer as a full circle also works in most cases
  geom_moon(data = moonphase, ratio = 1, size = 5, fill = "black") +
  geom_moon(
    data = moonphase, aes(ratio = percent),
    size = 5, fill = "yellow", right = moonphase$phase == "first quarter"
  )
图
添加主编微信 加入群聊


 1万+
1万+


 被折叠的 条评论
为什么被折叠?
被折叠的 条评论
为什么被折叠?
 到【灌水乐园】发言


