


本文章基于wepy编写
(1)问题描述:
微信小程序用echarts画统计图;在微信调试工具中,无问题;真机上出现统计图浮在底部自定义tabbar上,并且小程序中使用的第三方dropmenu的遮盖层也无法遮挡;安卓机上tabbar可点击,ios上tabbar不可点击。
(2)解决方法:
将canvas转换成图片
(3)具体实现:
封装一个生成柱状图组件
1.首先按照echats文档,生成柱状图,部分代码如下所示
// echart标签
<ec-canvas class="chart" canvas-id="{{canvasId}}" ec="{{ ec }}" bind:init="echartInit"></ec-canvas>
//data中定义ec对象
data = {
 ec: {},
 }
// 初始化时调用函数
echartInit(e) {
    this.initChart(e.detail.canvas, e.detail.width, e.detail.height)
  }
initChart(canvas, width, height) {
      const chart = echarts.init(canvas, null, {
        width: width,
        height: height
      })
      canvas.setChart(chart)
      const option = {....}
      chart.setOption(option)
      return chart
}
2.将生成的柱状图转化为图片
调用微信的wx.canvasToTempFilePath方法,该方法需要传入canvasId,最初我直接传入的ec-canvas中我写入的canvasId,wx.canvasToTempFilePath方法始终fail,原生的canvas直接传canvasId可正确生成。
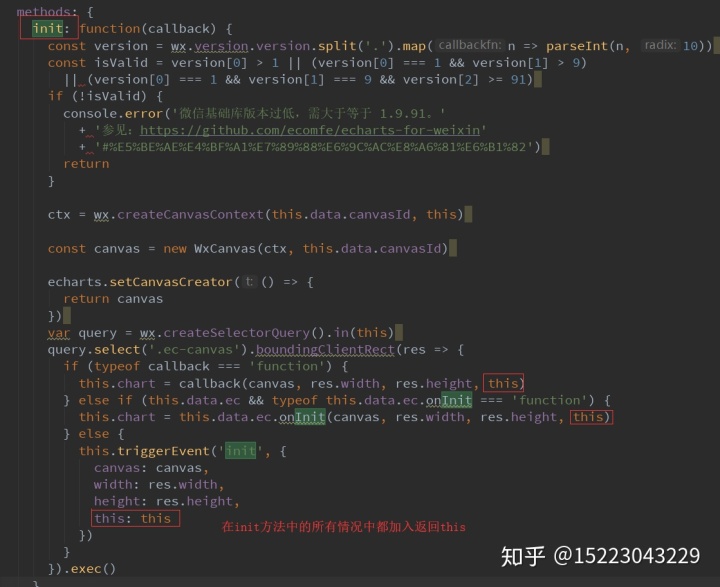
个人理解:wx.canvasToTempFilePath中需要的canvasId是canvas中的this,因为echarts是二次封装过的,所以,我们需要去echarts封装的源文件中将this暴露出来。
找到,你项目中导入的echarts的ec-canvas.js文件,修改init方法,在所有返回结果中,加上返回this,如下图
然后在data中定以一个变量接收echarts暴露出来的this
 data = {
      ec: {},
      radarImg: '', // 保存转换后的图片地址
      canvasThis: null //保存生成canvas的this
    }
在ec-cavas的init调用的echartInit方法中获取this
async echartInit(e) {
        this.canvasThis = e.detail.this
        await this.initChart(e.detail.canvas, e.detail.width, e.detail.height)
        // 初始化时,便生成图片
        if (this.toImg) {
          this.saveCanvasImg(this.canvasThis)
        }
      }
saveCanvasImg(e) {
      wx.canvasToTempFilePath({
        x: 0,
        y: 0,
        canvasId: this.canvasId,
        success: (res) => {
          this.radarImg = res.tempFilePath
          this.$apply()
        },
        fail(p) {
          console.log('p', p)
        }
      }, e)
    }
由于我的项目中,需要选择时间重新绘图,我还提供了重新生成canvas的方法
events= {
      'saveCanvasImg': async (type) => {
        // 判断要生成canvas还是生成img
        if (type === 'canvas') {
          this.radarImg = ''
        } else {
          this.saveCanvasImg(this.canvasThis)
        }
      }
    }
父组件中需要生成canvas时调用this.$broadcast('saveCanvasImg', 'canvas')
封装的echarts柱状图完整代码:
<!--
组件使用

 父组件传值:
 import组件-》注册组件
 <barChart :chartData="barChartData"></barChart>
 'width'、'height',可父组件传值设置,类型为string,带单位
 barChartData: {
        xAxis: ['Mon', 'Tue', 'Wed', 'Thu', 'Fri', 'Sat', 'Sun'],
        series: [120, 200, 150, 80, 70, 110, 130]
      }
-->

<style lang="less">
  .bar__chart {
    margin: 0 auto;
  }
</style>
<template>
  <view class="page">
    <view wx:if="{{!radarImg}}" class="bar__chart" style="width:{{ width }};height: {{height}};background-color: {{color}}">
      <ec-canvas class="chart" canvas-id="{{canvasId}}" ec="{{ ec }}" bind:init="echartInit"></ec-canvas>
    </view>
    <view wx:else class="bar__chart">
      <image src="{{radarImg}}" class="bar__chart" style="width:{{ width }};height: {{height}};background-color: {{color}}"></image>
    </view>
  </view>
</template>

<script>
  import wepy from 'wepy'
  import echarts from '../ec-canvas/echarts.js'

  export default class BarChart extends wepy.component {
    config = {
      navigationBarTitleText: 'BarChart',
      usingComponents: {
      }
    }

    components = {}

    props = {
      width: {
        type: String,
        default: '100%'
      },
      height: {
        type: String,
        default: '355rpx'
      },
      color: {
        type: String,
        default: '#fff'
      },
      canvasId: {
        type: String,
        default: 'mychart-bar'
      },
      chartData: {
        type: Object,
        default: () => {
          return {}
        }
      },
      toImg: { // 父组件是否需要初始化时将canvas转为图片
        type: Boolean,
        default: false
      }
    }

    data = {
      ec: {},
      radarImg: '', // 保存转换后的图片地址
      canvasThis: null //保存生成canvas的this
    }

    computed = {}

    methods = {
      async echartInit(e) {
        this.canvasThis = e.detail.this
        await this.initChart(e.detail.canvas, e.detail.width, e.detail.height)
        if (this.toImg) {
          this.saveCanvasImg(this.canvasThis)
        }
      }
    }

    saveCanvasImg(e) {
      wx.canvasToTempFilePath({
        x: 0,
        y: 0,
        canvasId: this.canvasId,
        success: (res) => {
          this.radarImg = res.tempFilePath
          this.$apply()
        },
        fail(p) {
          console.log('p', p)
        }
      }, e)
    }

    initChart(canvas, width, height) {
      const chart = echarts.init(canvas, null, {
        width: width,
        height: height
      })
      canvas.setChart(chart)
      // option配置
      const option = {
        grid: {
          top: 30,
          left: '2%',
          right: '2%',
          bottom: '3%',
          containLabel: true
        },
        xAxis: {
          type: 'category',
          axisTick: {
            show: false
          },
          axisLine: {
            show: false
          },
          axisLabel: {
            interval: 0,
            textStyle: {
              color: '#a8a8a8'
            }
          },
          data: this.chartData.xAxis
        },
        yAxis: {
          type: 'value',
          axisTick: {
            show: false
          },
          axisLine: {
            show: false
          },
          splitLine: {
            lineStyle: {
              color: '#eee'
            }
          },
          axisLabel: {
            textStyle: {
              color: '#a8a8a8'
            }
          }
        },
        series: [{
          animation: false,
          itemStyle: {
            normal: {
              color: new echarts.graphic.LinearGradient(
                0, 0, 0, 1,
                [
                  {offset: 1, color: 'rgba(0,111,255,0.6)'},
                  {offset: 0, color: 'rgba(163,203,255,0.6)'}
                ]
              )
            },
            emphasis: {
              color: new echarts.graphic.LinearGradient(
                0, 0, 0, 1,
                [
                  {offset: 0, color: '#2378f7'},
                  {offset: 0.7, color: '#2378f7'},
                  {offset: 1, color: '#83bff6'}
                ]
              )
            }
          },
          label: {
            normal: {
              show: true,
              // rotate: 90,
              formatter: '{c}',
              fontSize: 12,
              color: '#fff'
            }
          },
          data: this.chartData.series,
          type: 'bar',
          barWidth: '50%'
        }]
      }

      chart.setOption(option, true)
      return chart
    }

    events= {
      'saveCanvasImg': async (type) => {
        // 判断要生成canvas还是生成img
        if (type === 'canvas') {
          this.radarImg = ''
        } else {
          this.saveCanvasImg(this.canvasThis)
        }
      }
    }

    onLoad() {
    }
  }
</script>
父组件引用样式
        // 柱状图组件使用
        <barChart
          wx:if="{{ staffAttendance.series && staffAttendance.series.length }}"
          :chartData.sync="staffAttendance"
          :toImg.sync="toImg"
        >
        </barChart>

        // 时间选择
        <picker mode="date" value="{{start_date}}"
                @change="handleChange">

// 引入组件
  import BarChart from '../components/public/barChart'
// 定义组件
  components = {
    barChart: BarChart
  }
  data = {
    toImg: true,
    studentAttendance: {},
  }
父组件中调用样例:
// 改变时间时调用函数
handleChange(e) {
      // 将需要生成图的数据置空,不然柱状图组件数据不响应改变
      this.studentAttendance = {}
      this.$apply()
      this.selfAttendance()
    }

  async selfAttendance () {
    // 先将图片转化成canvas
    this.$broadcast('saveCanvasImg', 'canvas')
    // todo 调用接口获取生成统计图数据
    const res = await selfAttendance()
    if (res) {
      this.studentAttendance.xAxis = res.statistics.map(item => {
        return attendanceStatusFil[item.status]
      })
      this.studentAttendance.series = res.statistics.map(item => {
        return item.num
      })
    }
    wx.stopPullDownRefresh()
    this.$apply()
  }


 1301
1301


 被折叠的 条评论
为什么被折叠?
被折叠的 条评论
为什么被折叠?
 到【灌水乐园】发言


