 ECharts多Y轴与图例联动实现


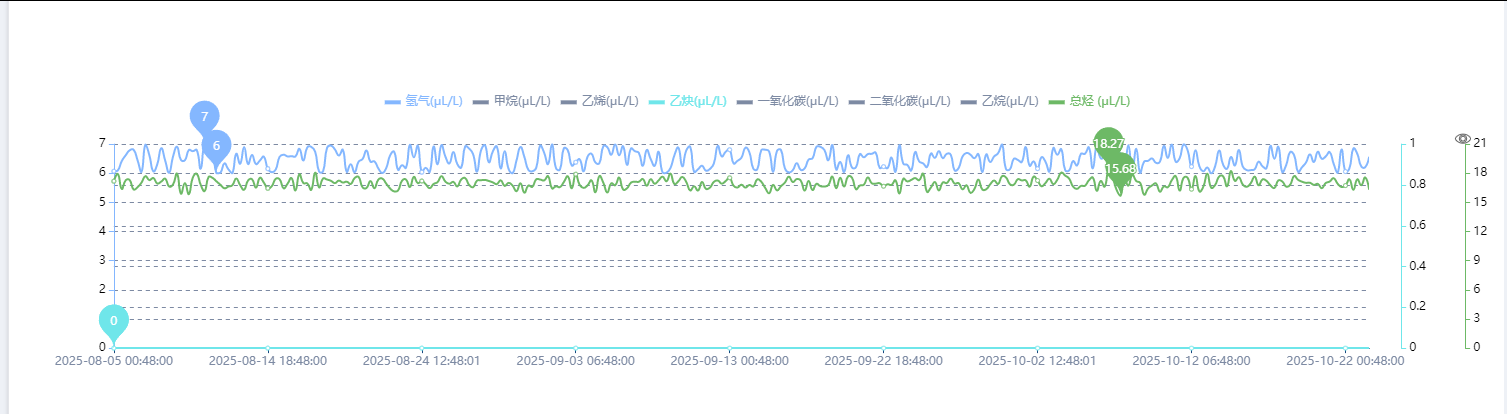
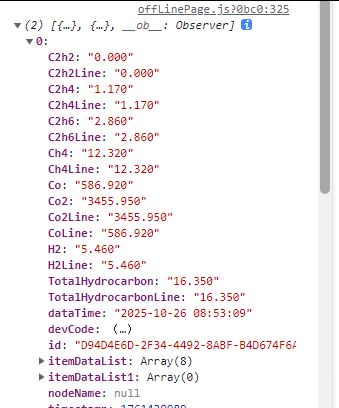
折线图数据格式
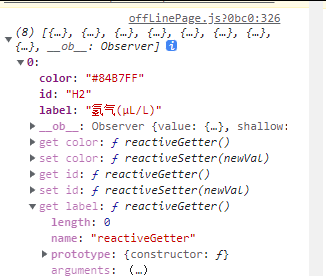
组装legend数据格式
<template>
<div id="YCechart" ref="YCechart"></div>
</template>
<script>
import service from "@/utils/service";
import { tr } from "date-fns/locale";
export default {
props: {
ListChart: {
type: Array,
default: () => [],
},
tableHeader: {
type: Array,
default: () => [],
},
selectedData: {
type: Array,
default: () => [],
},
},
data() {
return {
getchart: null,
legend: [],
xData: [],
yAxisData:[],
series: [],
colorAchart:[],
};
},
watch: {
ListChart: {
handler(val, oldVal) {
this.legend = [];
this.xData = [];
this.series = [];
this.yAxisData = [];
let tableHeader = this.tableHeader;
let listData = val;
if (tableHeader && tableHeader.length > 0) {
for (var i = 0; i < tableHeader.length; i++) {
this.legend.push({
name:tableHeader[i]["label"],
id:tableHeader[i]["id"]
});
this.colorAchart.push(tableHeader[i]["color"]);
let ayy0 = [];
if (listData && listData.length > 0) {
for (var j = 0; j < listData.length; j++) {
ayy0.push(listData[j][tableHeader[i]["id"]]);
}
}
//组装多y轴
let iRecord = i
let yBase = iRecord > 1 ? parseInt(iRecord / 2) : 0
let yAxis = {
//name: tableHeader[i]["label"],
id:tableHeader[i]["id"],
type: 'value',
axisLine: {
show: false,
lineStyle:{
color:tableHeader[i]["color"]
}
},
position: iRecord % 2 == 0 ? 'left' : 'right',
//水平线
splitLine: {
show: true,
lineStyle: {
type: "dashed",
color: "#7D8AA3",
},
},
}
this.yAxisData.push(yAxis)
this.series.push({
name: tableHeader[i]["label"],
type: "line",
smooth: true,
yAxisIndex: i,
itemStyle: {
color: tableHeader[i]["color"],
},
markPoint: {
// 设置最大值和最小值
data: [
{
type: "max",
name: "我是最大值",
},
{
type: "min",
name: "我是最小值",
},
],
},
data: ayy0,
});
}
if (listData && listData.length > 0) {
for (var k = 0; k < listData.length; k++) {
this.xData.push(listData[k]["dataTime"]);
}
}
this.$nextTick(() => {
this.initChart(this.legend, this.xData,this.yAxisData, this.series);
});
} else {
this.$nextTick(() => {
this.initChart([], [], []);
});
}
},
deep: true, // 深度监听
immediate: true, //初始化监听
},
},
created(){
},
mounted() {
},
methods: {
convertToKeyValueArray(obj) {
return Object.entries(obj).map(([name, id]) => ({ name,id}));
},
initChart(legend, xData,yAxisData, series) {
let ljson={}
for(let i=0;i<legend.length;i++){
legend[i].textStyle={
color:this.colorAchart[i]
}
if(legend[i].name.indexOf("乙炔")!=-1||legend[i].name.indexOf("总烃")!=-1||legend[i].name.indexOf("氢气")!=-1){
ljson[legend[i].name]=true;
legend[i]['default']=true//在初始化是显示y轴会用来做判断,显示或者不显示问题
}else{
ljson[legend[i].name]=false
legend[i]['default']=false
}
}
this.getchart = this.$echarts.init(this.$refs.YCechart);
let option = {
color: this.colorAchart,
tooltip: {
trigger: "axis",
},
dataZoom:
{
type: 'inside',
show:true
},
toolbox: {
right:30,
top:"15%",
feature: {
myFull: {
show: true,
title: "全屏查看",
iconStyle:{
color:"white"
},
icon:
"path://M432.45,595.444c0,2.177-4.661,6.82-11.305,6.82c-6.475,0-11.306-4.567-11.306-6.82s4.852-6.812,11.306-6.812C427.841,588.632,432.452,593.191,432.45,595.444L432.45,595.444z M421.155,589.876c-3.009,0-5.448,2.495-5.448,5.572s2.439,5.572,5.448,5.572c3.01,0,5.449-2.495,5.449-5.572C426.604,592.371,424.165,589.876,421.155,589.876L421.155,589.876z M421.146,591.891c-1.916,0-3.47,1.589-3.47,3.549c0,1.959,1.554,3.548,3.47,3.548s3.469-1.589,3.469-3.548C424.614,593.479,423.062,591.891,421.146,591.891L421.146,591.891zM421.146,591.891",
onclick: () => {
this.fullFlag = true;
let element = this.$refs.YCechart;
// 一些浏览器的兼容性
if (element.requestFullScreen) {
// HTML W3C 提议
element.requestFullScreen();
} else if (element.msRequestFullscreen) {
// IE11
element.msRequestFullScreen();
} else if (element.webkitRequestFullScreen) {
// Webkit (works in Safari5.1 and Chrome 15)
element.webkitRequestFullScreen();
} else if (element.mozRequestFullScreen) {
// Firefox (works in nightly)
element.mozRequestFullScreen();
}
// 退出全屏
if (element.requestFullScreen) {
document.exitFullscreen();
} else if (element.msRequestFullScreen) {
document.msExitFullscreen();
} else if (element.webkitRequestFullScreen) {
document.webkitCancelFullScreen();
} else if (element.mozRequestFullScreen) {
document.mozCancelFullScreen();
}
},
},
},
},
legend: {
top: "3%",
data: legend,
selected:ljson,
icon: "rect",
itemHeight: 4,
itemWidth: 16,
inactiveColor: '#7D8AA3',
textStyle: {
color: "#7D8AA3",
//fontsize: 25,
},
},
grid: {
//调整图表上下左右位置
left: "5%",
right: "4%",
bottom: "8%",
top: "20%",
containLabel: true,
},
xAxis: {
type: "category",
boundaryGap: false,
data: xData,
axisLine: {
//坐标轴轴线相关设置。数学上的x轴
show: true,
lineStyle: {
color: "#184980",
},
},
axisLabel: {
//坐标轴刻度标签的相关设置
textStyle: {
color: "#7D8AA3",
margin: 15,
},
},
},
yAxis: yAxisData,
series: series,
};
let that = this
for(let i=0;i<option.yAxis.length;i++){
option.yAxis[i].axisLabel={
textStyle:{
color:'trab'
}
}
}
this.getchart.setOption(option, true);
let _optionXColo = that.getchart.getOption();
var ii = 0
_optionXColo.color.forEach(function (item, index) {
for (let i = 0; i <_optionXColo['legend'][0]['data'].length; i++) {
if(_optionXColo['legend'][0]['data'][i]['id']==_optionXColo.yAxis[index]?.['id']&&_optionXColo['legend'][0]['data'][i]['default']){
_optionXColo.yAxis[index].axisLine.show = true
}
}
if(_optionXColo.yAxis[index]){
_optionXColo.yAxis[index].offset = (ii > 1 ? parseInt(ii / 2) : 0) * 32;
_optionXColo.yAxis[index].position = ii % 2 == 0 ? 'left' : 'right'
}
ii++
})
_optionXColo.grid[0].right = '6%'
_optionXColo.grid[0].left = '6%'
this.getchart.setOption(_optionXColo, true)
//随着屏幕大小调节图表
window.addEventListener("resize", () => {
this.getchart.resize();
});
this.getchart.on('legendselectchanged', function (obj) {
var _option = that.getchart.getOption()
var ii = 0
Object.values(obj.selected).forEach(function (item, index) {
if (_option.yAxis[index]) {
_option.yAxis[index].axisLine.show = item
}
if (item) {
_option.yAxis[index].offset = (ii > 1 ? parseInt(ii / 2) : 0) * 32
_option.yAxis[index].position = ii % 2 == 0 ? 'left' : 'right'
ii++
}
})
_option.grid[0].right = '2%'
_option.grid[0].left = '2%'
console.log(_option)
that.getchart.setOption(_option, true)
})
},
},
};
</script>
<style scoped>
#YCechart {
height: 100%;
width: 100%;
}
</style>


 被折叠的 条评论
为什么被折叠?
被折叠的 条评论
为什么被折叠?
 到【灌水乐园】发言


