


3 Nagios 监控服务器
3.1 Nagios 介绍
Nagios是一款开源的免费网络监视工具,能有效监控Windows、Linux和Unix的主机状态,交换机路由器等网络设备,打印机等。在系统或服务状态异常时发出邮件或短信报警第一时间通知网站运维人员,在状态恢复后发出正常的邮件或短信通知。
- nagios是一款开源的免费网络监视工具,能有效监控Windows、linux和Unix的状态,交换机以及路由器等网络设置。系统或者服务发生异常时,可以第一时间通知运维人员。
- 它的功能是监控主机与服务,其实它依靠的是众多插件来完成监控与监测功能。
- Nagios软件需要安装在一台独立的服务器上运行,这台服务器称为监控中心,这个监控中心服务器可以采用Linux或者Unix操作系统。每一台需要监视的主机或者服务都运行一个与监控中心服务器进行通信的Nagios软件后台程序。监控中心服务器根据读取配置文件中的指令与远程的守护程序进行通信,并且指示远程的守护程序进行必要的检查。
- 虽然nagios软件必须在Linux或者Unix操作系统上运行,但是,远程被监控的机器可以是任何能够与其进行通信的主机。根据远程主机返回的应答,Nagios将根据配置以合适的行动进行回应。接着,Nagios将通过本地的机器进行测试。如果检查返回的值不正确,Nagios将通过一种或者多种方式报警。这也是根据事先的配置而采取的行动。
3.1.0 Nagios 功能介绍
Nagios 是采用分布-集中的管理模式。在Nagios服务器上安装Nagios 主程序和插件程序,在被监控主机上安装Nagios 代理程序。通过Nagios 主程序和Nagios 代理程序之间的通讯,监视对象的状态。
- 监控网络服务,如:SMTP、POP3、FTP、HTTP、NNTP、PING 等。
- 监控主机资源,如:CPU 负荷、磁盘使用率、进程和服务是否存活等。
- 允许用户开发简单的自己需要的检查服务,支持很多开发语言(shell scripts、C++、Perl、ruby、Python、PHP、C#等),可以指定自己编写的Plugin通过网络收集数据来监控任何情况(温度、警告……)
- 可以通过配置Nagios远程执行插件远程执行脚本,事先定义事件处理程序, 当对象出现问题时,自动调用对应的处理程序;
- 具备定义网络分层结构的能力,用“parent”主机定义来表达网络主机间的关系,这种关系可被用来发现和明晰主机宕机或不可达状态。
- 当服务或主机问题产生与解决时可通过 EMail、短信、其他用户自定义方式将告警信息发送给运维人员。
- 具备定义事件句柄功能,它可以在主机或服务的事件发生时获取更多问题定位。
- 拥有 WEB 界面,用于查看当前的网络状态、通知和故障历史、日志文件等。
3.1.1 监控服务器Cacti - Nagios 对比
Cacti
- 收集数据、图形展示
- 偏重网络流量
- SNMP、OID、SNMP Agent
Cacti 会将我们保存时间类的所有的图片都会保存下来,默认是一个月。
Nagios
- 偏重主机、服务的当前状态
- Agent
- 脚本
nagios的四种监控状态,Nagios可以识别四种状态返回信息。
- (OK) 表示当前主机处于状态正常(绿色显示);
- (WARNING) 表示出现警告级别(×××),例如当CPU的利用率达到85%的时候,就可以通知管理员进行相应的处理;
- (CRITICAL) 表示出现非常严重错误(红色),例如当CPU的利用率达到95%的时候,就要通知管理员马上处理;
- (UNKNOWN) 表示未知错误(深×××),nagios根据插件返回来的值来判断监控对象的状态,并通过web显示出来,以供管理员即时发现故障;

拓展:
Cacti 是可以完成需求查找之前15天的监控数据的,但是如果服务出现中断故障,那么Cacti 其实并不会太友好的通知管理员,服务器的存活状态。
Nagios 主要监控主机和服务端状态是否可用,而不会告诉管理员该主机5天之前的监控数据,Nagios 只会展示当前的主机和服务端的状态。Nagios是临时缓存网络数据的方案。
所以在 Zabbix 之前,企业中使用的开源监控软件,就需要Cacti 和 Nagios 两者相结合使用。
3.1.2 Nagios 监控对象类划分
- 命令(Commands)
“命令”用于定义Nagios如何执行某特定的监控工作。它是基于某特定的Nagios插件定义出的一个抽象层,通常包含一组要执行的操作。
- 时段(Time periods)
“时段”用于定义某“操作”可以执行或不能执行的日期和时间跨度,如工作日内的每天8:00-18:00等;
- 联系人和联系人组(Contacts and contact groups)
“联系人”用于定义某监控事件的通知对象、要通知的信息以及这些接收通知者何时及如何接收通知;一个或多个联系人可以定义为联系人组,而一个联系人也可以属于多个组;
联系人是监控人员或者是运维人员。联系人组是将多个联系人进行分组。
- 主机和主机组(host and host groups)
“主机”通常指某物理主机,其包括此主机相关的通知信息的接收者(即联系人)、如何及何时进行监控的定义。主机也可以分组,即主机组(host groups),一个主机可同时属于多个组;
主机的定义是必须的,主机组则是将多个主机进行分组,类似于Windows 中域的概念,集中化管理。
- 服务/资源,服务组(Services / resources and Services groups)
“服务”通常指某主机上可被监控的特定的功能或资源,其包括此服务相关的通知信息的接收者、如何及何时进行监控等。服务也可以分组,即服务组(Service groups),一个服务可同时属于多个服务组;
3.1.3 Nagios 收集数据架构图
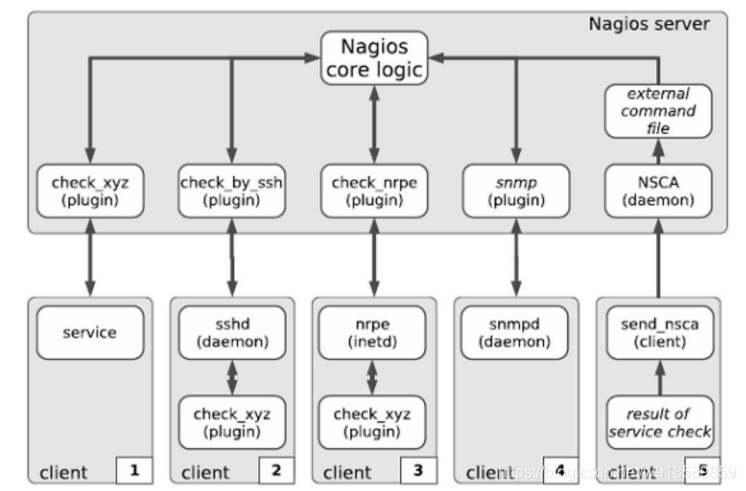
Nagios 收集数据简述:不同于Cacti 利用 SNMP 协议进行收集数据,Nagios 是通过自身的程序来实现数据的采集,调用对应的脚本,返回数据以后,传递给Nagios核心程序。Nagios 也有插件管理器(是Nagios软件自带的)Nagios 定义的脚本都是以 check_ 为前缀的,是Nagios 脚本的定义格式,一般都是这样定义。
在 Client1 中运行的Service,Nagios Server所对应插件管理器中的 check_xyz 对该服务进行检测,向Client1 要求索要数据,Client 返回数据到插件后,插件再将数据传到 Nagios 的核心来进行对应的展示。
在 类Unix/Linux中,都会启动 sshd 服务的,在Client2中运行 sshd,会发现即在Nagios Server 端有plugins,同时Client端也有plugins,当plugins 安装在客户端以后,客户端就是数据的收集方,sshd 的数据会先到 客户端的plugins,再有客户端的plugins 将数据推送到 Nagios Server 的plugins。
在 类Unix/Linux中,使用NRPE的插件(NRPE会以守护进程的方式在客户端运行),Nagios Server也是需要安装 NRPE 的脚本,脚本包含了大量的Unix/Linux中的收集数据的方案。具体的步骤在 3.1.4 监控Linux主机原理展现。简述:Nagios Sever中的 plugins 会向客户端 NRPE 发起指令,NRPE收集到数据以后,将数据返回到 Nagios Server 中的plugins,再由plugins将数据发送给Nagios 核心进行展示。客户端也有 plugins 的安装,其主要的作用是负责NRPE的完善工作。
对于一些交换机和路由器,是没有办法安装对应的脚本,所以需要使用SNMP来进行对网络设备的收集,采集数据的工作。
参考文献:[ https://blog.csdn.net/weixin_40283570/article/details/106540770 ]
3.1.4 监控Linux主机原理
Nagios 只能监测自己所在的主机,而对其他的机器则显得有点无能为力。毕竟没得到被控主机的适当权限是不可能得到这些信息的。为了解决这个问题,Nagios 有这样一个附加组件:NRPE。用它就可以完成对 linux 类型主机“本地信息”的监控。通过 NRPE 组件实现监控 LINUX 操作系统,如下监控:CPU 负载,磁盘容量,登陆用户数,总进程数,僵尸进程数,swap 分区使用情况等。
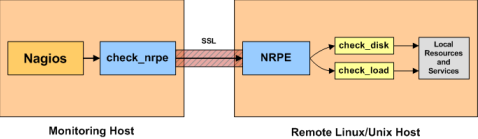
NRPE 是一个可在远程 Linux/Unix 主机上执行的插件的外部构件包。如果你需要监控远程的主机上的本地资源或属性,如磁盘利用率、CPU 负荷、内存利用率等时是很有用的。如果单纯存活、端口状态等就不需要使用NRPE。
NRPE 总共由两部分组成:
check_nrpe 插件,位于 Nagios 监控主机上。
NRPE 程序,运行在被监控机的 linux 主机上。
按照上图,当 Nagios 需要监控某个远程 linux 主机的服务或者资源情况时,整个的监控过程如下描述。
(1)启动Nagios后,它会周期性的自动调用插件去检测服务器状态,同时Nagios会维持一个队列, Nagios 执行安装在它里面的 heck_nrpe 插件,并告诉check_nrpe 去检测哪些服务;
(2)通过SSL,check_nrpe 插件会连接到远程的 NRPE daemon;
(3)NRPE 运行本地的各种插件去检测本地的服务和状态( check_disk,check_load 等) ,利用这些插件可以方便的监控很多服务状态,check_disk是检查磁盘空间的插件,check_load是检查CPU负载的,等等。每一个插件可以通过运行./check_xxx -h 来查看其使用方法和功能;
(4) NRPE 把检测的结果传给主机端的check_nrpe,check_nrpe 再把结果送到Nagios 状态队列中,所有插件返回来的状态信息都进入队列;
(5) Nagios每次都从队首开始读取信息,并进行处理后,把状态结果通过web显示出来。
3.1.4 Nagios 监控机制
Nagios 提供了以下两种检测方式:主动检测和被动检测。主动检测和被动检测的根本区别在于,主动检测是由 Nagios 执行查询命令,而被动检测则是由外部应用程序(代理)将检测结果“推向”Nagios 服务器。一般来说,“主动检测”从工作逻辑和程序文件配置上都较“被动检测”易于理解。在被监控设备较少,网络带宽充裕的情况下推荐都使用“主动检测”机制实现监控。
- 主动检测如何进行?
当 Nagios 要检测主机或者是服务状态时,将会执行一个插件,并且传递给它需要检测的信息,然后插件将会检测服务或者主机的操作状态并且将结果返回给 Nagios 守护进程。Nagios 会对这个主机或者是服务检测结果进行处理,并根据需要适当地采取行动。例如:发送通知、运行事件处理程序等。
- 什么时候主动检测执行?
每隔一定的时间间隔,由 service 和 host 定义中的 checkJnterval 和 retry_interval 参数值决定,可以称为定期检测。
3.1.5 Nagios 整体框架图
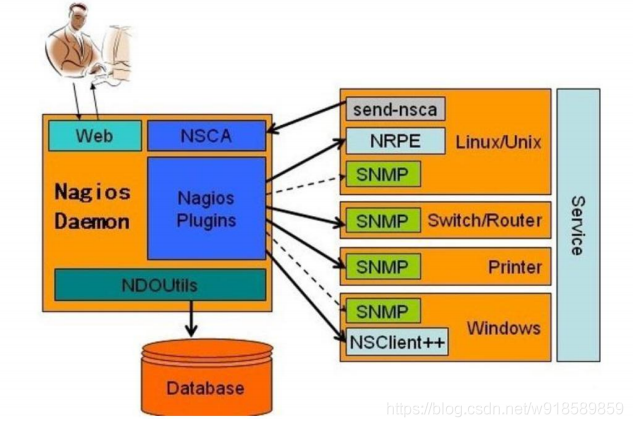
Nagios 监控实现原理
Nagios 通过NRPE 来远端管理服务
- Nagios 执行安装在它里面的check_nrpe 插件,并告诉check_nrpe 去检测哪些服务。
- 通过SSL,check_nrpe 连接远端机子上的NRPE daemon
- NRPE 运行本地的各种插件去检测本地的服务和状态(check_disk,…etc)
- 最后,NRPE 把检测的结果传给主机端的check_nrpe,check_nrpe 再把结果送到Nagios状态队列中。
- Nagios 依次读取队列中的信息,再把结果显示出来。
3.2 构建 Nagio 监控
10.10.10.11 → Nagios 服务器端(CentOS 6系统)
10.10.10.12 → 被监控端(CentOS 6系统)
3.2.1 解决安装nagios的依赖关系(10.10.10.11)
#需要注意 *gb* 必须按照视屏的方式进行后安装
mount -t iso9660 /dev/cdrom /mnt/cdrom #挂载本地yum光盘
yum -y install httpd gcc glibc glibc-common php php-mysql
cd /mnt/cdrom/Packages
yum -y install *gd*
3.2.2 创建运行身份(10.10.10.11)
$ groupadd nagcmd
#创建运行组
$ useradd -m nagios
#创建运行用户 nagios
$ usermod -a -G nagcmd nagios
#将 nagios 用户添加到 nagcmd 组中
$ usermod -a -G nagcmd apache
#将 apache 用户添加到 nagcmd 组中
3.2.3 编译安装nagios(10.10.10.11)
所需软件百度网盘
链接:https://pan.baidu.com/s/1wfgE3ISFsBddoO2JuMdRiA
提取码:ton9
#上传 nagios.iso
mkdir /iso
mount -o loop nagios.iso /iso
cp -a /iso/* /root
cd /root
tar -zxvf nagios-3.3.1.tar.gz && cd nagios
#解压 Nagios 源码包

./configure --with-command-group=nagcmd --enable-event-broker
#生成 Nagios Makefile 文件
make all
make install
make install-init
make install-config
make install-commandmode
$ vim /usr/local/nagios/etc/objects/contacts.cfg
email       nagios@localhost
#这个是默认设置

make install-webconf
$ htpasswd -c /usr/local/nagios/etc/htpasswd.users nagiosadmin
New password: #123
Re-type new password: #123
Adding password for user nagiosadmin
$ service httpd restart
3.2.4 编译、安装 nagios-plugins(10.10.10.11)
cd /root
tar zxf nagios-plugins-1.4.14.tar.gz
cd nagios-plugins-1.4.14
./configure --with-nagios-user=nagios --with-nagios-group=nagios --with-mysql --enable-perl-modules
make && make install
3.2.5 配置并启动 Nagios(10.10.10.11)
$ chkconfig --add nagios && chkconfig nagios on
$ /usr/local/nagios/bin/nagios -v /usr/local/nagios/etc/nagios.cfg
$ service nagios start
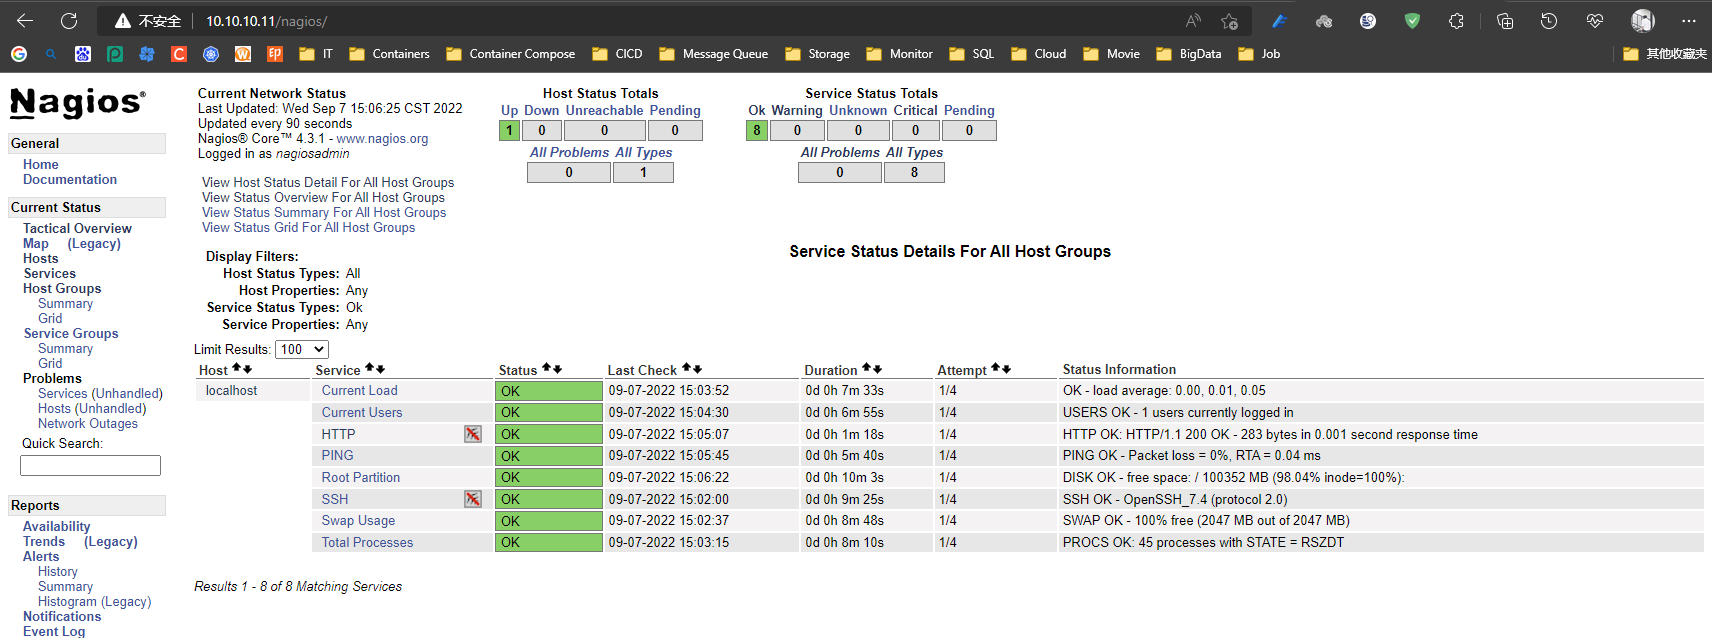
浏览器输入10.10.10.11/nagios访问,用户名nagiosadmin,密码123
Nagios 目录解释
$ cd /usr/local/nagios/
bin:Nagios 可执行程序所在目录
bin
|-- nagios
|-- nagiostats
|-- nrpe

etc:配置文件
etc
|-- cgi.cfg
|-- htpasswd.users   ==>web界面密码验证文件
|-- nagios.cfg   ==>nagios主配置。相当于nginx.conf
|-- nrpe.cfg     ==>客户端的配置文件
|-- objects
|   |-- commands.cfg   		==>存放nagios命令相关配置
|   |-- contacts.cfg      ==>存放报警联系人相关配置的文件
|   |-- localhost.cfg     ==>本机用
|   |-- printer.cfg		   	==>打印机
|   |-- switch.cfg        ==>交换机
|   |-- templates.cfg	  	==>模板配置文件,为了方便配置服务配置
|   |-- timeperiods.cfg   ==>存放报警周期时间等相关配置
|   |-- windows.cfg	 	  	==>windows相关
|   |--services.cfg       ==>存放具体被监控的服务相关配置内容(默认不存在)
|   |--hosts.cfg          ==>存放具体被监控的主机相关配置(默认不存在)
|-- resource.cfg

libexec	:Nagios 外部插件所在目录  check_ifstatus

sbin 		:Nagios CGI 文件所在目录,也就是执行外部命令所需文件所在的目录

include	:包含文件
(histogram.cgi      showlog.cgi    statuswrl.cgi)

share		:Nagios网页文件所在的目录

var			:Nagios 日志文件、lock 等文件所在的目录 nagios.log
3.2.6 配置 Linux 端监控(10.10.10.12)
- 创建用户
$ mount -t iso9660 /dev/cdrom /mnt/cdrom
#挂载本地yum光盘
$ scp root@10.10.10.11:/root/nagios.iso /root
$ mkdir /iso
$ mount -o loop nagios.iso /iso
$ cp -a /iso/* .
$ useradd nagios
- 为了安装 NRPE,先安装 nagios-plugins-1.4.14.tar.gz 插件
$ tar zxf nagios-plugins-1.4.14.tar.gz
$ cd nagios-plugins-1.4.14
$ ./configure --with-nagios-user=nagios --with-nagios-group=nagios
$ make all && make install
$ yum -y install openssl openssl-devel
- 安装 NRPE
cd && tar -zxvf nrpe-2.12.tar.gz
cd nrpe-2.12
./configure --enable-ssl --with-ssl-lib=/usr/lib64/
make all
make install-plugin
make install-daemon
make install-daemon-config
- 配置 NRPE 信息
$ vim /usr/local/nagios/etc/nrpe.cfg
allowed_hosts=10.10.10.11,127.0.0.1
#添加服务器ip

$ /usr/local/nagios/bin/nrpe -c /usr/local/nagios/etc/nrpe.cfg -d
- 服务器端安装 NRPE 插件(10.10.10.11)
$ yum -y install openssl openssl-devel
$ cd && tar -zxvf nrpe-2.12.tar.gz
$ cd nrpe-2.12
$ ./configure --enable-ssl --with-ssl-lib=/usr/lib64/
$ make all
$ make install-plugin
- command.cfg 定义外部构件NRPE(10.10.10.11)
$ vim /usr/local/nagios/etc/objects/commands.cfg
define command{
	command_name check_nrpe
	command_line $USER1$/check_nrpe -H $HOSTADDRESS$ -c $ARG1$
}
- 定义 linux.cfg
$ cd /usr/local/nagios/etc/objects
$ cp -a windows.cfg linux.cfg
$ sed -i 's/windows/linux/g' linux.cfg
$ vim linux.cfg
define host{
use linux-server ; Inherit default values from a template
host_name linux ; The name we'r'e giving to this host alias My linux Server ; A longer name associated with the host
address 10.10.10.12 ; IP address of the host #(客户端 IP 既被监控的 IP)
}
#dG,光标以后全部删除,然后添加如下内容
define service{ #负载检测
use generic-service
host_name linux
service_description check-load
check_command check_nrpe!check_load
}
define service{ #用户数
use generic-service
host_name linux
service_description check-users
check_command check_nrpe!check_users
}
define service{ #总进程
use generic-service
host_name linux
service_description otal_procs
check_command check_nrpe!check_total_procs
}
$ vim /usr/local/nagios/etc/nagios.cfg
cfg_file=/usr/local/nagios/etc/objects/windows.cfg
cfg_file=/usr/local/nagios/etc/objects/linux.cfg
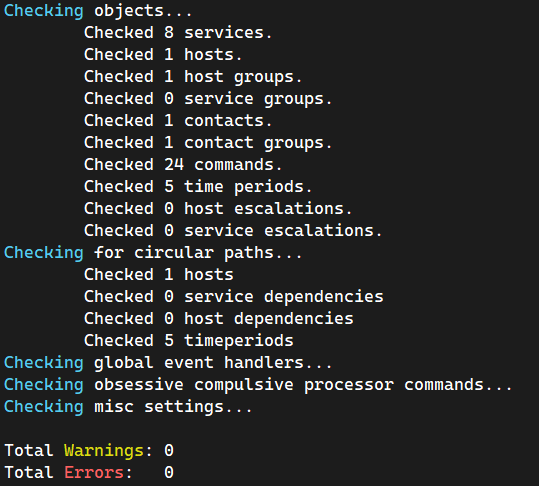
#检测配置有没有错误
$ /usr/local/nagios/bin/nagios -v /usr/local/nagios/etc/nagios.cfg
$ service nagios restart
3.2.7 配置 Windows 端监控
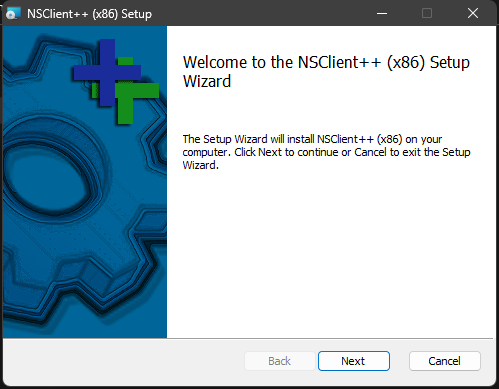
1)被监控端安装 NSClient+±0.3.8-Win32.msi
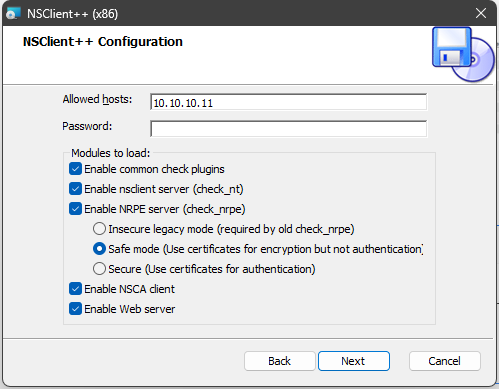
2)安装完成后修改配置文件 NSC.ini 把需要的库都打开
3)在监控服务器上修改 nagios 配置文件 nagios.cfg
$ vim /usr/local/nagios/objects/windows.cfg
define host{
	use                windows-server ; Inherit default values from a template
	host_name          winserver ; The name we'r'e giving to this host
	alias              My Windows Server ; A longer name associated with the host
	address            10.10.10.99 ; 你主机的 IP
 }
$ vim //usr/local/nagios/etc/nagios.cfg
cfg_file=/usr/local/nagios/etc/objects/windows.cfg

$ service nagios restart
3.3 CentOS 7.9.2009 安装 Nagios
#服务器端配置
yum install -y httpd mysql mysql-devel mysql-server \
		php php-mysql gcc gcc-c++ gblic gblic-devel gd gd-devel openssl-devel

groupadd nagcmd
useradd nagios
usermod -a -G nagcmd nagios
usermod -a -G nagcmd daemon
usermod -a -G nagcmd apache #(http的user)

cd /root/
wget https://assets.nagios.com/downloads/nagioscore/releases/nagios-4.3.1.tar.gz
tar -zxvf nagios-4.3.1.tar.gz ; cd nagios-4.3.1
./configure --prefix=/etc/nagios \
--with-nagios-user=nagios \
--with-nagios-group=nagios \
--enable-event-broker
make all
make install
make install-init
make install-commandmode
make install-config
make install-plugin
$ vim /etc/nagios/etc/objects/contacts.cfg
email       nagios@localhost
#这个是默认设置

make install-webconf
$ htpasswd -c /etc/nagios/etc/htpasswd.users nagiosadmin
New password: #123
Re-type new password: #123
Adding password for user nagiosadmin
$ systemctl restart httpd

#安装 Nagios 插件依赖项
sudo yum install -y gcc glibc glibc-common make gettext \
                automake autoconf wget openssl-devel net-snmp \
                net-snmp-utils epel-release perl-Net-SNMP
yum -y install perl-ExtUtils-MakeMaker

cd /root/
wget --no-check-certificate https://nagios-plugins.org/download/nagios-plugins-2.2.1.tar.gz
tar zxvf nagios-plugins-2.2.1.tar.gz ; cd nagios-plugins-2.2.1
./configure --with-nagios-user=nagios \
--with-nagios-group=nagios \
 --with-mysql --enable-perl-modules
#--with-mysql=/path/to/mysql #(监控mysql必须添加此选项)
make && make install

cd nagios-4.3.1
cp -R contrib/eventhandlers/ /etc/nagios/libexec/
chown -R nagios:nagios /etc/nagios/libexec/eventhandlers/

cd /usr/local/nagios/libexec/
cp -R * /etc/nagios/libexec/

#systemctl enable --now nagios
/sbin/chkconfig --add nagios ; /sbin/chkconfig nagios on
/etc/nagios/bin/nagios -v /etc/nagios/etc/nagios.cfg
service nagios start
service nagios restart

#用于解决
echo "Hello nagios" > /var/www/html/index.html

#安装openssl软件(用于Linux主机的纳管)
yum install -y openssl openssl-devel
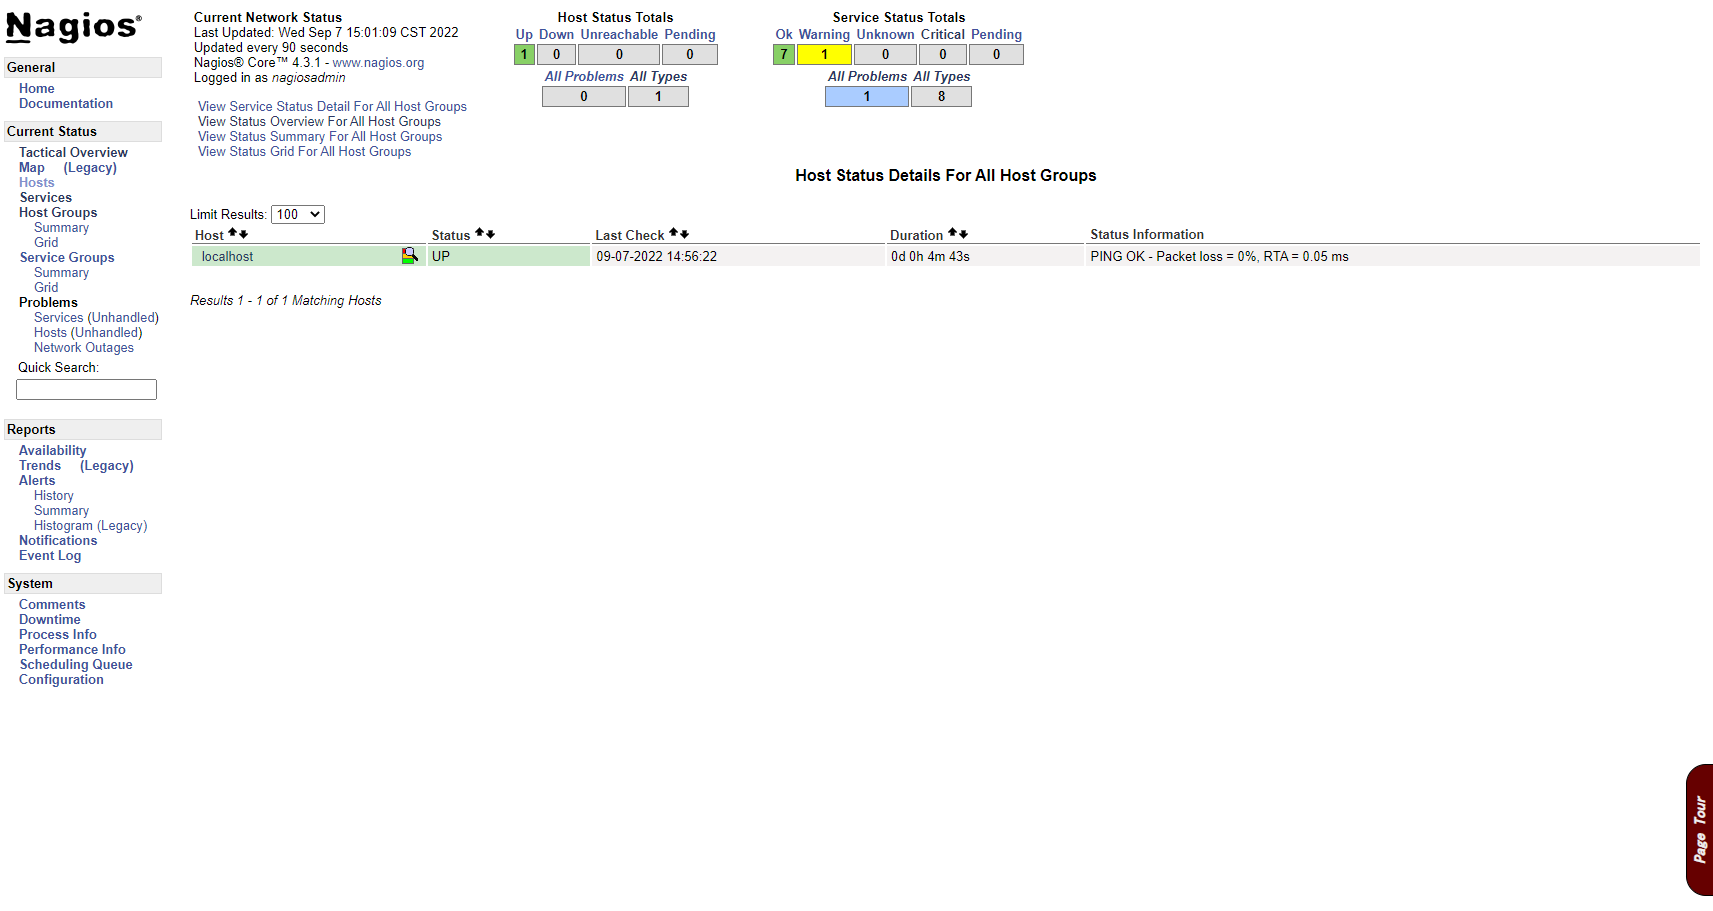
浏览器输入10.10.10.11/nagios访问,用户名nagiosadmin,密码123。


则在网页路径(/var/www/html/)下添加一个默认页即可,过一段时间后就可以将 WARNING 的提示取消了。
3.3.1 Windows 客户端配置
#Windows下载客户端
https://dl.pconline.com.cn/download/456606-1.html
监控服务器的IP地址
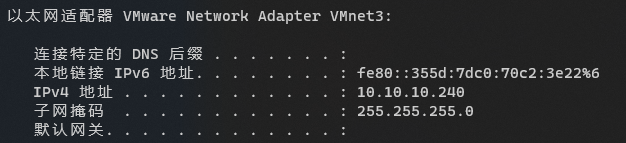
查看本机的IP地址(10.10.10.xxx网段)
#打开cmd窗口
> ipconfig

#10.10.10.11机器ping宿主机
> ping -c1 -W1 10.10.10.240
PING 10.10.10.240 (10.10.10.240) 56(84) bytes of data.
64 bytes from 10.10.10.240: icmp_seq=1 ttl=64 time=0.404 ms
#配置Windows主机
$ cd /etc/nagios/etc/objects/
$ vim windows.cfg
define host{
use windows-server ; Inherit default values from a template
host_name winserver ; The name we'r'e giving to this host
alias My Windows Server ; A longer name associated with the host
#配置为Windows主机IP地址
address 10.10.10.240 ; IP address of the host
}
define service{
use generic-service
#和 host 中的host_name一致(若进行了修改则将该文件所有的hostname对应的值进行修改,
#若没有修改hostname值,则不需要进行修改)
host_name winserver
service_description NSClient++ Version
check_command check_nt!CLIENTVERSION
}
#将该模板注释掉或者删除
#define service{
# use generic-service
# host_name winserver
# service_description W3SVC
# check_command check_nt!SERVICESTATE!-d SHOWALL -l W3SVC
# }
#保存退出文件
$ cd /etc/nagios/etc
#修改主配置文件
$ vim nagios.cfg
#取消注释
cfg_file=/etc/nagios/etc/objects/windows.cfg
#保存退出文件
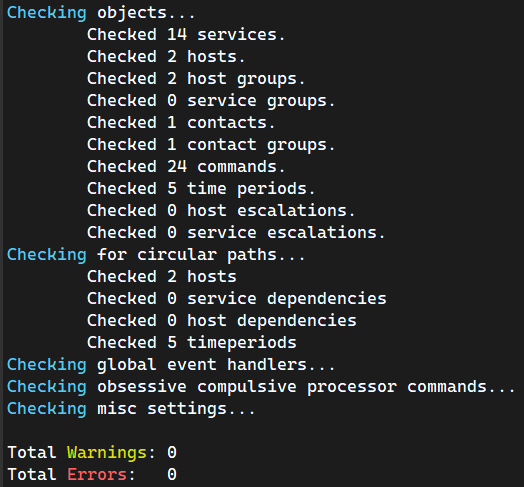
#检测配置文件是否正常
/etc/nagios/bin/nagios -v /etc/nagios/etc/nagios.cfg
#重启服务
service nagios restart
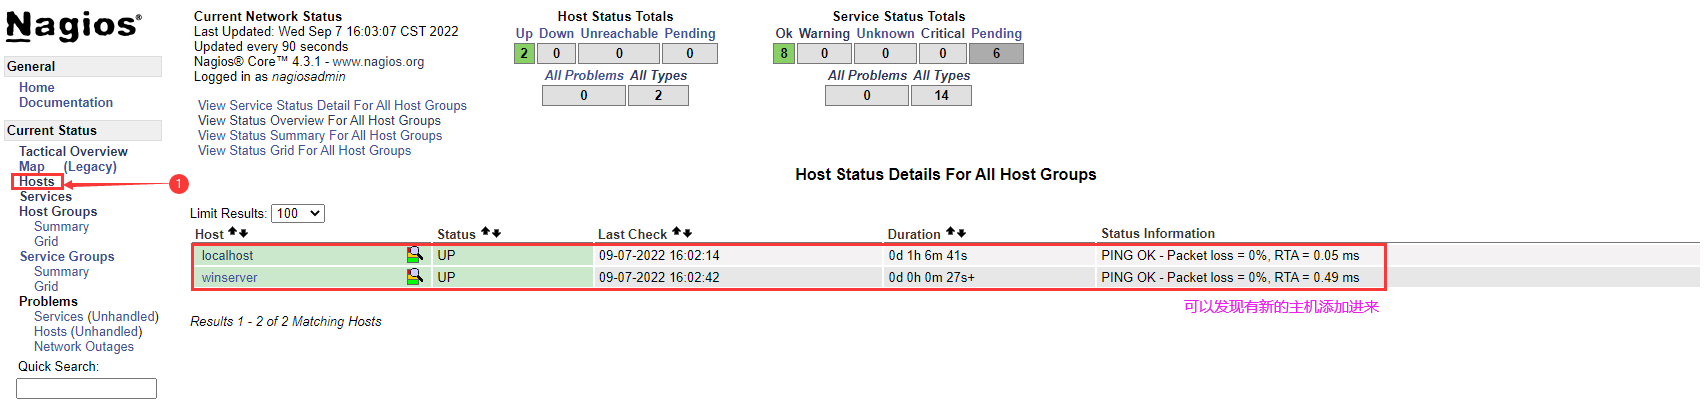
登录到 Nagios 的Dashboard Web 页面就点击 “Hosts” 就可以查看到所有的主机,就可以发现有新添加的 Windows 主机。
3.3.2 Linux 客户端配置
#创建用户
useradd nagios

#为了安装nrpe,先安装nagios-plugins
yum install -y httpd mysql mysql-devel mysql-server \
  php php-mysql gcc gcc-c++ gblic gblic-devel gd gd-devel openssl-devel

#安装 Nagios 插件依赖项
sudo yum install -y gcc glibc glibc-common make gettext \
                automake autoconf wget openssl-devel net-snmp \
                net-snmp-utils epel-release perl-Net-SNMP
yum -y install perl-ExtUtils-MakeMaker

yum -y install gcc gcc-c++ autoconf libjpeg libjpeg-devel libpng libpng-devel \
freetype freetype-devel libxml2 libxml2-devel zlib zlib-devel \
glibc glibc-devel glib2 glib2-devel bzip2 bzip2-devel \
ncurses ncurses-devel curl curl-devel e2fsprogs e2fsprogs-devel \
krb5-devel libidn libidn-devel openssl openssl-devel \
nss_ldap openldap openldap-devel \
openldap-clients openldap-servers libxslt-devel libevent-devel ntp \
libtool-ltdl bison libtool vim-enhanced

cd /root/
wget --no-check-certificate https://nagios-plugins.org/download/nagios-plugins-2.2.1.tar.gz
tar -zxvf nagios-plugins-2.2.1.tar.gz ; cd nagios-plugins-2.2.1
./configure --with-nagios-user=nagios \
--with-nagios-group=nagios
make all
make install

#安装nrpe
wget --no-check-certificate https://sourceforge.net/projects/nagios/files/nrpe-3.x/nrpe-3.1.0.tar.gz
tar -zxvf nrpe-3.1.0.tar.gz ; cd nrpe-3.1.0
./configure --enable-ssl --with-ssl-lib=/usr/lib64/
make all
make install-plugin
make install-daemon
#在nrpe3.01版本下执行此命令时会提示没有这个参数
#make install-daemon-config
make install-config

#配置nrpe信息
$ vim /usr/local/nagios/etc/nrpe.cfg
allowed_hosts=10.10.10.12,127.0.0.1,::1
#保存并退出文件
$ /usr/local/nagios/bin/nrpe -c /usr/local/nagios/etc/nrpe.cfg -d
#查看端口
$ netstat -auntlp | grep :5666
tcp        0      0 0.0.0.0:5666            0.0.0.0:*               LISTEN      26892/nrpe
tcp6       0      0 :::5666                 :::*                    LISTEN      26892/nrpe
#进入到Nagios服务器端(10.10.10.11)
#安装nrpe
cd /root
wget --no-check-certificate https://sourceforge.net/projects/nagios/files/nrpe-3.x/nrpe-3.1.0.tar.gz
tar -zxvf nrpe-3.1.0.tar.gz ; cd nrpe-3.1.0
yum install -y openssl openssl-devel
./configure --enable-ssl --with-ssl-lib=/usr/lib64/
make all && make install-plugin
#make install-inetd && make install-init && make install-plugin

#添加脚本内容(用于对象配置文件使用)
$ vim /etc/nagios/etc/objects/commands.cfg
define command{
	command_name check_nrpe
	command_line $USER1$/check_nrpe -H $HOSTADDRESS$ -c $ARG1$
}

#修改配置文件
cd /etc/nagios/etc/objects/
cp -a windows.cfg linux.cfg
$ vim linux.cfg
define host{
        use             linux-server    ; Inherit default values from a template
        host_name       linuxserver     ; The name we'r'e giving to this host
        alias           My Linux Server ; A longer name associated with the host
        address         10.10.10.11     ; IP address of the host
        }
#注释或者删除
#define hostgroup{
#        hostgroup_name  windows-servers ; The name of the hostgroup
#        alias           Windows Servers ; Long name of the group
#        }

#dG,光标以后全部删除,然后添加如下内容
#负载检测
define service{
	use                   generic-service
	host_name             linuxserver
	service_description   check-load
	check_command         check_nrpe!check_load
}
#用户数
define service{
	 use                   generic-service
	 host_name             linuxserver
	 service_description   check-users
	 check_command         check_nrpe!check_users
}
#总进程
define service{
	 use                   generic-service
	 host_name             linuxserver
	 service_description   otal_procs
	 check_command         check_nrpe!check_total_procs
}

#修改主配置文件内容
$ vim /etc/nagios/etc/nagios.cfg
cfg_file=/etc/nagios/etc/objects/windows.cfg
cfg_file=/etc/nagios/etc/objects/linux.cfg

#检测配置文件是否正常
/etc/nagios/bin/nagios -v /etc/nagios/etc/nagios.cfg
#重启服务
service nagios restart
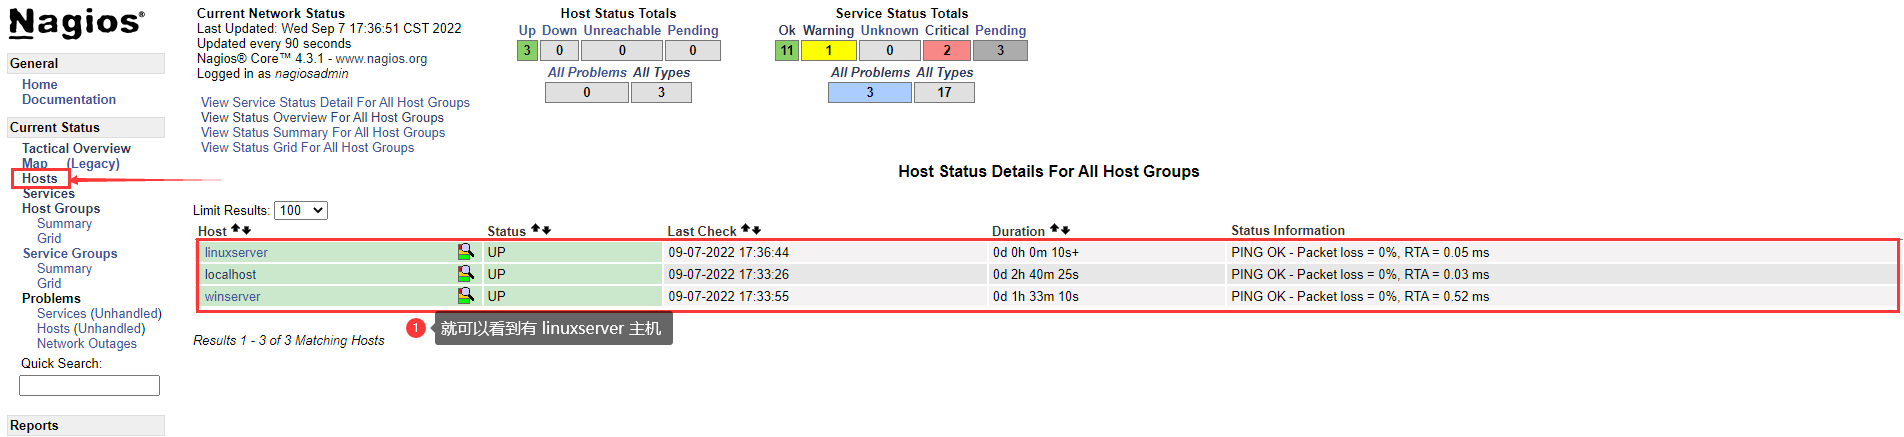
登录到 Nagios 的Dashboard Web 页面就点击 “Hosts” 就可以查看到所有的主机,就可以发现有新添加的 Linux 主机。
老牌的监控软件有太多坑,在老牌监控软件的Web Dashboard 能够实现的事情还是太少,并没有Zabbix 多,还是用 zabbix 做监控才是永远的神。——个人观点经供参考。


 2795
2795

 被折叠的 条评论
为什么被折叠?
被折叠的 条评论
为什么被折叠?
 到【灌水乐园】发言


