


使用ZedGraph绘制曲线图的时候,不仅仅是看曲线的走向,也需要查看曲线上某位位置处采集到的数据是多少。下面介绍三种方法,从简单到复杂。
1、使用自带的功能显示点的坐标
使用ZedGraph自带的属性IsShowPointValues,来显示曲线点坐标
注 zedGraph是控件ZedGraph的名称

将IsShowPointValues设置为true
zedGraph.IsShowPointValues = true;
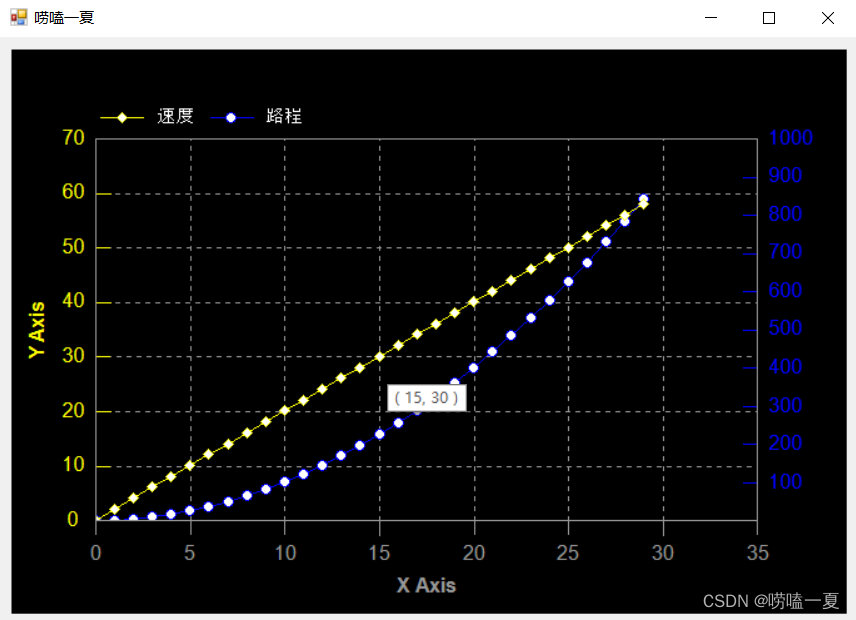
可以显示点的坐标,但是也有个缺点,只能显示某一条曲线上的一个点,如果我想两条曲线上的点一起显示呢,想对比一下数据?
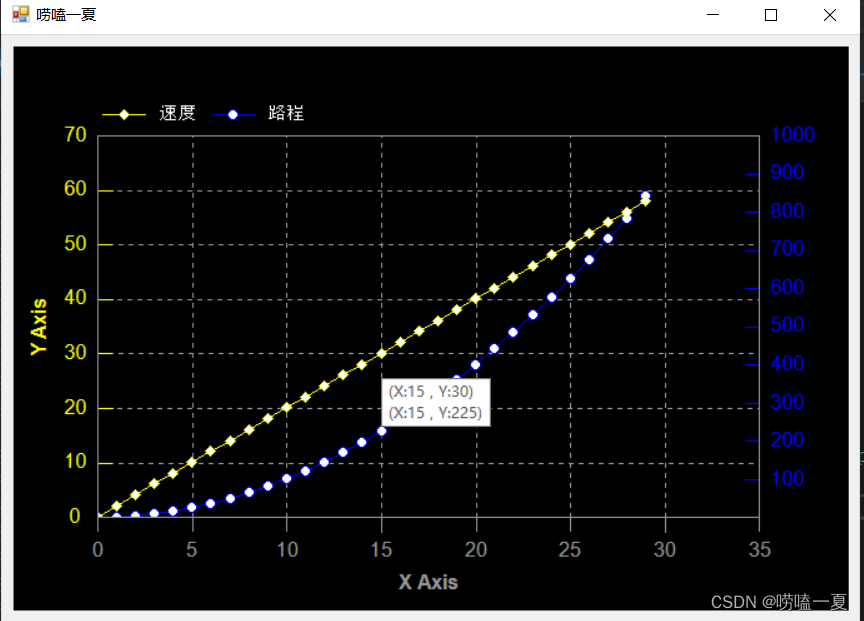
2、 多条曲线的坐标点同时显示
既然已经可以显示某个点的坐标了,那么显示多个点,也应该是可以的。
ZedGraph提供了一个PointValueEvent坐标值事件,它的返回值是一个字符串。哎巧了,这个字符串就是显示坐标点值的字符串,那就可以随便发挥了。
  private string ZedGraph_PointValueEvent(ZedGraphControl sender, GraphPane pane, CurveItem curve, int iPt)
        {
            string info = "";
            if (zedGraph.GraphPane.CurveList.Count > 0)
            {//有曲线
                if (  iPt > 0)
                {
                    foreach (CurveItem item in zedGraph.GraphPane.CurveList)
                    {//遍历曲线
                        info += "(X:" + item.Points[iPt].X.ToString() + " , Y:"
                            + item.Points[iPt].Y.ToString() + ")\r\n";
                    }
               }
            }
            return info;
        }
这么看着是不是觉得还少了什么,应该是一根标识鼠标位置的竖线。点都已经显示出来了,不要再加要求了。(客户根本不会听滴~)你以为就这一个要求,太年轻。能不能把显示坐标点的背景色改改啊,加上曲线的名称啦,更过分的是还得配上对应曲线的颜色。
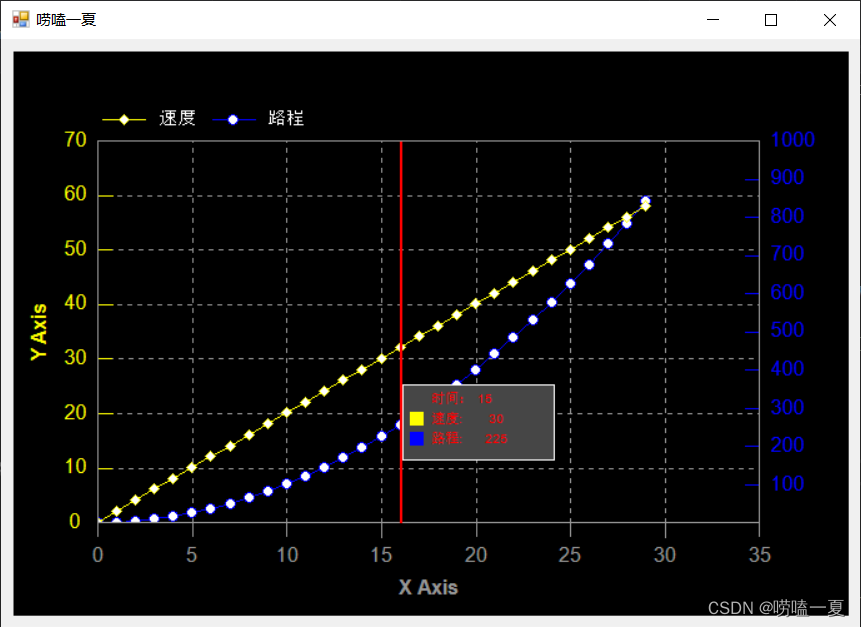
3、 多条曲线的坐标点同时显示(GDI绘制)
客户就是上帝,为了这碎银几两,还是得折腰。
分析一下需求:1 加上鼠标位置的竖线(游标); 2 加上曲线名称(容易);3 改背景色 4 与曲线颜色对应上。
前面两种方法ZedGraph本质上是使用ToolTip来显示曲线坐标点的,但是ZedGraph并没有提供给我们有关于ToolTip的接口。
那么有两种方案:1 、更改ZedGraph的源码; 2、在ZedGraph上重绘一个类似ToolTip的提示框。
这里使用的是第二种方法。
思路: 在鼠标移动的时候,绘制曲线点的坐标以及竖直线游标。
关键的一个点是:鼠标距离曲线上最近的点是哪个呢?幸运的是,我们所关注的这个问题,ZedGraph有提供相关接口可以访问。通过FindNearestPoint
就可以找到最接近的点了。该函数有三个重载方法,可按需使用。
  public bool FindNearestPoint(PointF mousePt, CurveList targetCurveList, out CurveItem nearestCurve, out int iNearest);

  public bool FindNearestPoint(PointF mousePt, CurveItem targetCurve, out CurveItem nearestCurve, out int iNearest);

  public bool FindNearestPoint(PointF mousePt, out CurveItem nearestCurve, out int iNearest);
来吧,自己动手丰俭由人。
记得先把前面的IsShowPointValues设置为false,接着使用ZedGraph中的MousMove事件,在鼠标移动的时候获取最近点的坐标并使用GDI绘制。
 private void ZedGraph_MouseMove(object sender, MouseEventArgs e)
  {
         ShowPonitByDraw(e);
 }

 private void ShowPonitByDraw(MouseEventArgs e)
    {
            if (zedGraph.GraphPane.Chart.Rect.Contains(e.Location) == false)
            {
                return;
            }

            using (Graphics graphics = zedGraph.CreateGraphics())
            {//在zedGraph上创建画布
                zedGraph.Refresh();

                using (Pen pen = new Pen(Color.Red, 2))
                {//创建画笔并设置样式
                    pen.DashStyle = System.Drawing.Drawing2D.DashStyle.Solid;
                    //画竖直线
                    graphics.DrawLine(pen, e.X, zedGraph.GraphPane.Chart.Rect.Top, e.X, zedGraph.GraphPane.Chart.Rect.Bottom);

                    if (zedGraph.GraphPane.CurveList.Count <= 0)
                    {

                        return;
                    }

                    //找最近的一个点
                    zedGraph.GraphPane.FindNearestPoint(e.Location, out CurveItem nearCurve, out int nearIndex);

                    if (nearCurve == null || nearIndex < 0)
                    {
                        return;
                    }

                    string tempMax = "";
                    List<string> infoList = new List<string>();

                    foreach (CurveItem curve in zedGraph.GraphPane.CurveList)
                    {
                        //曲线名称 + 坐标点
                        string tmp = curve.Points[nearIndex].Y.ToString();
                        //填充到8个长度
                        tmp =  tmp.PadLeft(8);
                        tmp = tmp.Insert(0, curve.Label.Text + ": " );

                        infoList.Add(tmp);
                        if (tmp.Length > tempMax.Length)
                        {//记录最大的长度字符串
                            tempMax = tmp;
                        }
                    }


                    //文本绘制的一些字体和画刷配置
                    Font font = new Font("Arial", 10, System.Drawing.FontStyle.Regular, GraphicsUnit.World);

                    //得到一个字体绘制的大小
                    SizeF tempSizeF = graphics.MeasureString(tempMax, font, (int)font.Size);

                    //根据字符长度计算矩形的宽度 10是颜色矩形框的宽度
                    float rectWidth = tempSizeF.Width * tempMax.Length;
                    //高度
                    float rectHeight = (infoList.Count + 1) * 18 + 5;
                    //背景颜色框的左上角点的坐标,偏移2个像素
                    Point point = new Point(e.X + 2, e.Y + 2);

                    #region 计算左上角坐标 让背景矩形框在曲线的矩形框范围之内
                    if (point.X + rectWidth > zedGraph.GraphPane.Chart.Rect.Right)
                    {
                        point.X = (int)(point.X - rectWidth - 2);
                    }

                    if (point.Y + rectHeight > zedGraph.GraphPane.Chart.Rect.Bottom)
                    {
                        point.Y = (int)(point.Y - rectHeight - 2);
                    }
                    #endregion

                    pen.Color = Color.White;
                    //绘制背景矩形框
                    Rectangle rectBg = new Rectangle(point, new Size((int)rectWidth, (int)rectHeight));
                    graphics.DrawRectangle(pen, rectBg);
                    graphics.FillRectangle(new SolidBrush(Color.FromArgb(70, 70, 70)), rectBg);

                    //颜色框的大小
                    Size colorSize = new Size(10, 10);
                    //绘制文本的颜色
                    SolidBrush textBrush = new SolidBrush(Color.Red);

                    //绘制文本内容 时间
                    int time = 0;
                    //"时间(ms):"
                    string timeStr = "时间: " + nearCurve[nearIndex].X.ToString();
                    graphics.DrawString(timeStr , font, textBrush,
                                  new Point(point.X + 20, point.Y + 5 + time * 16));

                    for (int m = 0; m < infoList.Count; m++)
                    {
                        time++;
                        //绘制每条曲线的颜色小矩形框
                        Rectangle rect1 = new Rectangle(new Point(point.X + 5, point.Y + 5 + time * 16), colorSize);
                        graphics.DrawRectangle(new Pen(zedGraph.GraphPane.CurveList[m].Color), rect1);
                        graphics.FillRectangle(new SolidBrush(zedGraph.GraphPane.CurveList[m].Color), rect1);

                        //绘制文本内容
                        graphics.DrawString(infoList[m], font, textBrush,
                                      new Point(point.X + 20, point.Y + 5 + time * 16));
                    }

                }
            }
        }
方法总比困难多,只要敢想且敢做。如果有更好的方法,请告诉我吖。
代码已打包在git:https://github.com/GXXMei/ZedGraphShowPoint
CSDN也有资源(土豪请随意):


 1497
1497


 被折叠的 条评论
为什么被折叠?
被折叠的 条评论
为什么被折叠?
 到【灌水乐园】发言


