


一、Prometheus监控MongoDB架构图
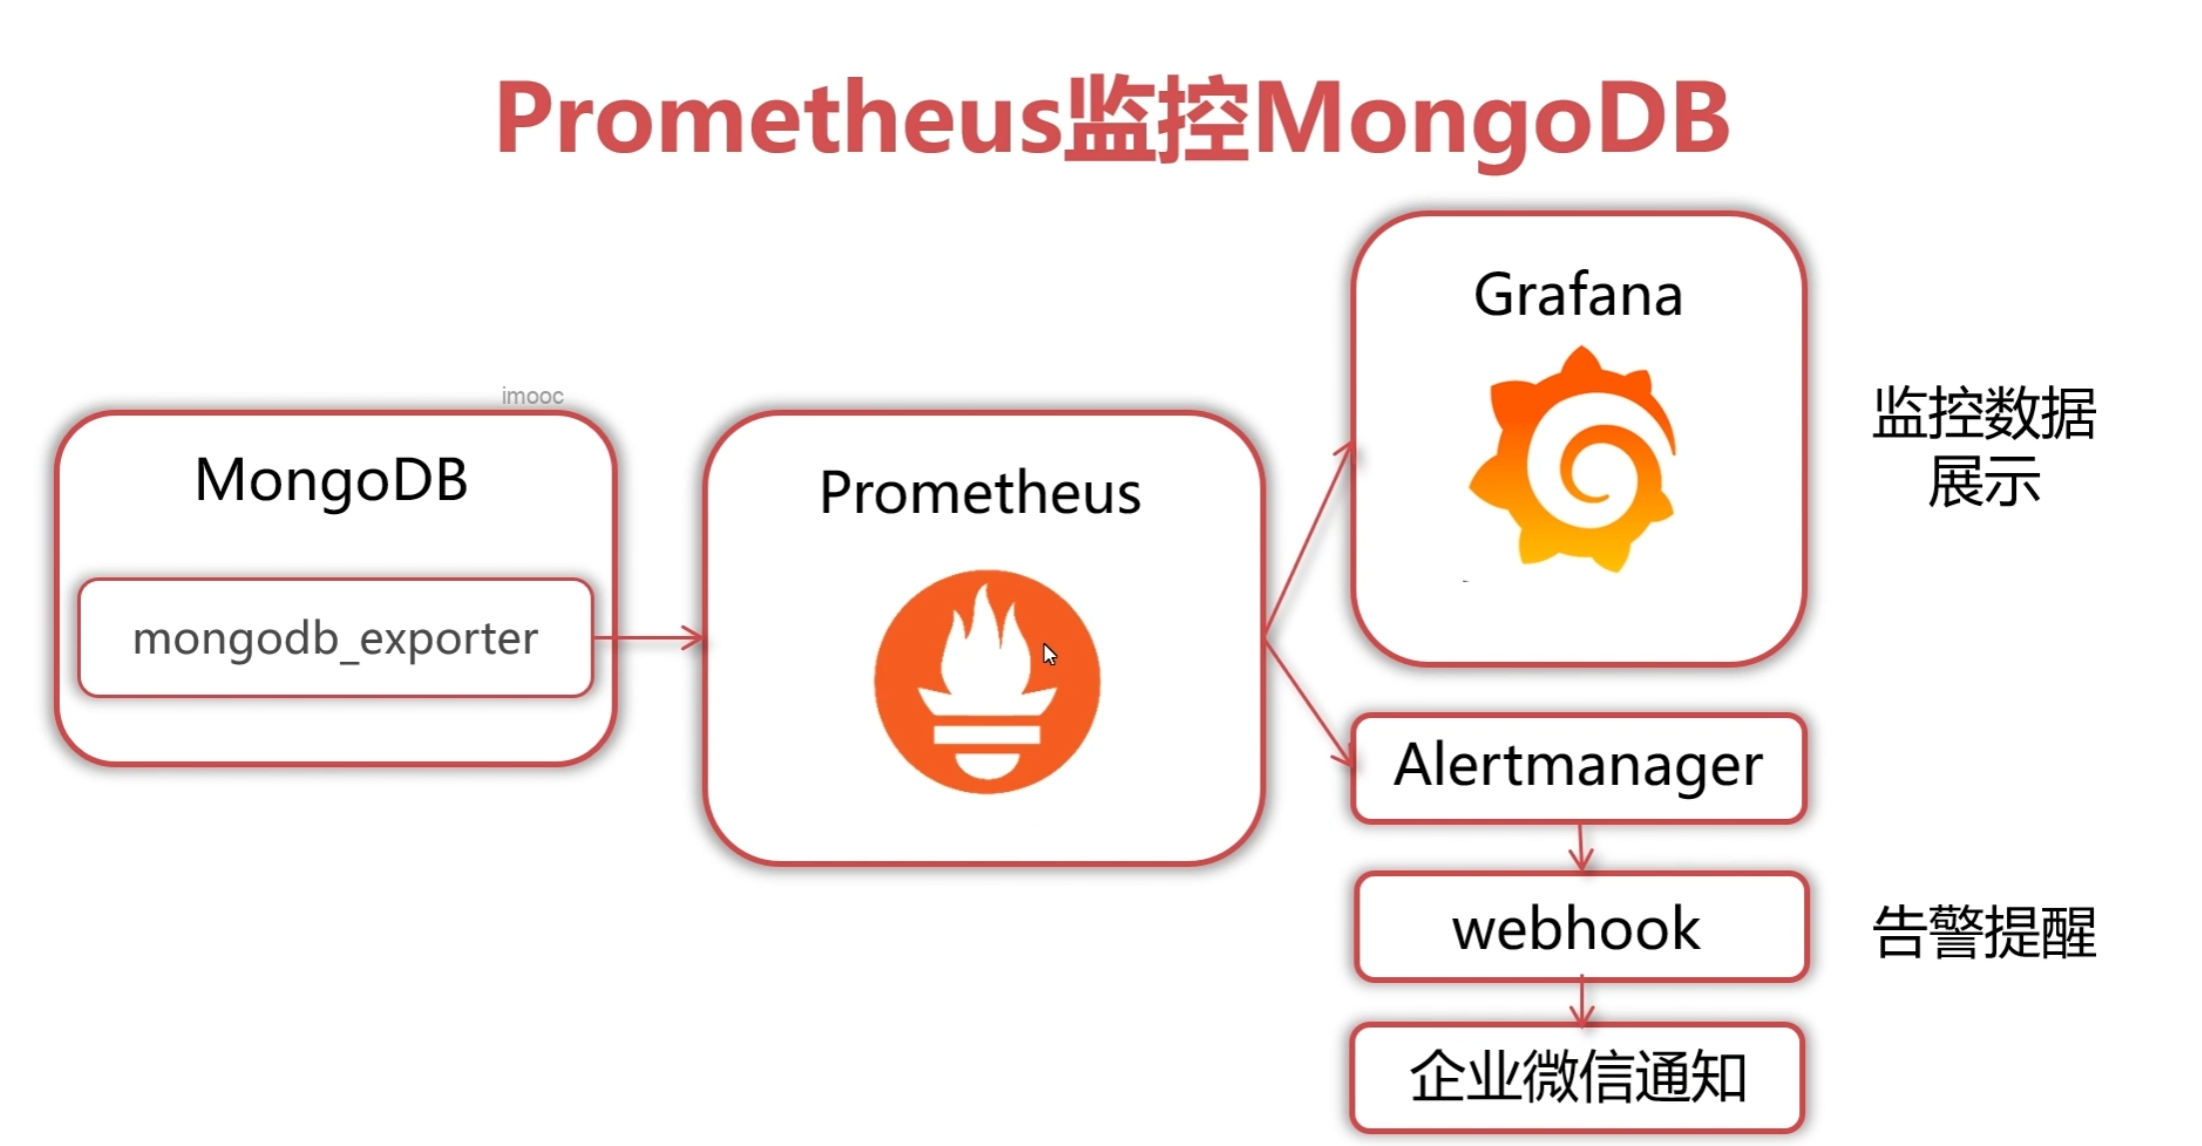
1、环境信息
192.168.201.161   mongodb27001
192.168.201.162   mongodb27001
192.168.201.163   mongodb27001
192.168.201.165   prometheus
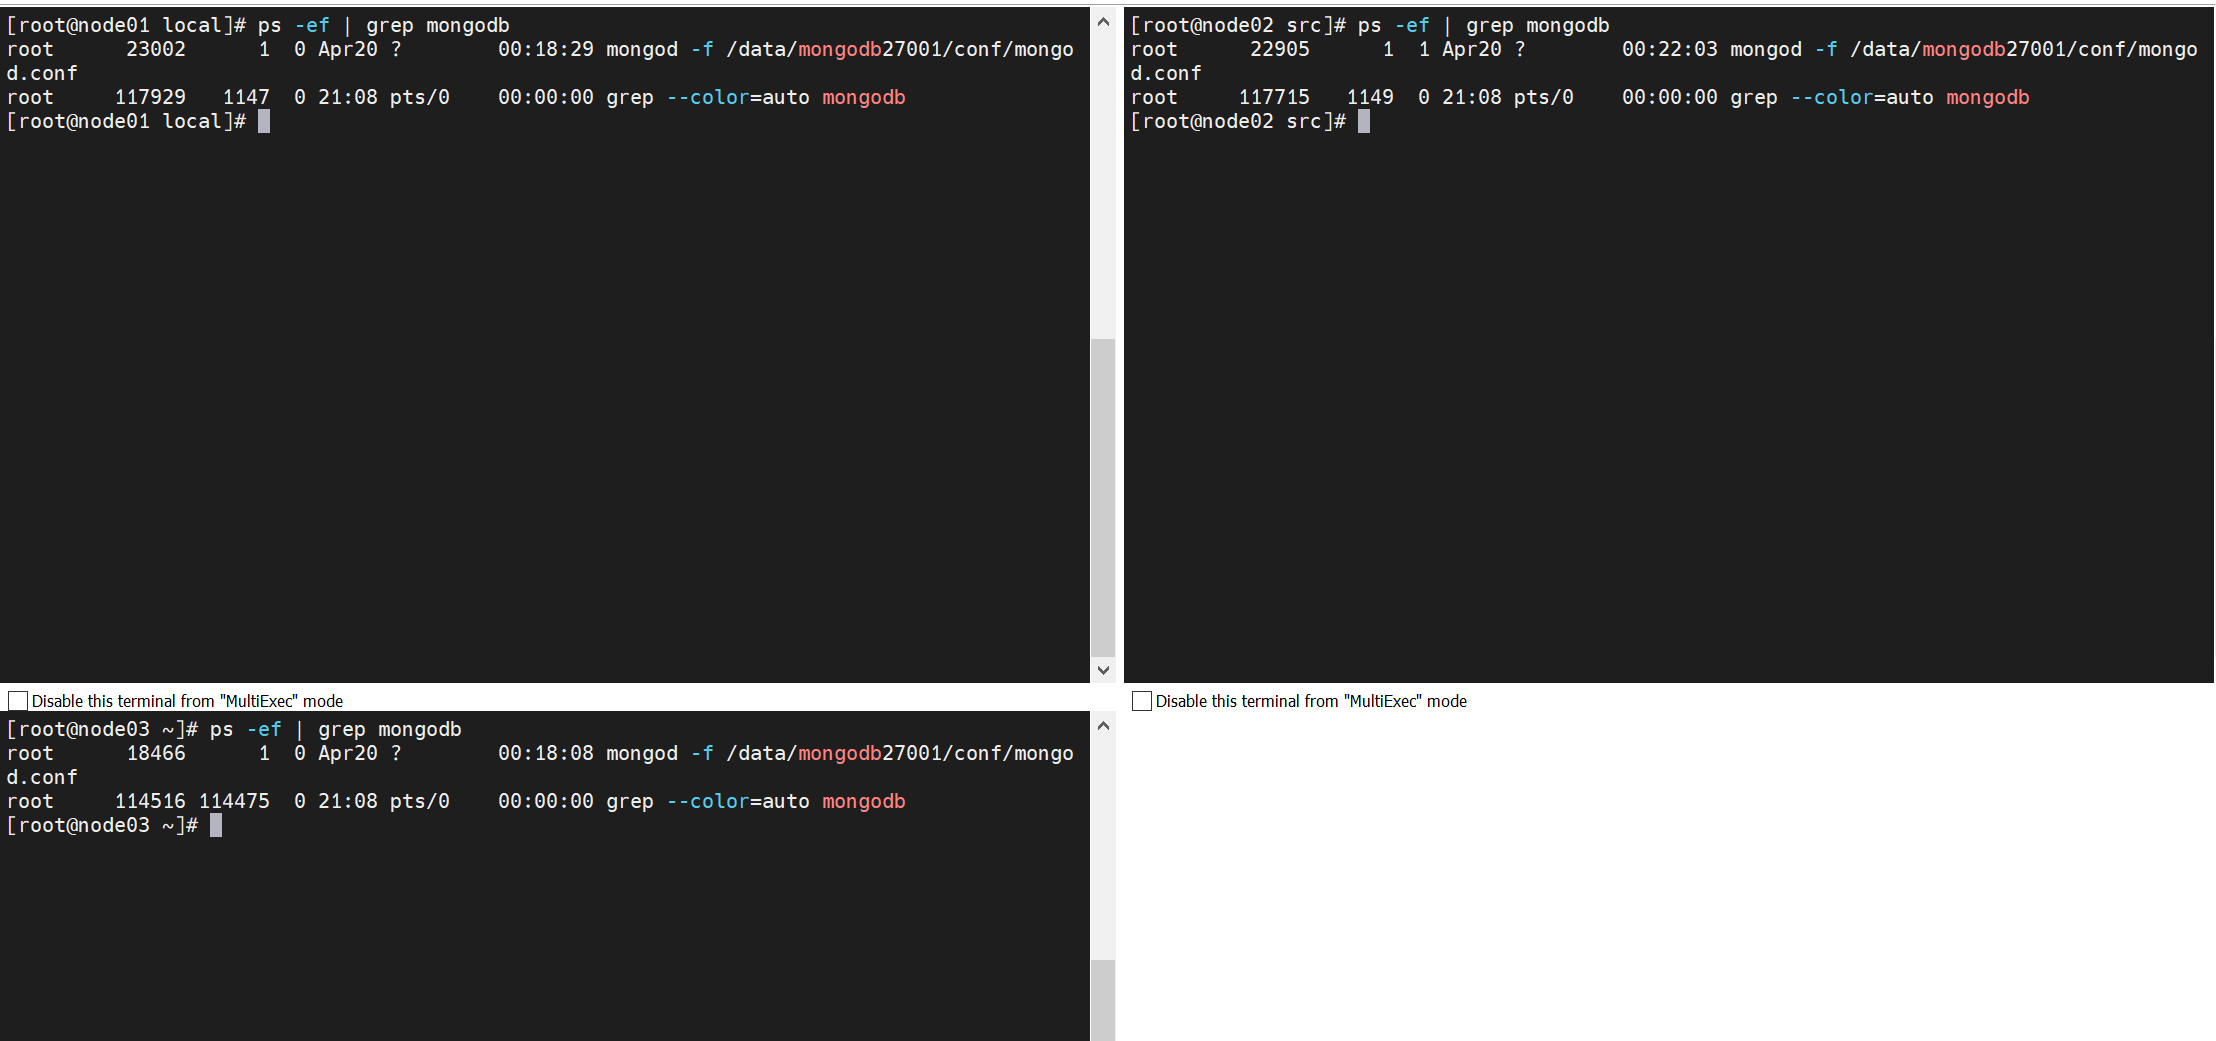
2、查看mongodb进程
ps -ef | grep mongodb
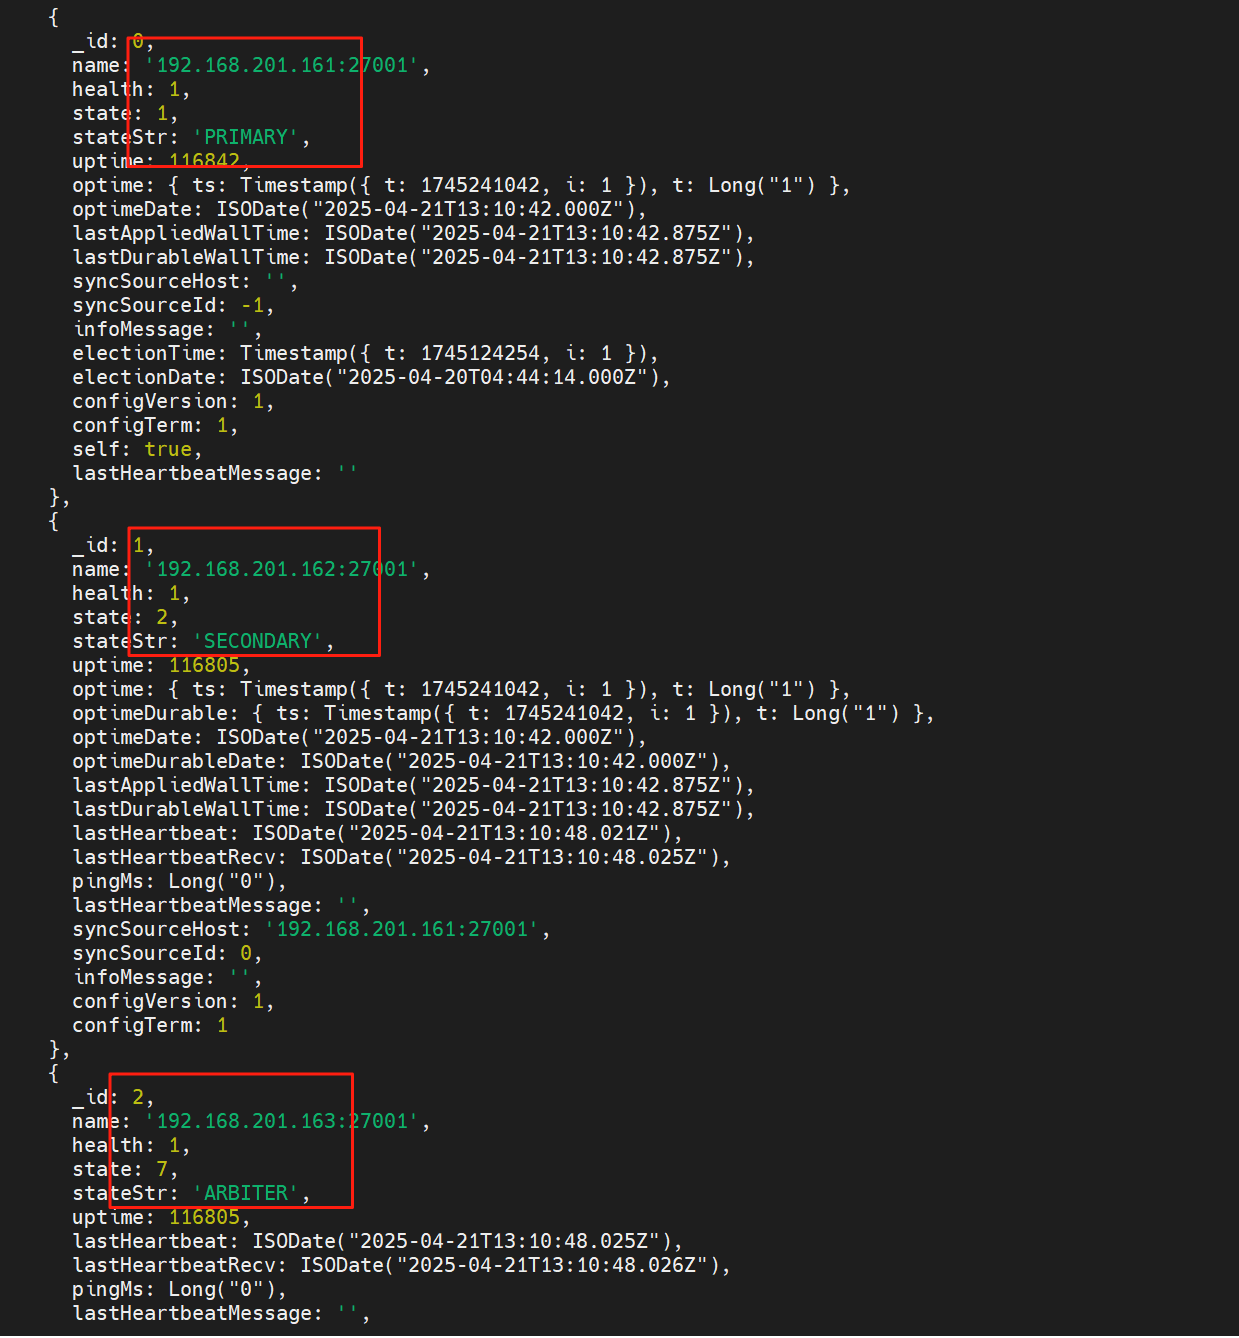
3、查看集群状态
mongosh --port 27001 -u repl -p admin
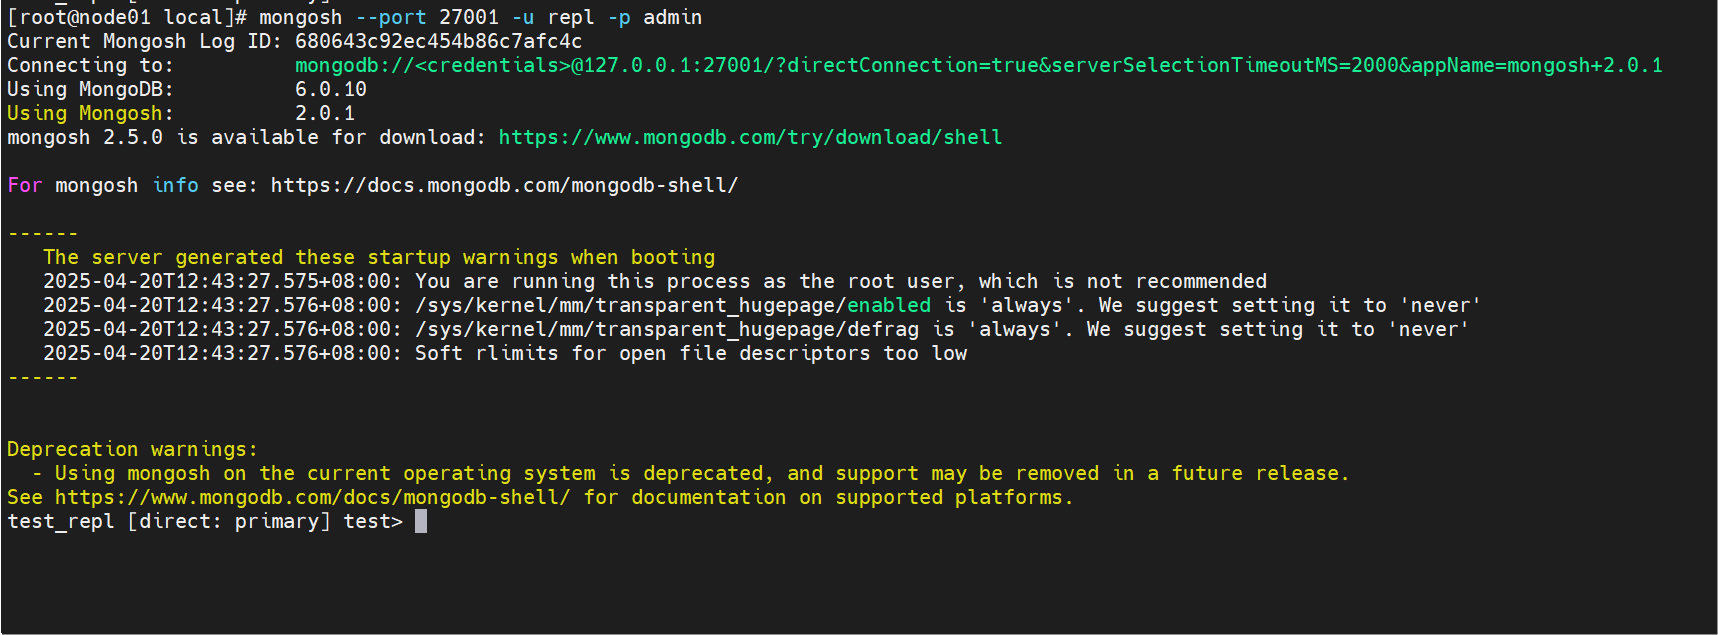
rs.status();
二、安装并启动mongodb_exporter
在161、162节点进行操作
1、获取下载连接
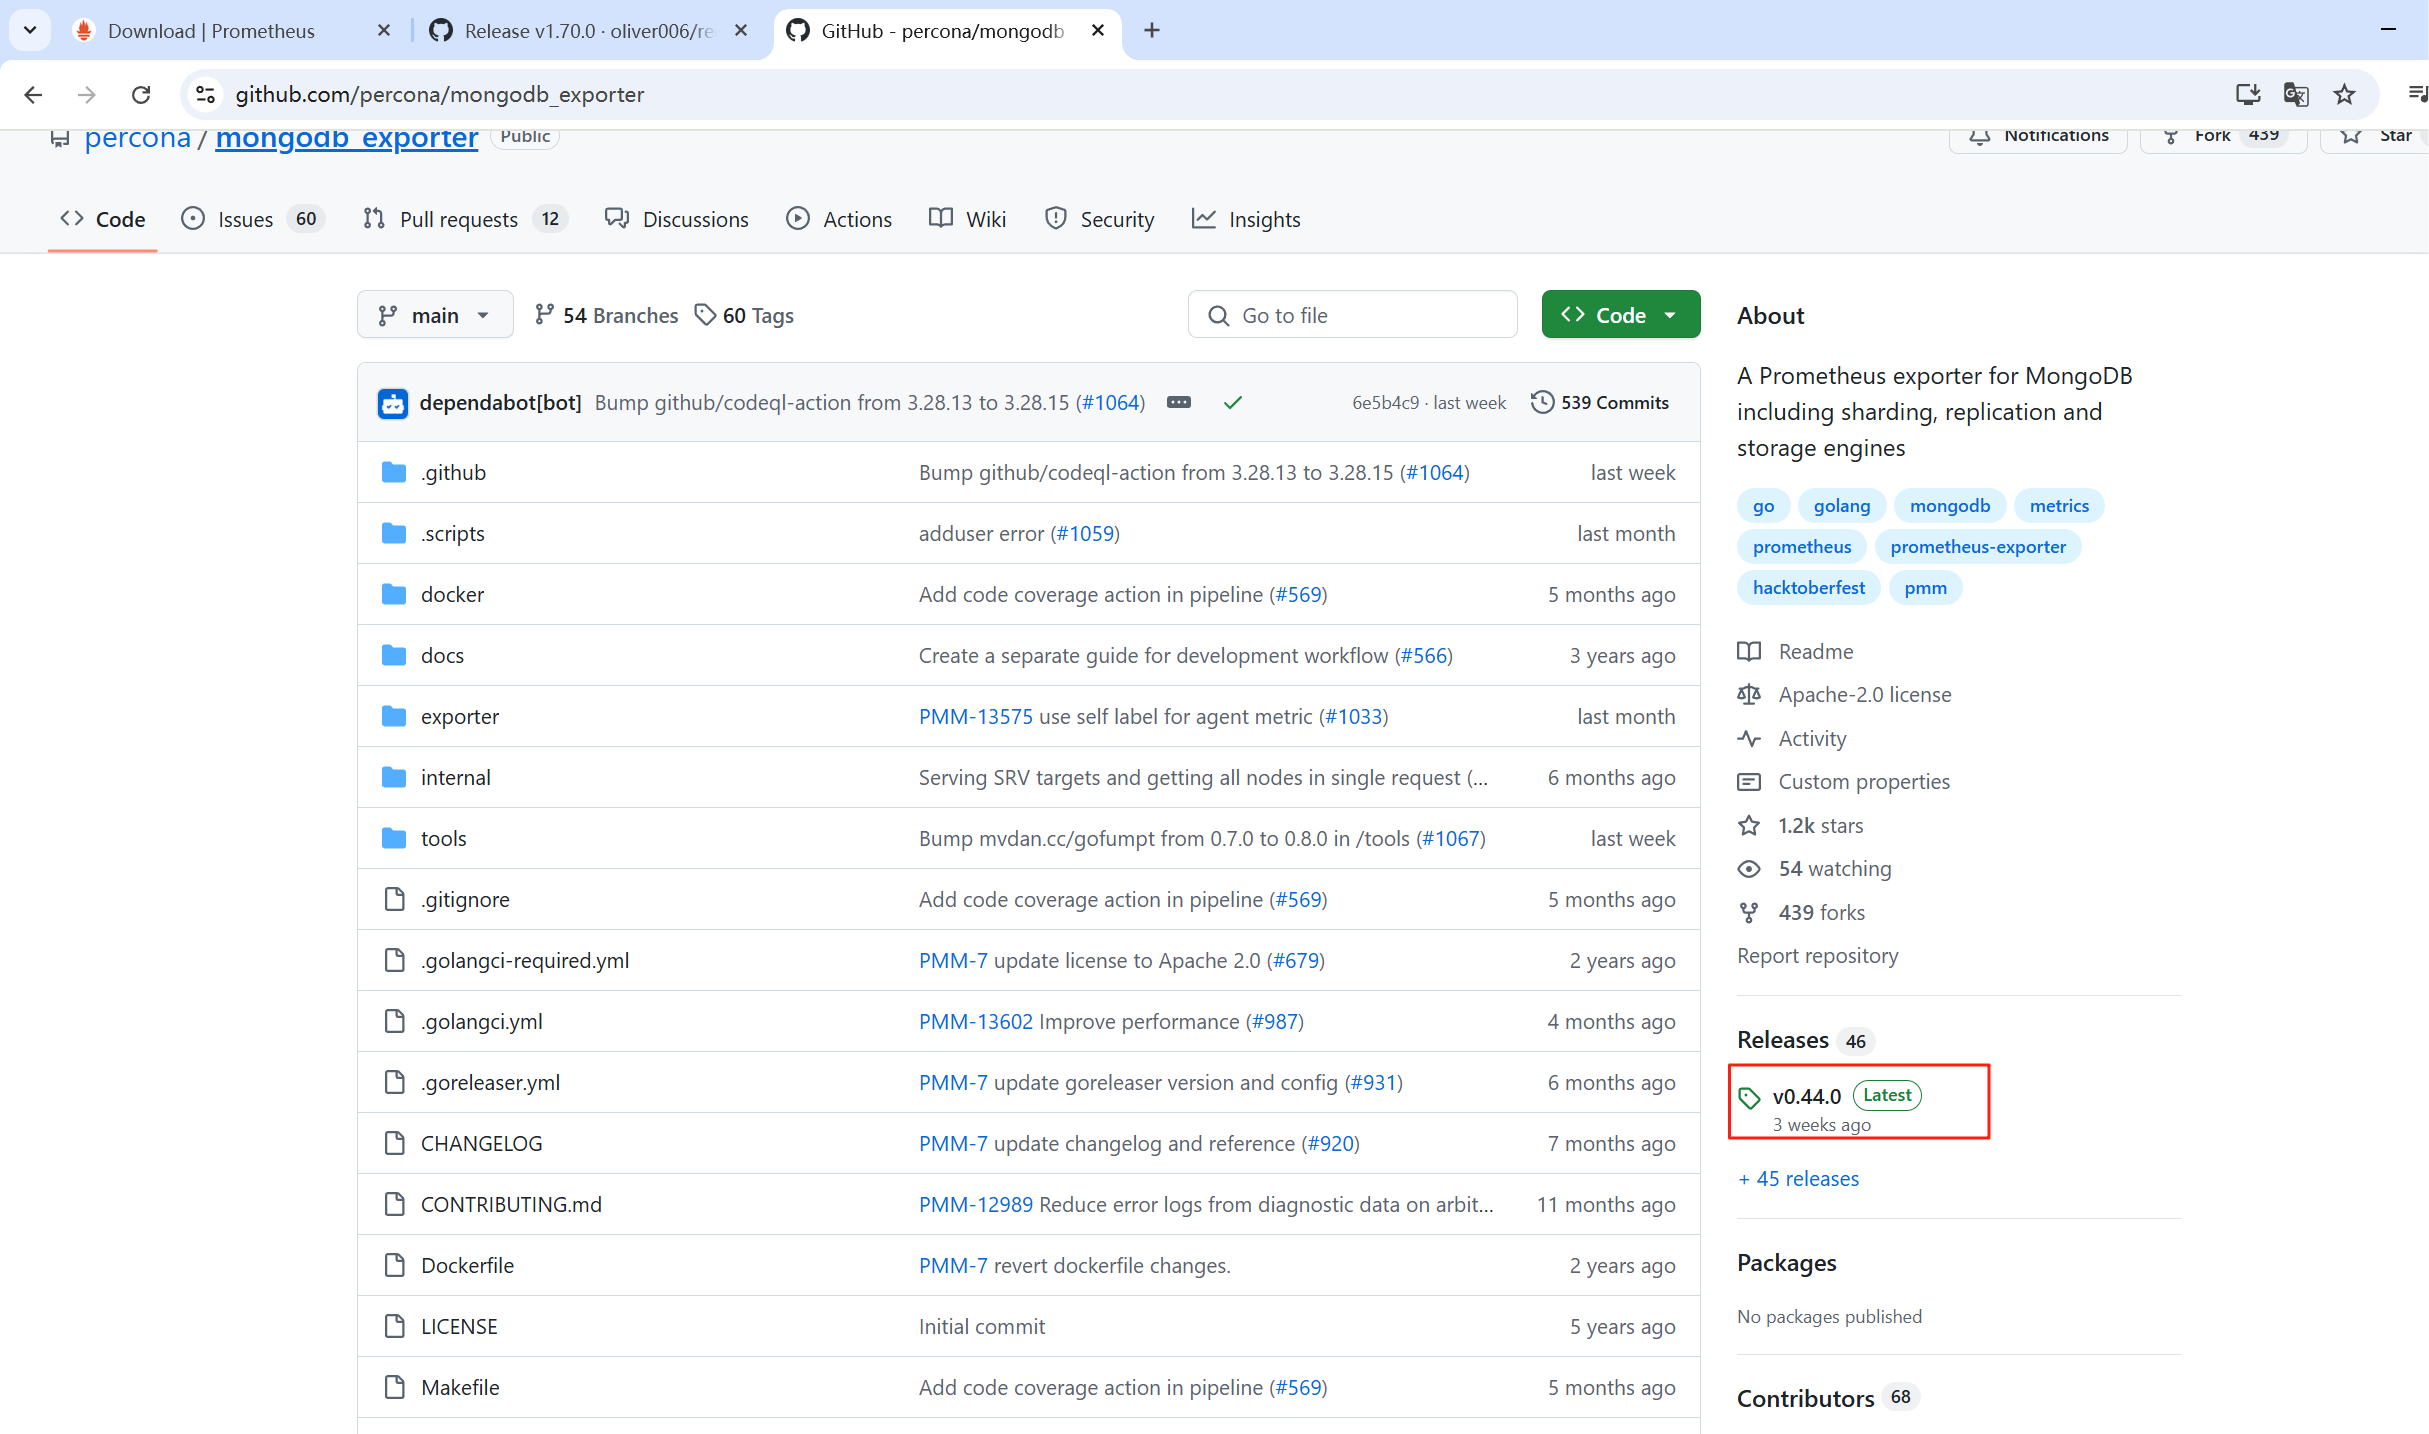
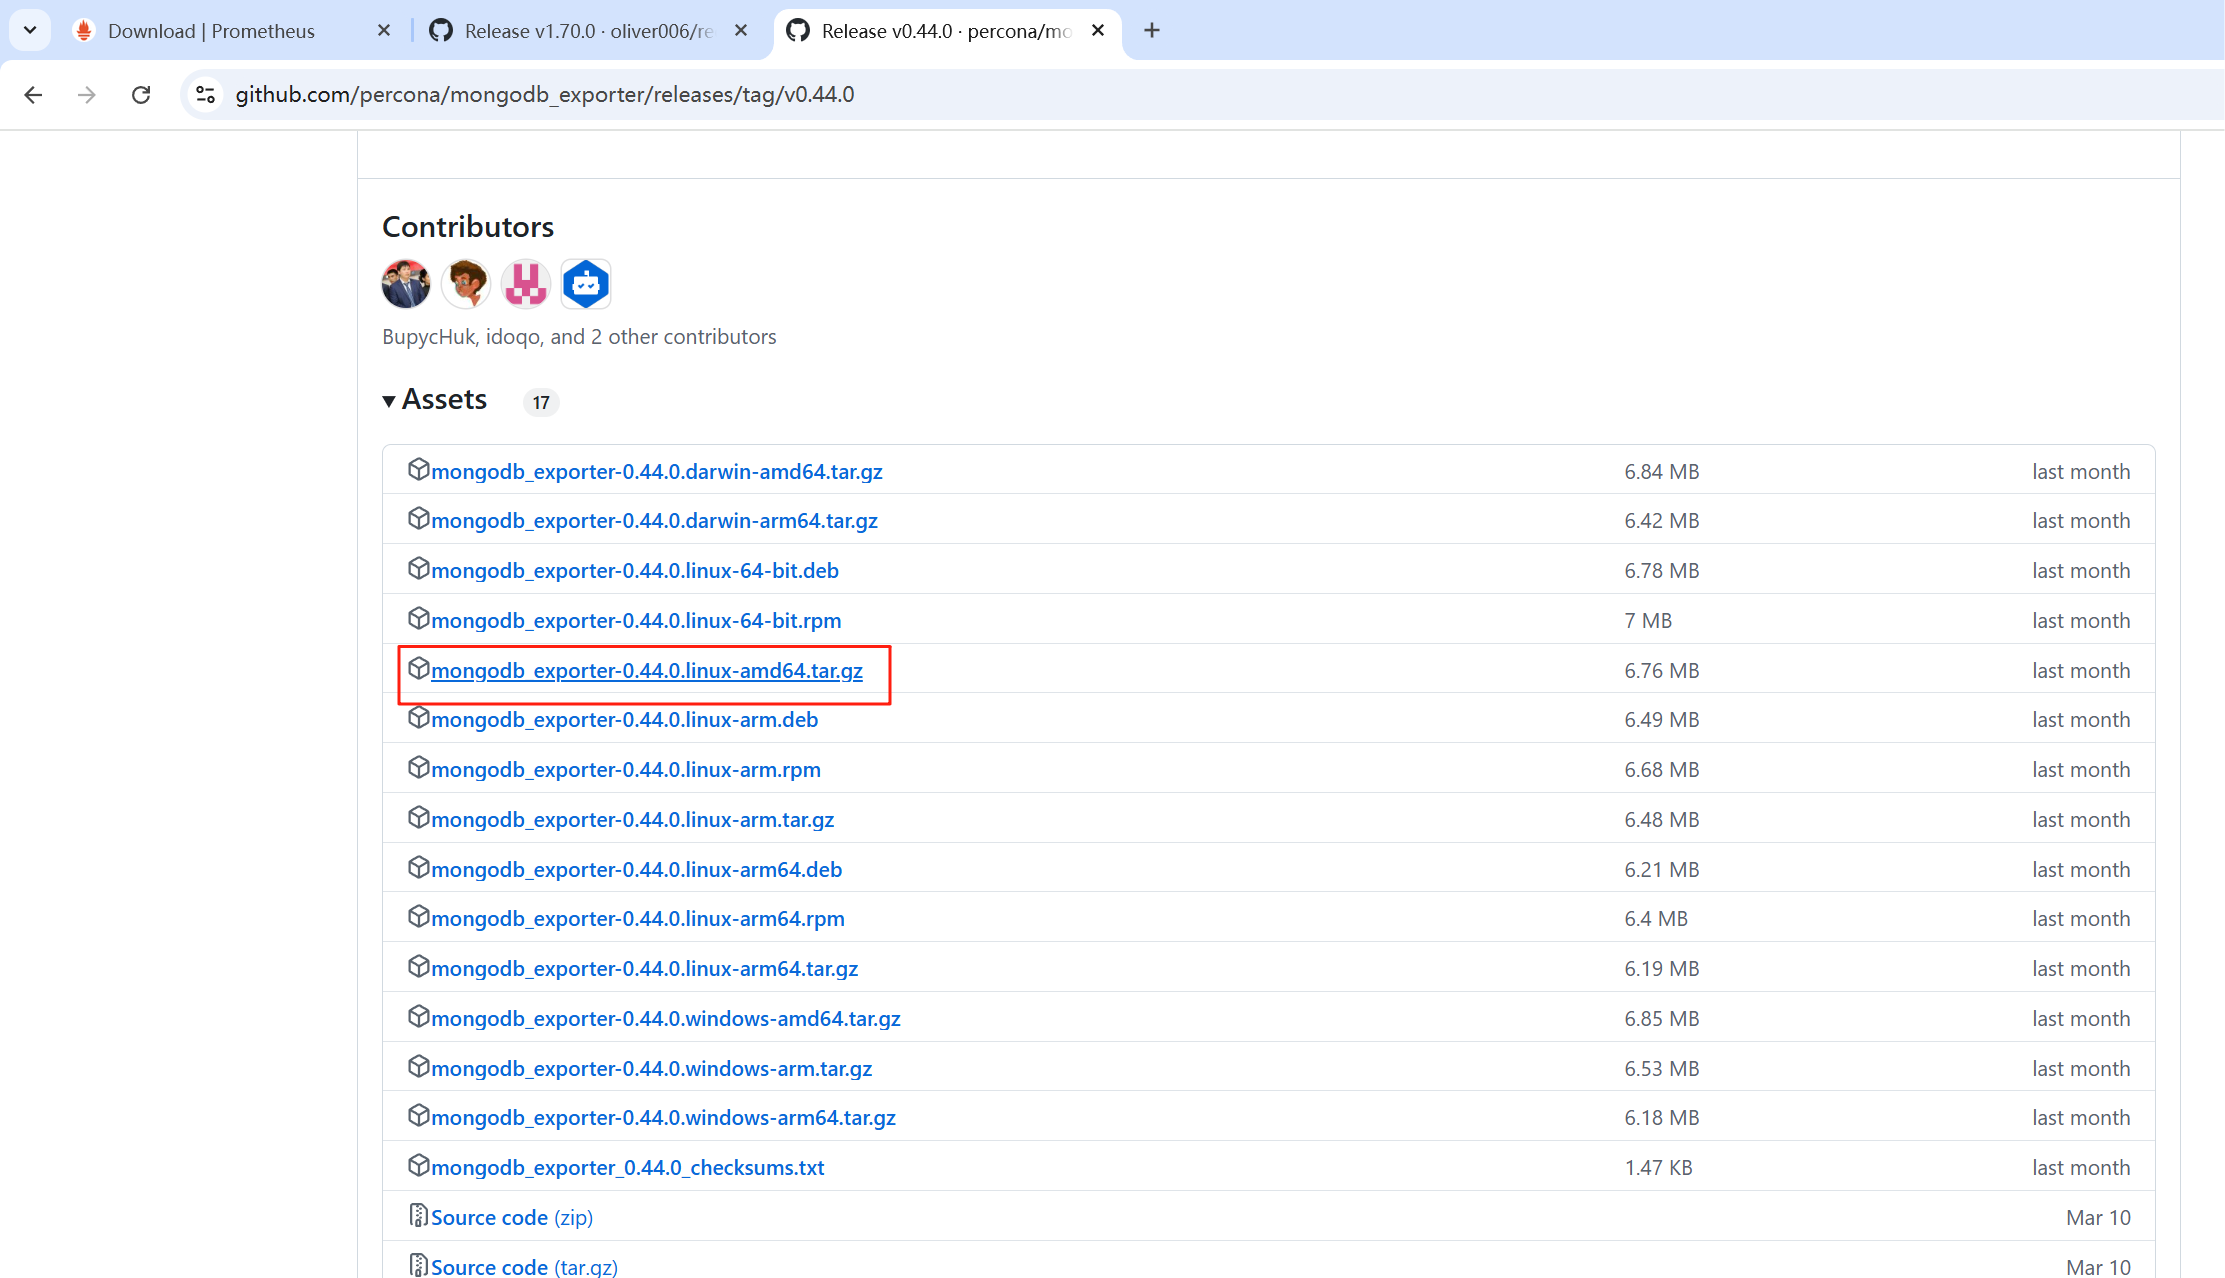
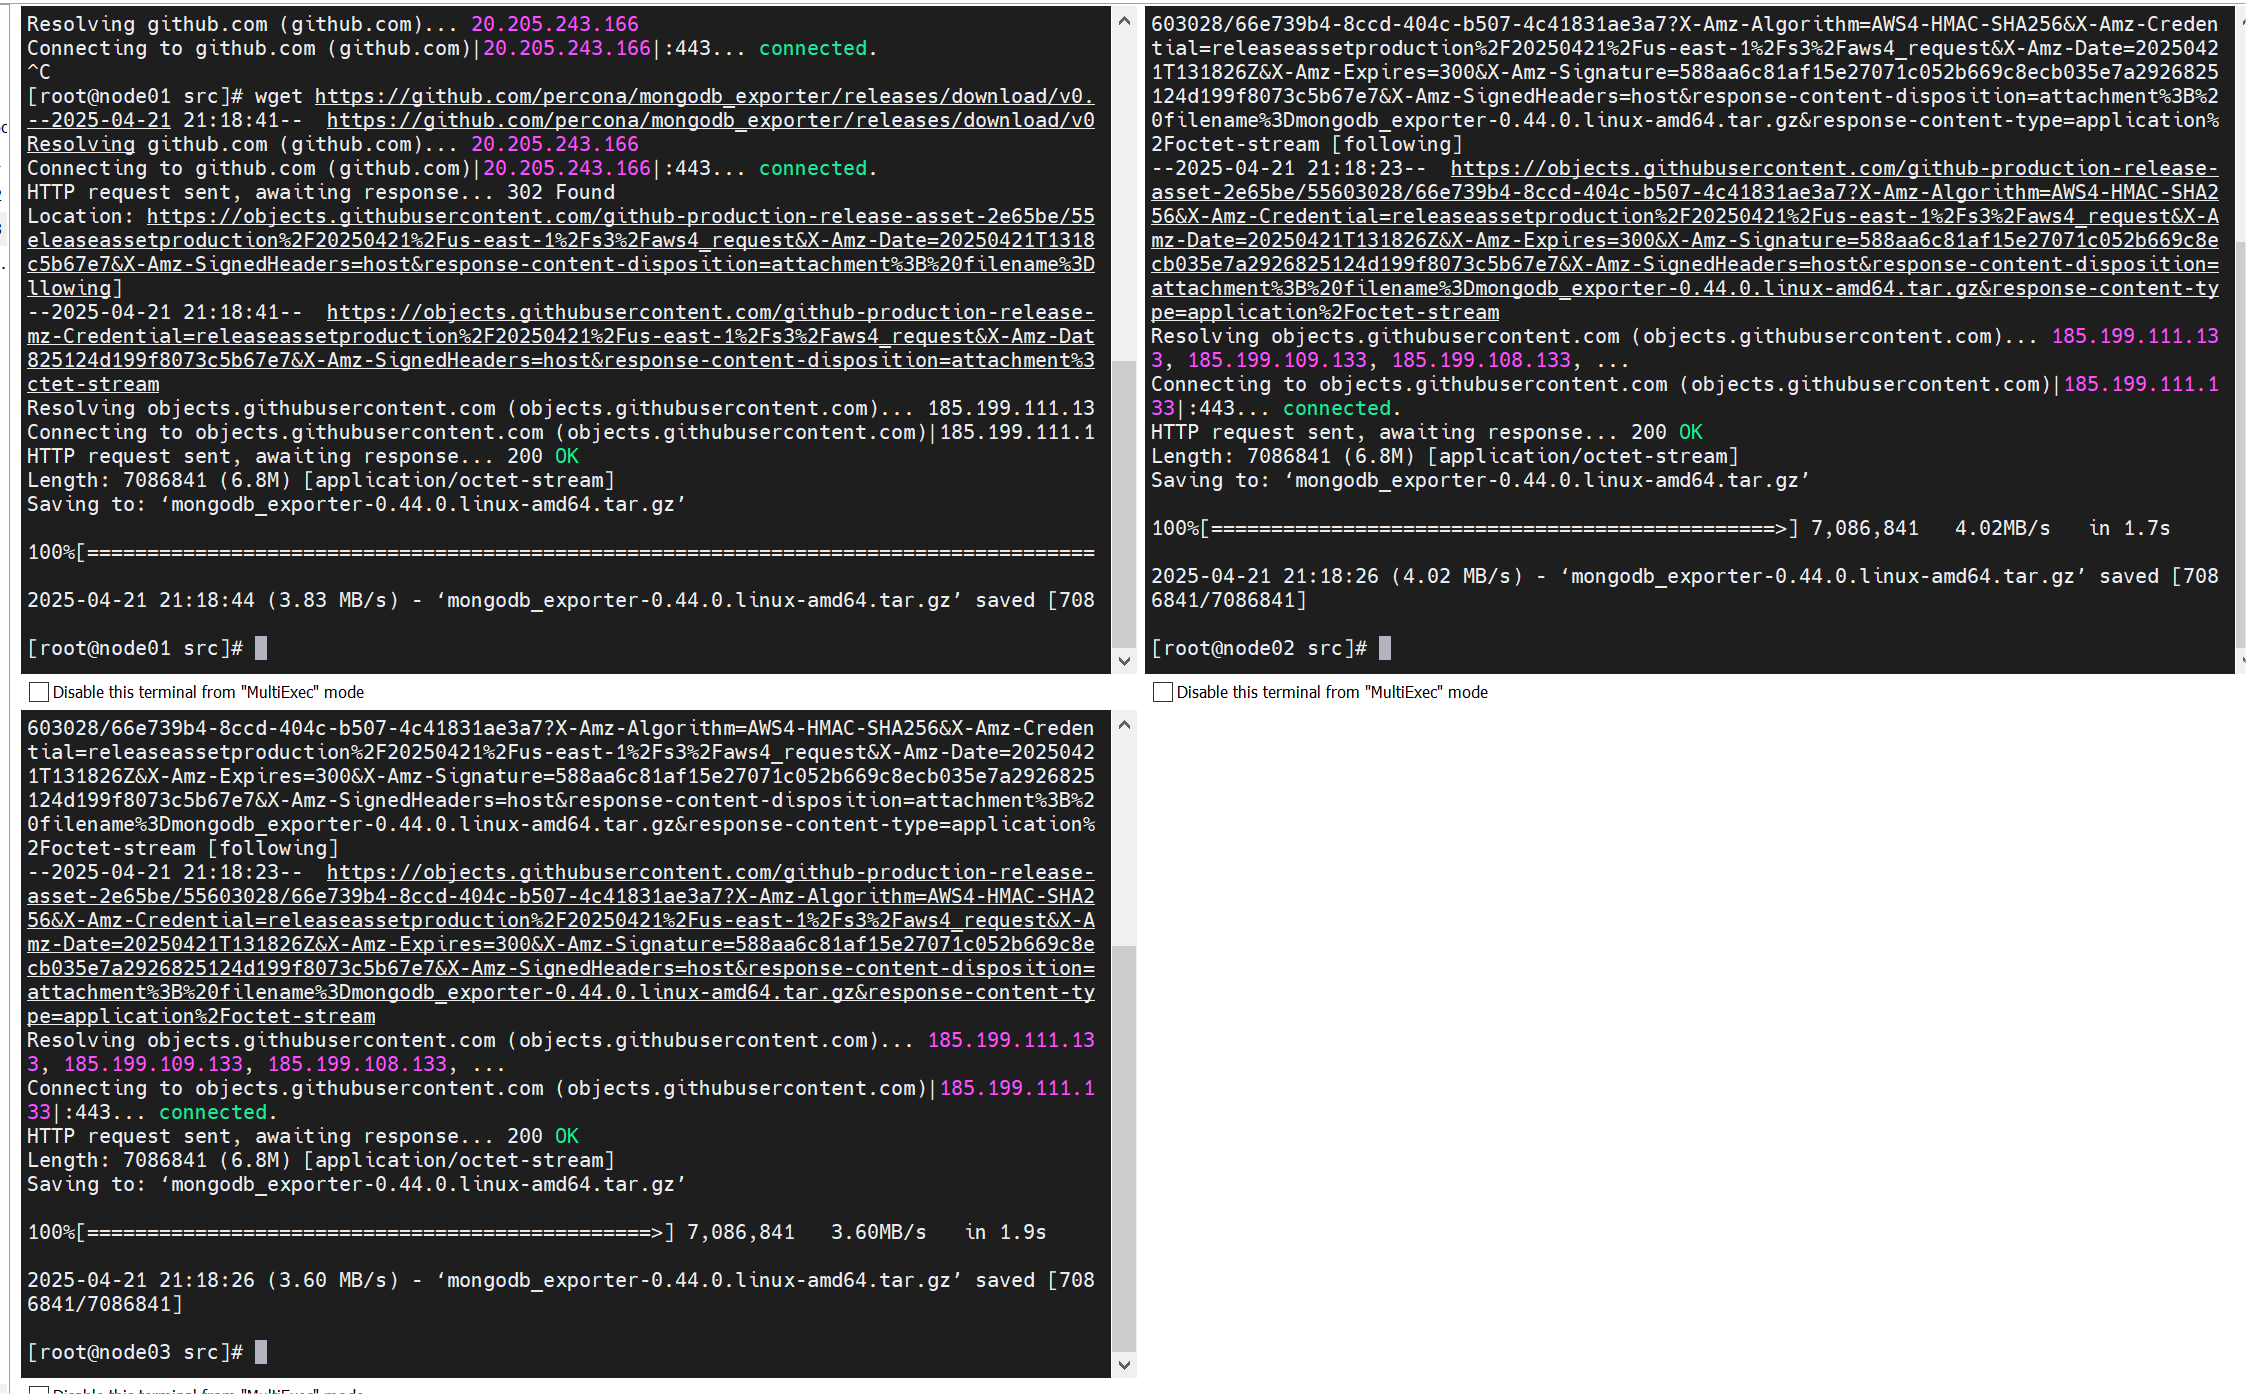
2、进行下载
这里只需要在161、162节点进行下载安装,因为163节点是仲裁节点不需要进行安装。
cd /usr/src/
wget https://github.com/percona/mongodb_exporter/releases/download/v0.44.0/mongodb_exporter-0.44.0.linux-amd64.tar.gz
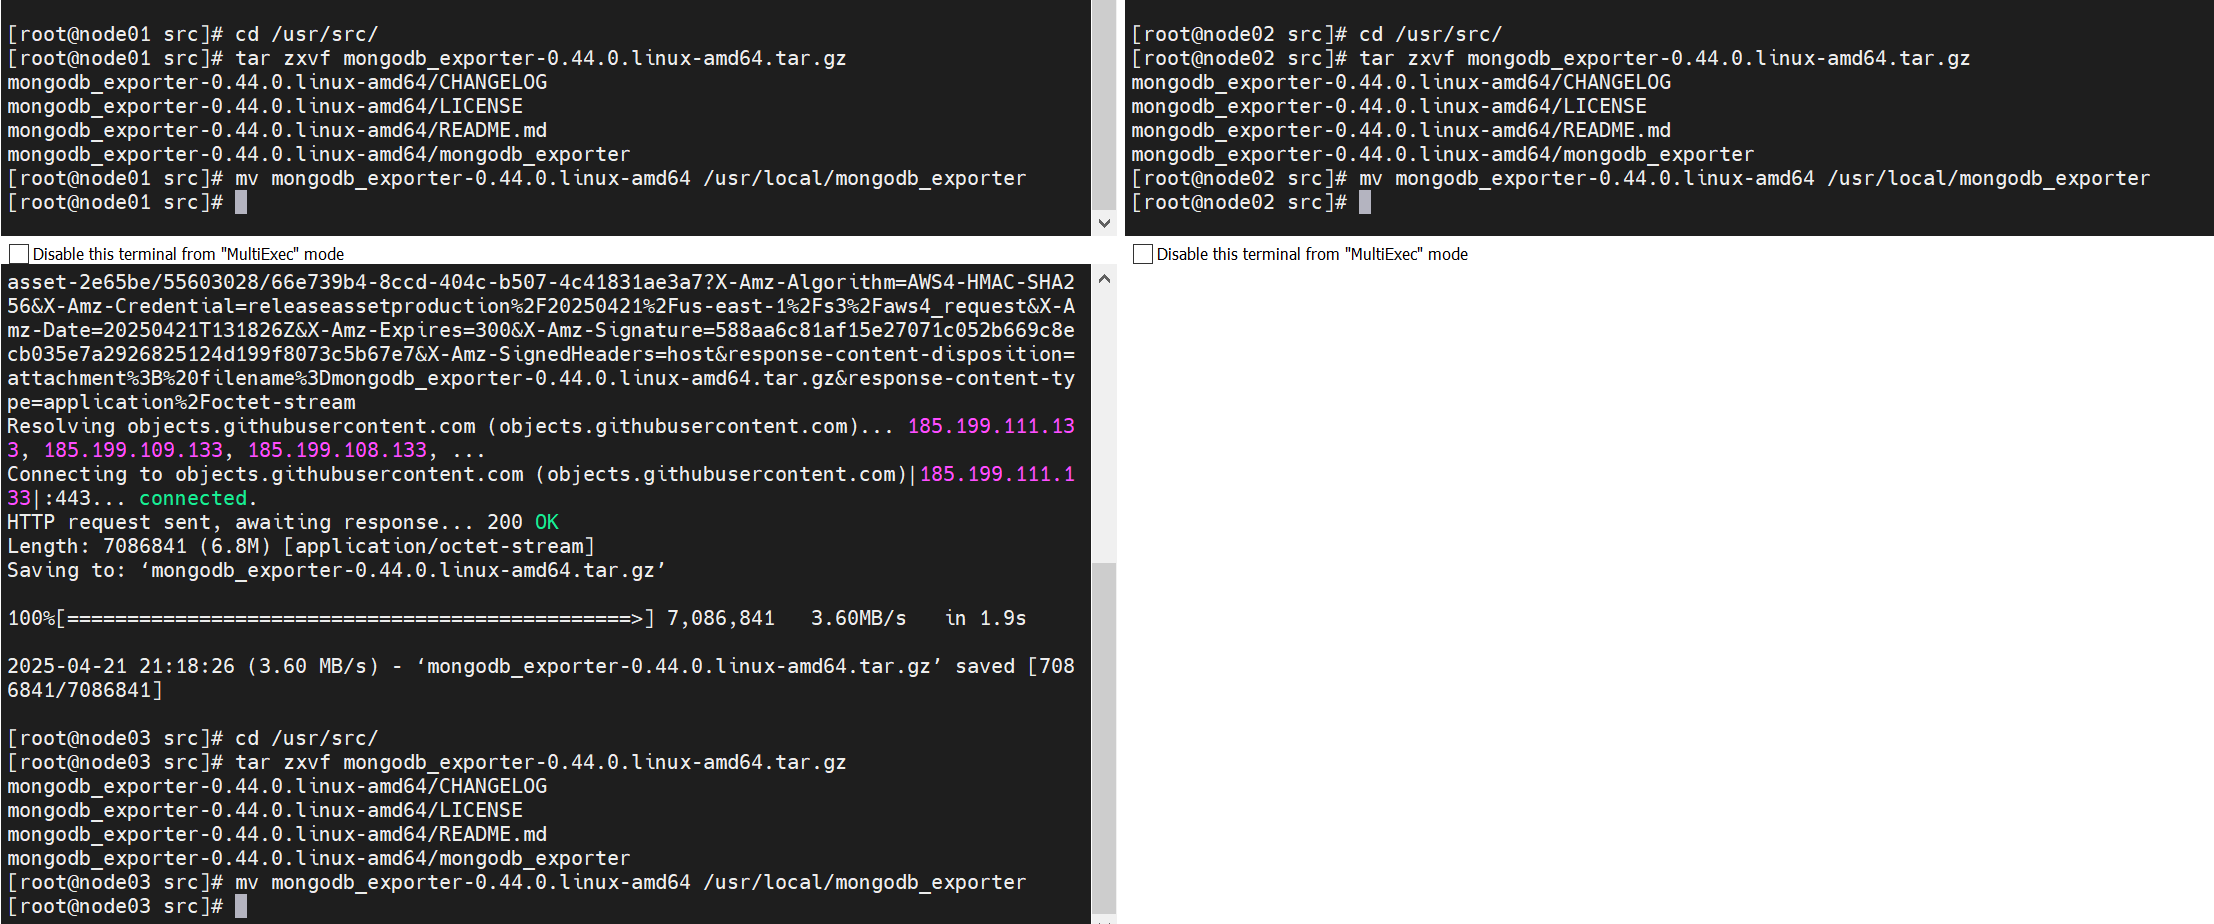
3、解压安装包
161、162节点执行
cd /usr/src/
tar zxvf mongodb_exporter-0.44.0.linux-amd64.tar.gz
mv mongodb_exporter-0.44.0.linux-amd64 /usr/local/mongodb_exporter
4、设置mongodb_exporter设置为系统服务
161、162节点执行
用户名:monitor_r
密码:admin
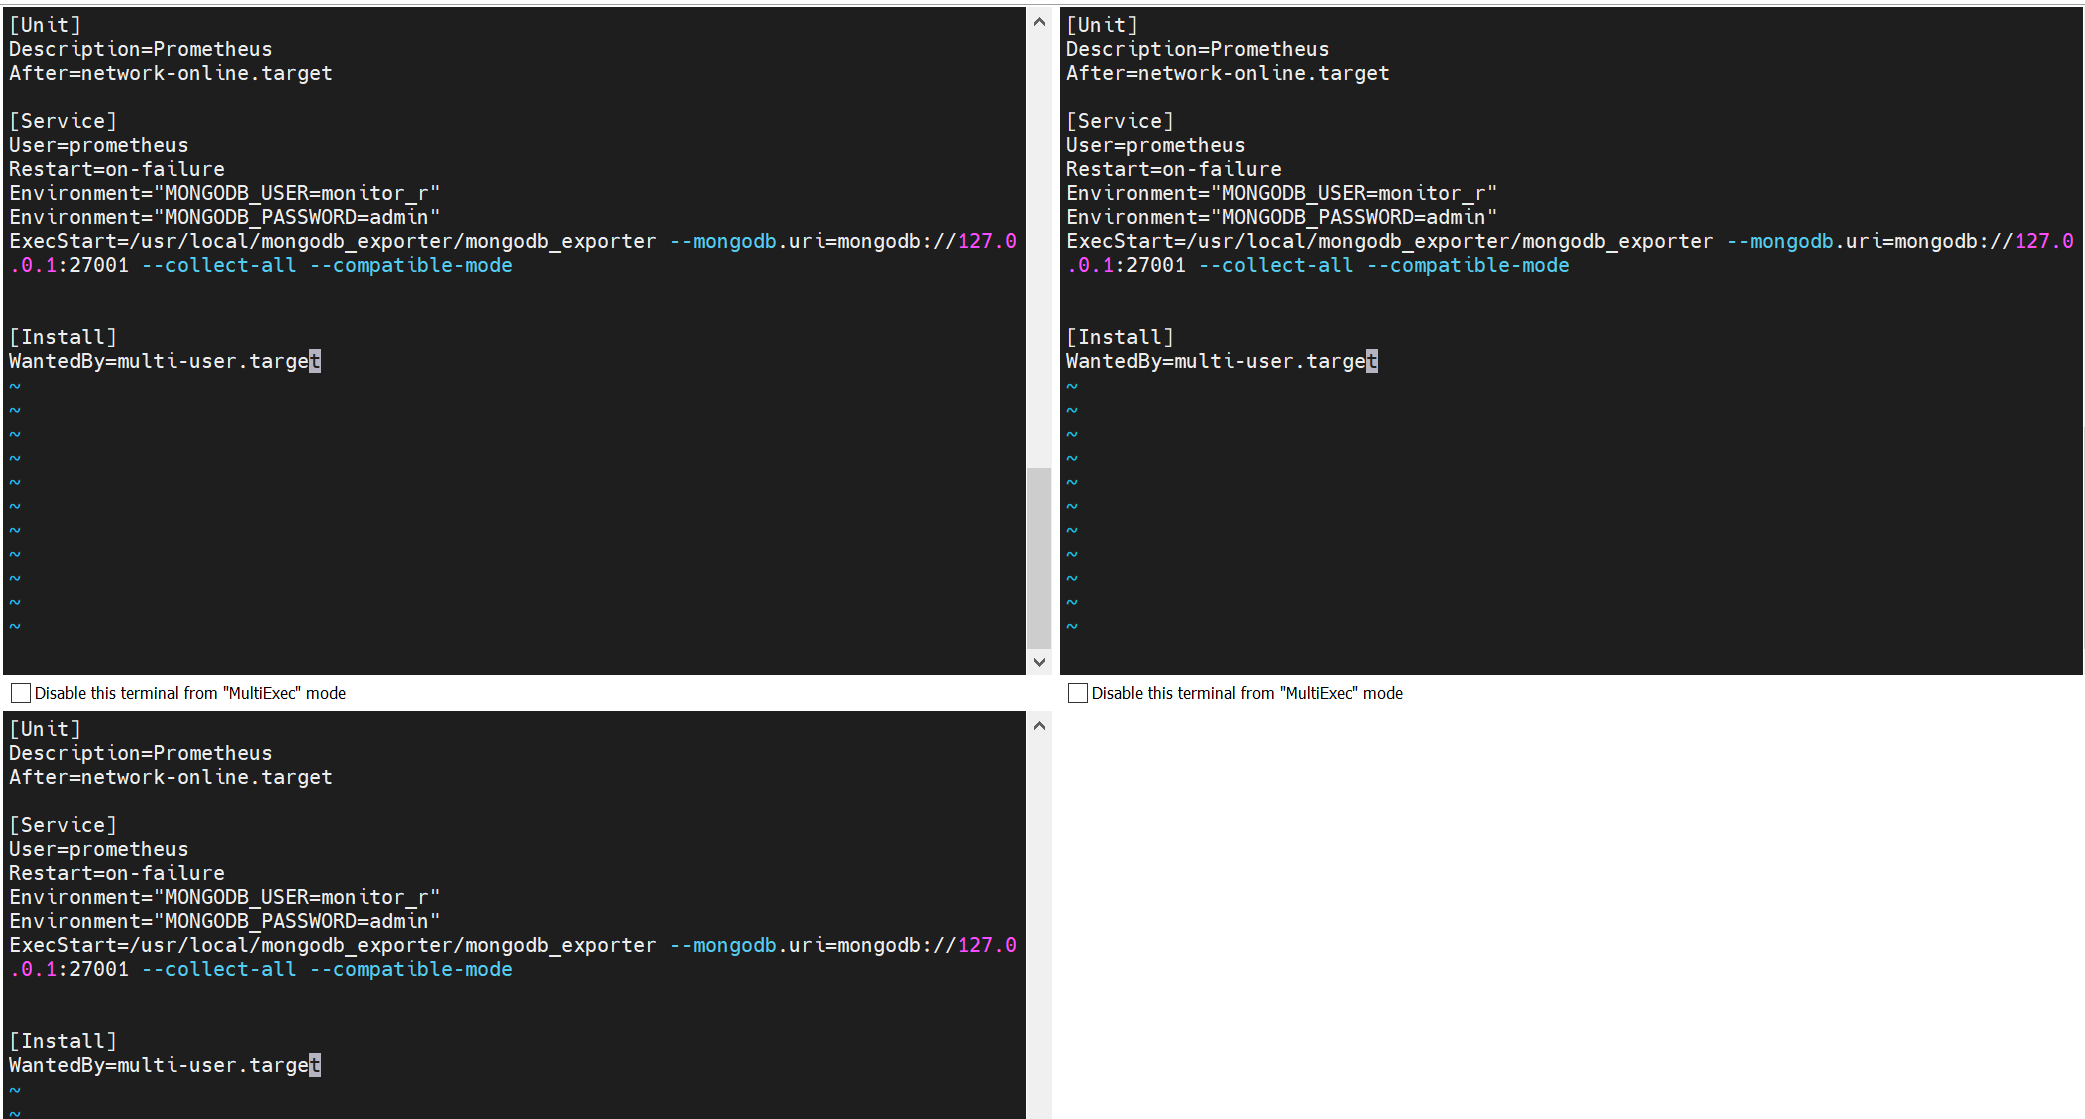
vim /etc/systemd/system/mongodb_exporter.service
添加如下内容:
[Unit]
Description=Prometheus
After=network-online.target

[Service]
User=prometheus
Restart=on-failure
Environment="MONGODB_USER=monitor_r"
Environment="MONGODB_PASSWORD=admin"
ExecStart=/usr/local/mongodb_exporter/mongodb_exporter --mongodb.uri=mongodb://127.0.0.1:27001 --collect-all --compatible-mode


[Install]
WantedBy=multi-user.target
5、创建监控用户
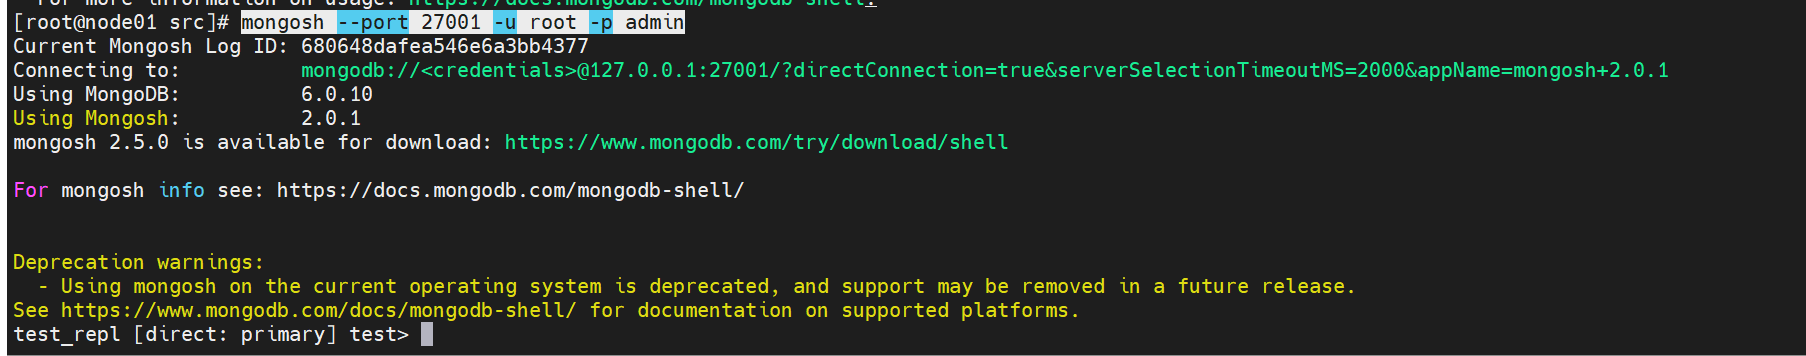
(1)使用管理员用户进行登录
在主节点,我这里是在161节点使用管理员进行登录
mongosh --port 27001 -u root -p admin
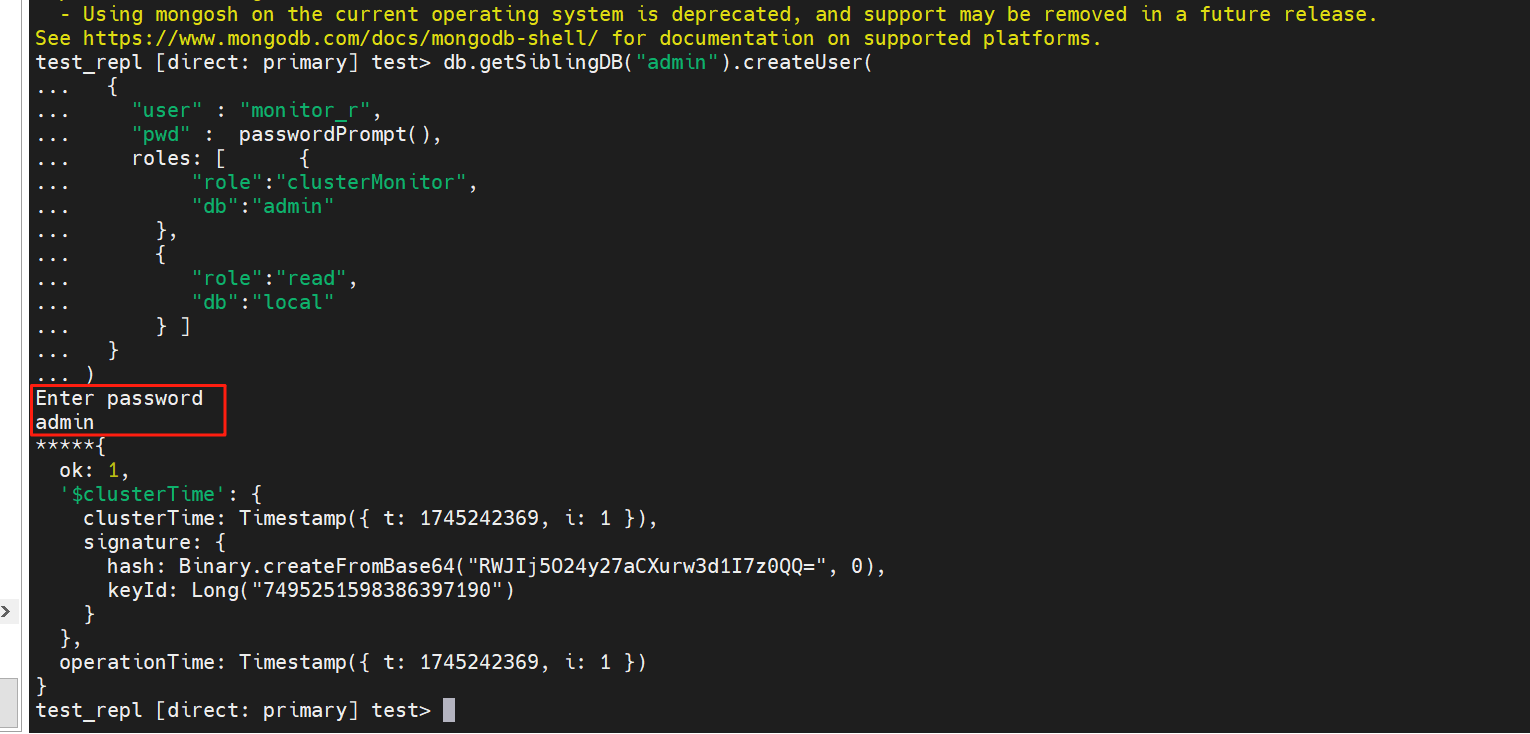
(2)创建监控用户
db.getSiblingDB("admin").createUser(
  {
    "user" : "monitor_r",
    "pwd" :  passwordPrompt(),
    roles: [      {
         "role":"clusterMonitor",
         "db":"admin"
      },
      {
         "role":"read",
         "db":"local"
      } ]
  }
)
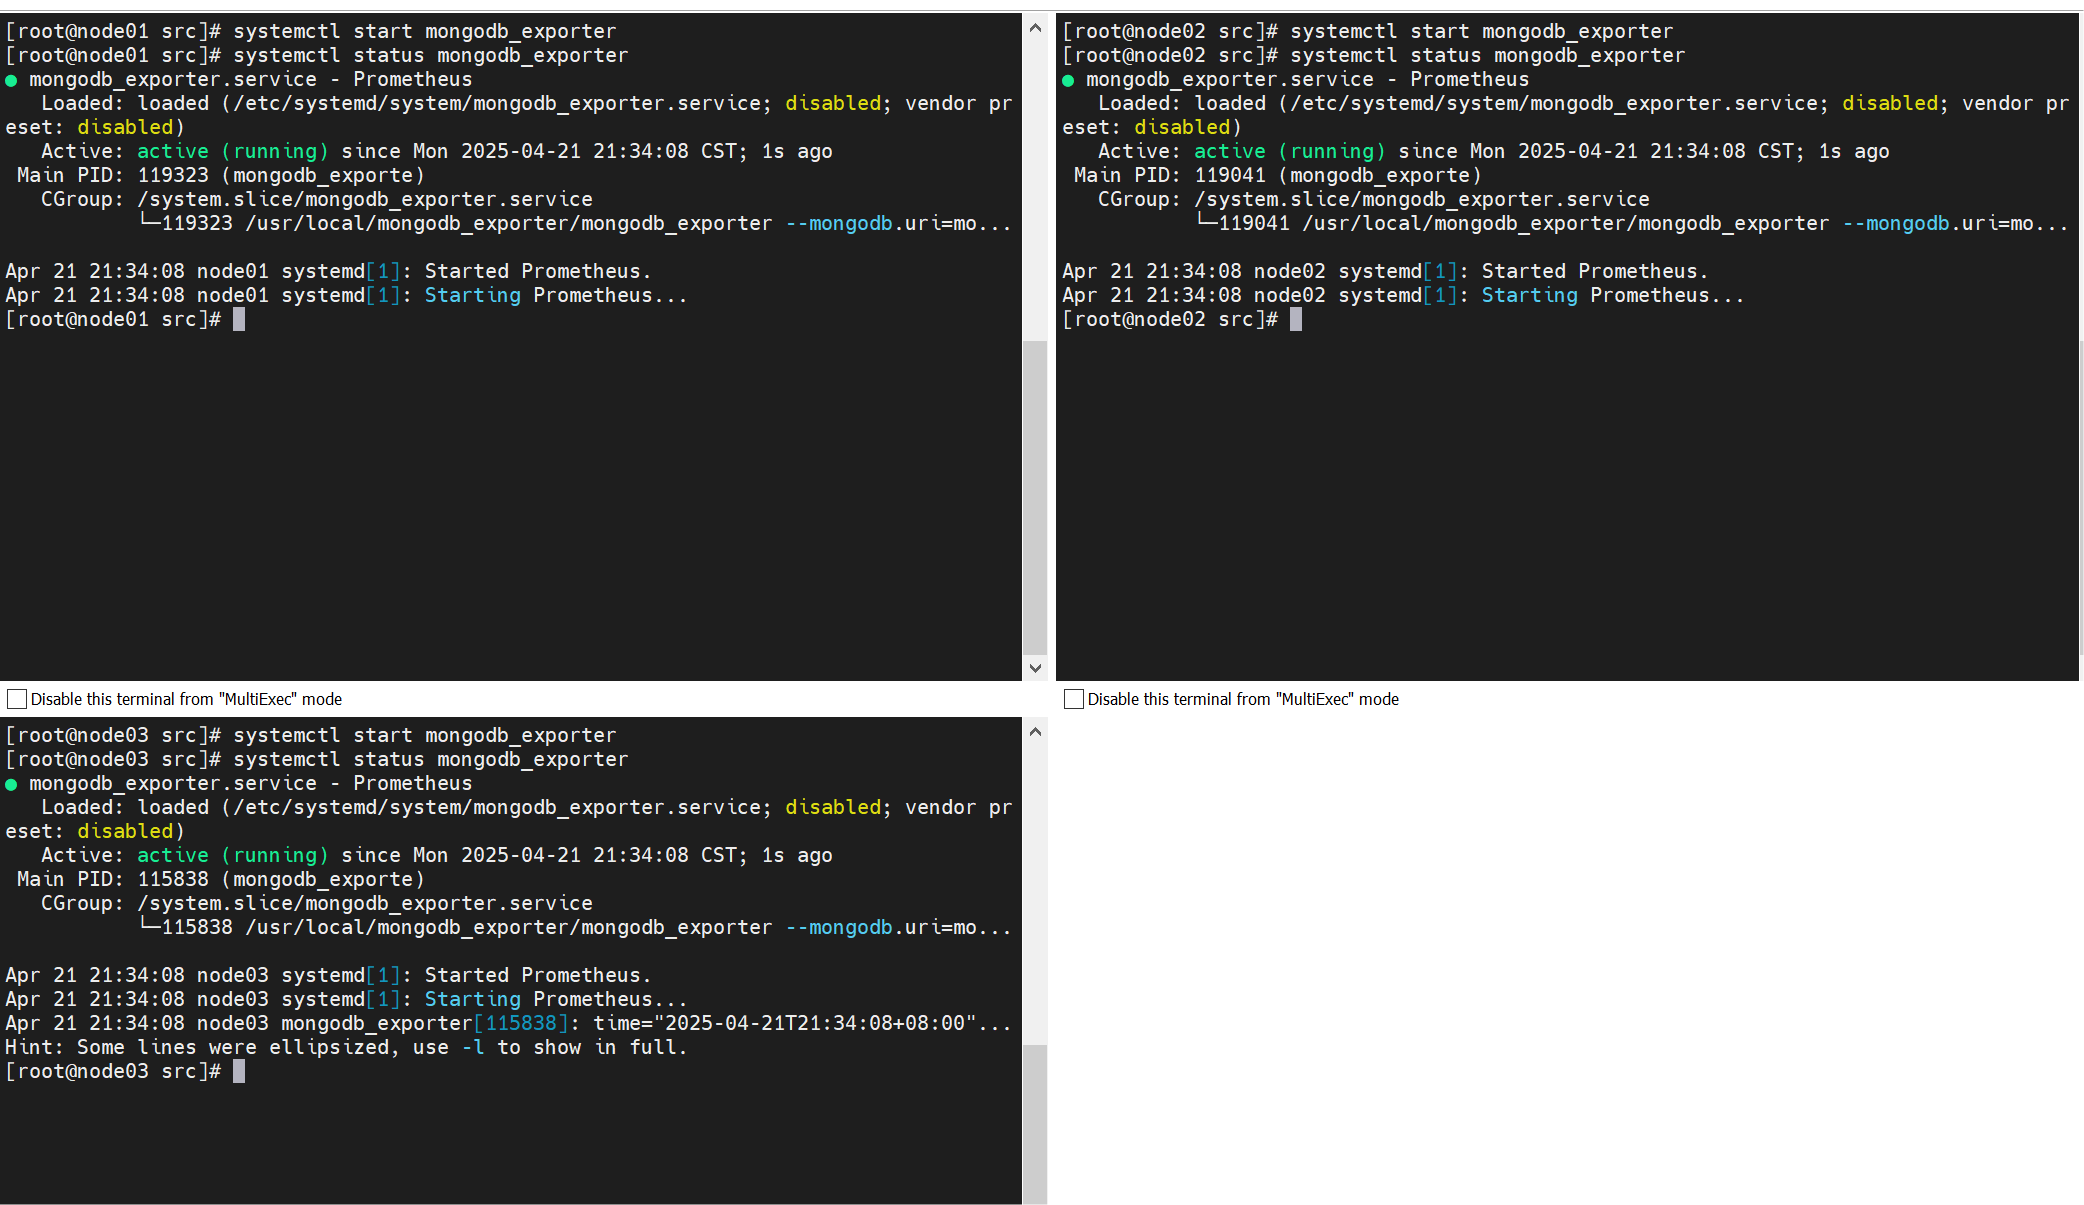
6、启动mongodb_exporter
161、162节点执行
systemctl start mongodb_exporter
systemctl status mongodb_exporter
三、在Prometheus增加MongoDB监控配置
在165进行配置,当前prometheus部署在165节点
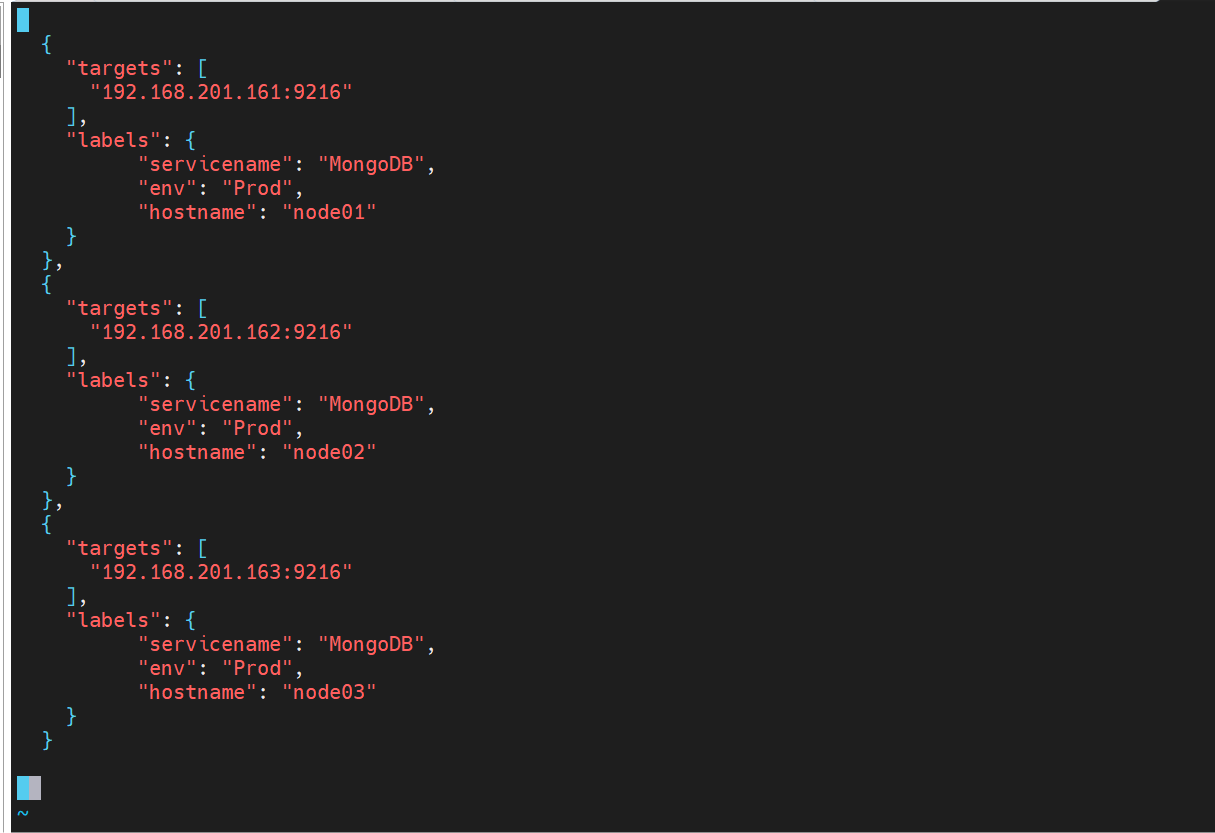
1、增加MongoDB实例配置
vim /usr/local/prometheus/conf.d/mongo.json
添加如下内容:
[
  {
    "targets": [
      "192.168.201.161:9216"
    ],
    "labels": {
          "servicename": "MongoDB",
          "env": "Prod",
          "hostname": "node01"
    }
  },
  {
    "targets": [
      "192.168.201.162:9216"
    ],
    "labels": {
          "servicename": "MongoDB",
          "env": "Prod",
          "hostname": "node02"
    }
  },
  {
    "targets": [
      "192.168.201.163:9216"
    ],
    "labels": {
          "servicename": "MongoDB",
          "env": "Prod",
          "hostname": "node03"
    }
  }

]
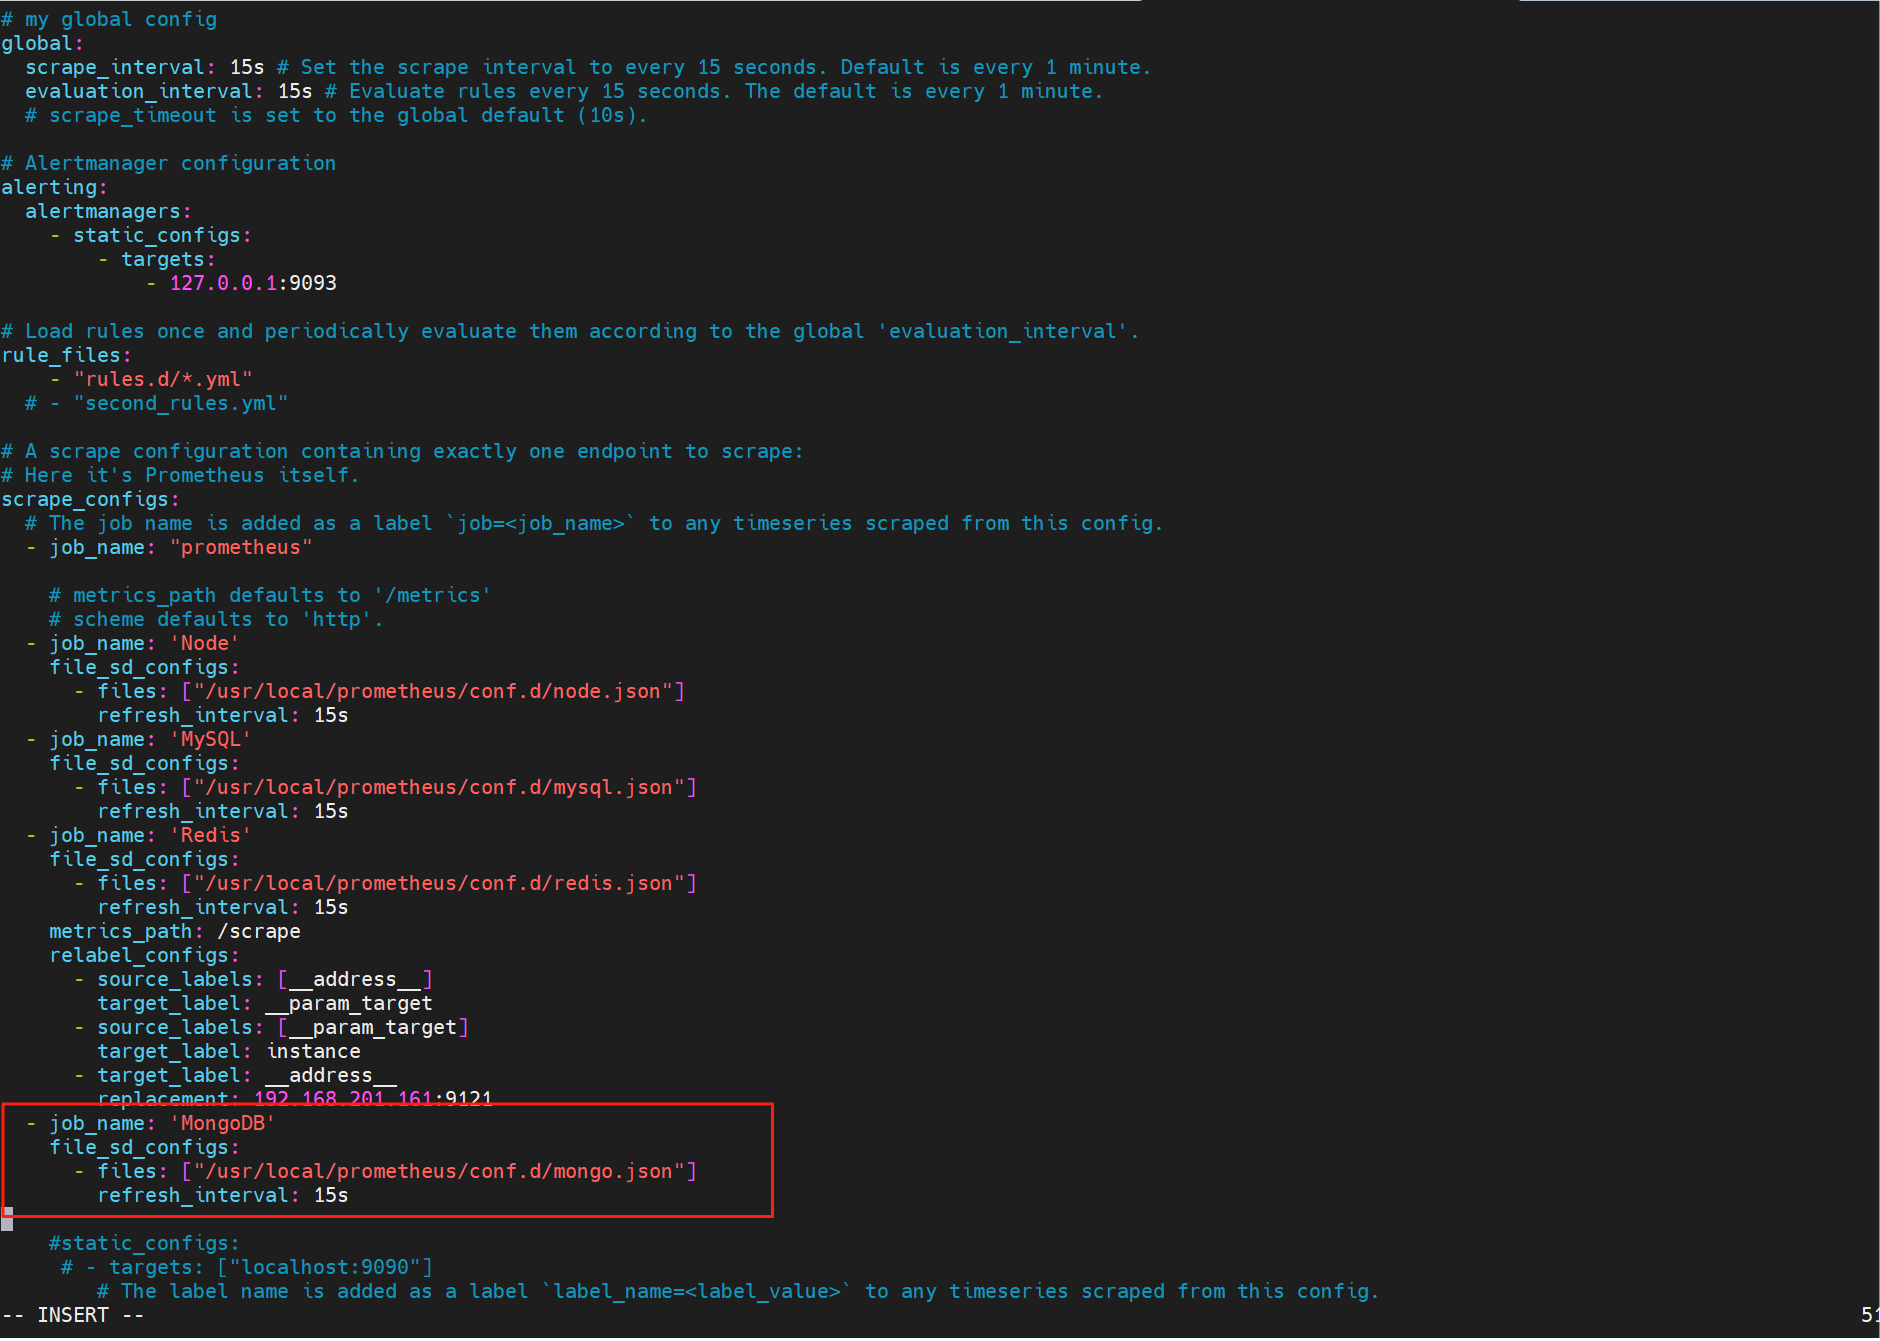
2、修改prometheus配置文件
vim /usr/local/prometheus/prometheus.yml
添加如下内容:
  - job_name: 'MongoDB'
    file_sd_configs:
      - files: ["/usr/local/prometheus/conf.d/mongo.json"]
        refresh_interval: 15s
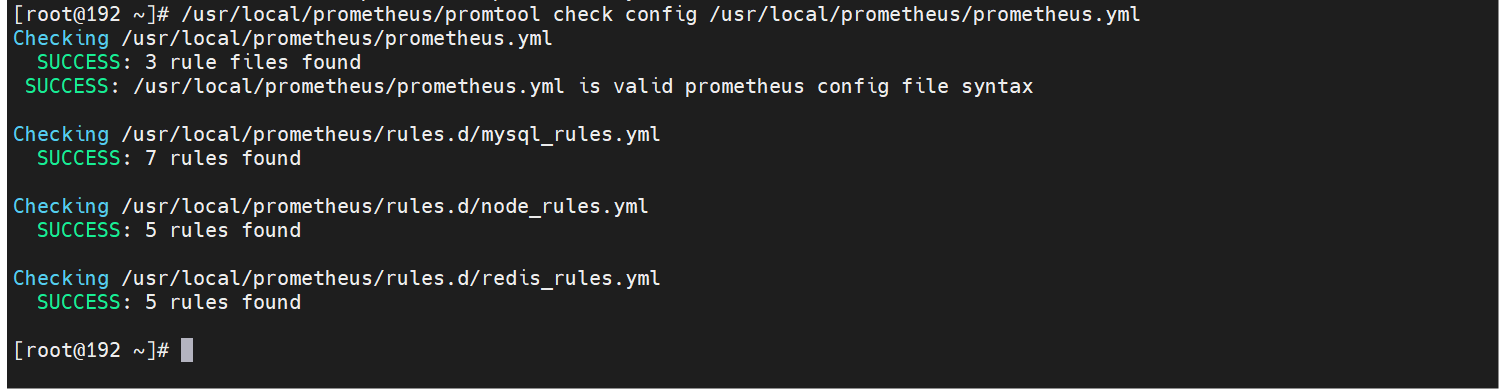
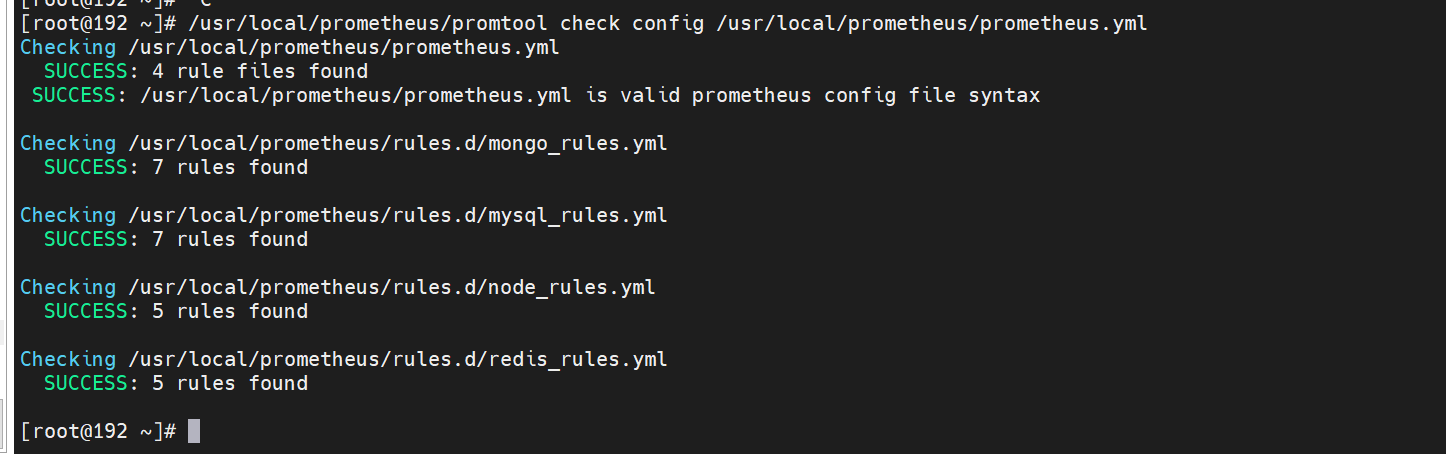
3、检查配置文件
/usr/local/prometheus/promtool check config /usr/local/prometheus/prometheus.yml
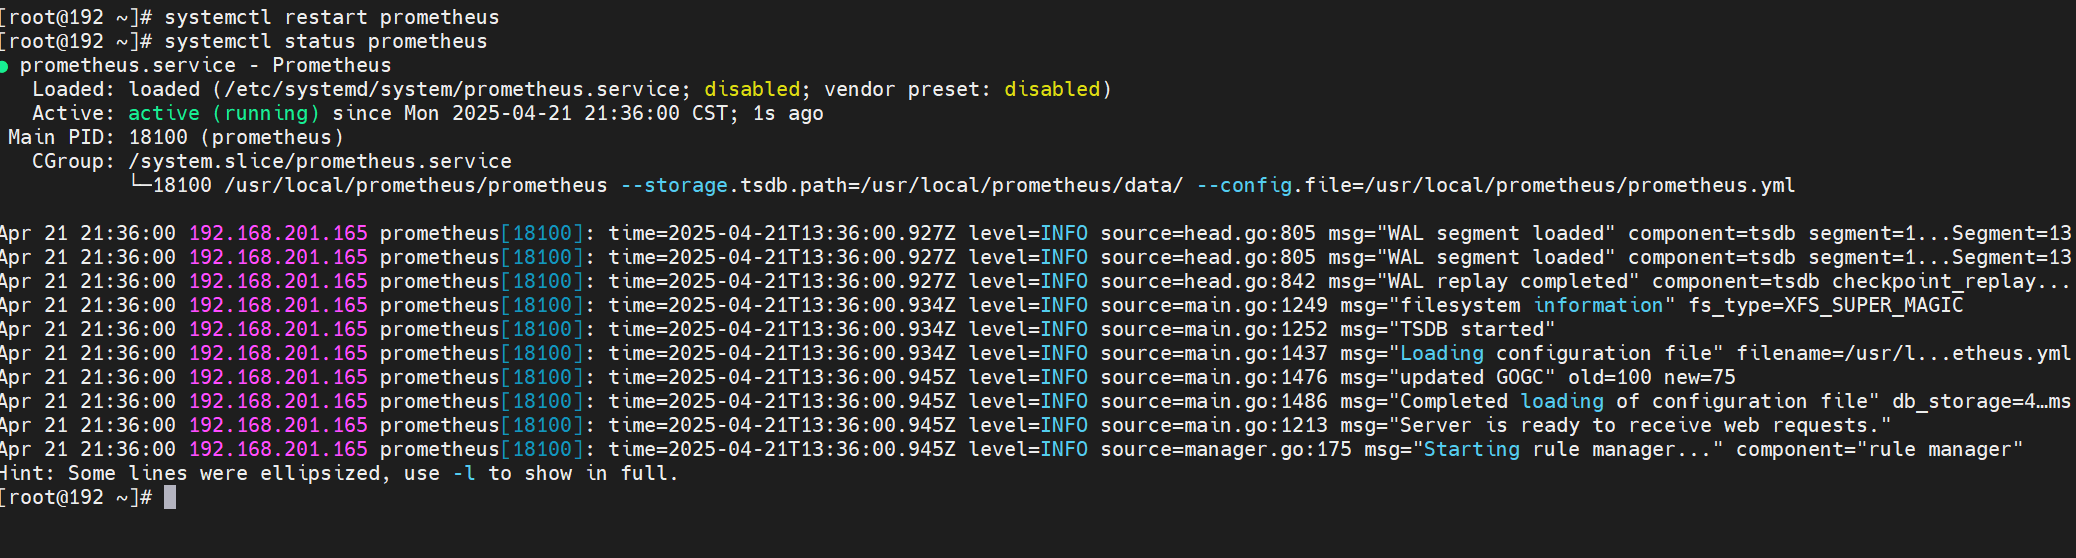
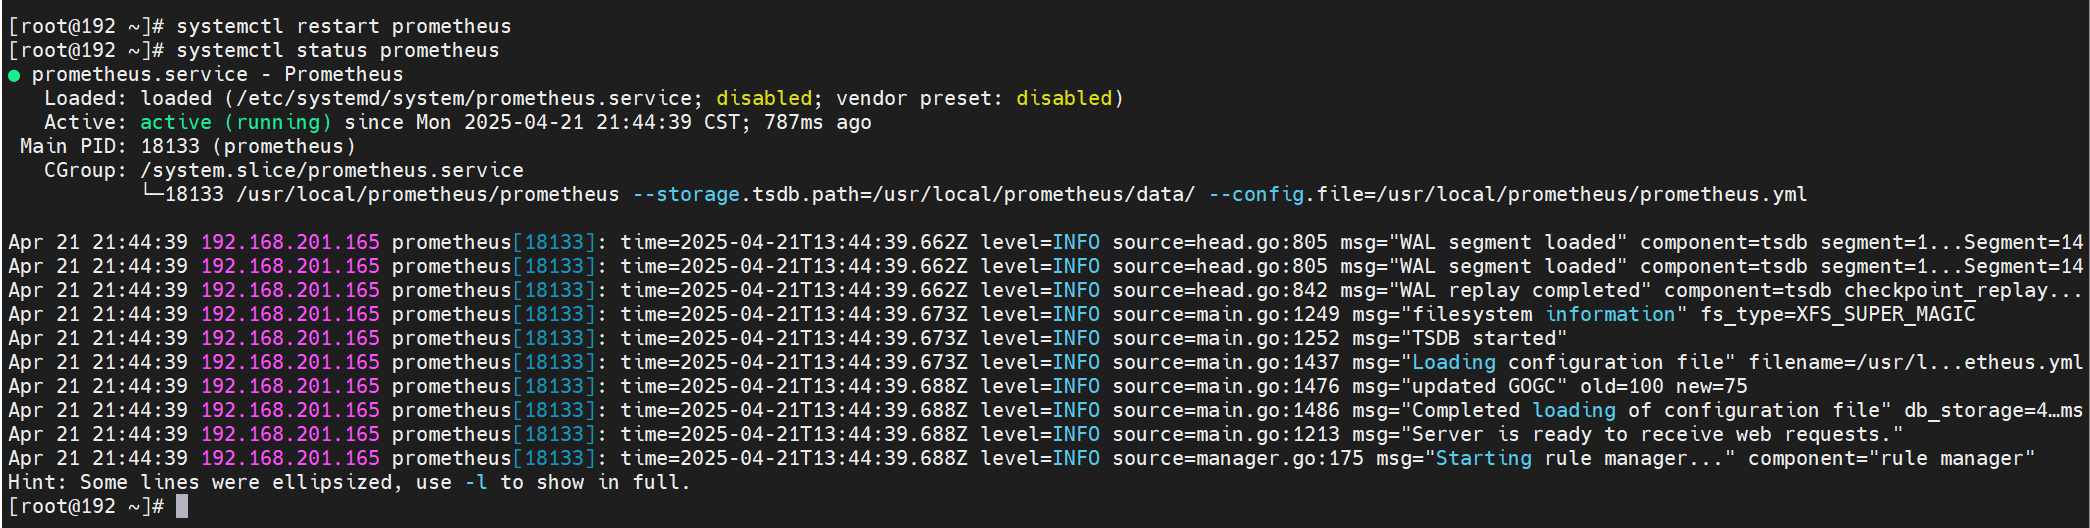
4、重启prometheus
systemctl restart prometheus
systemctl status prometheus
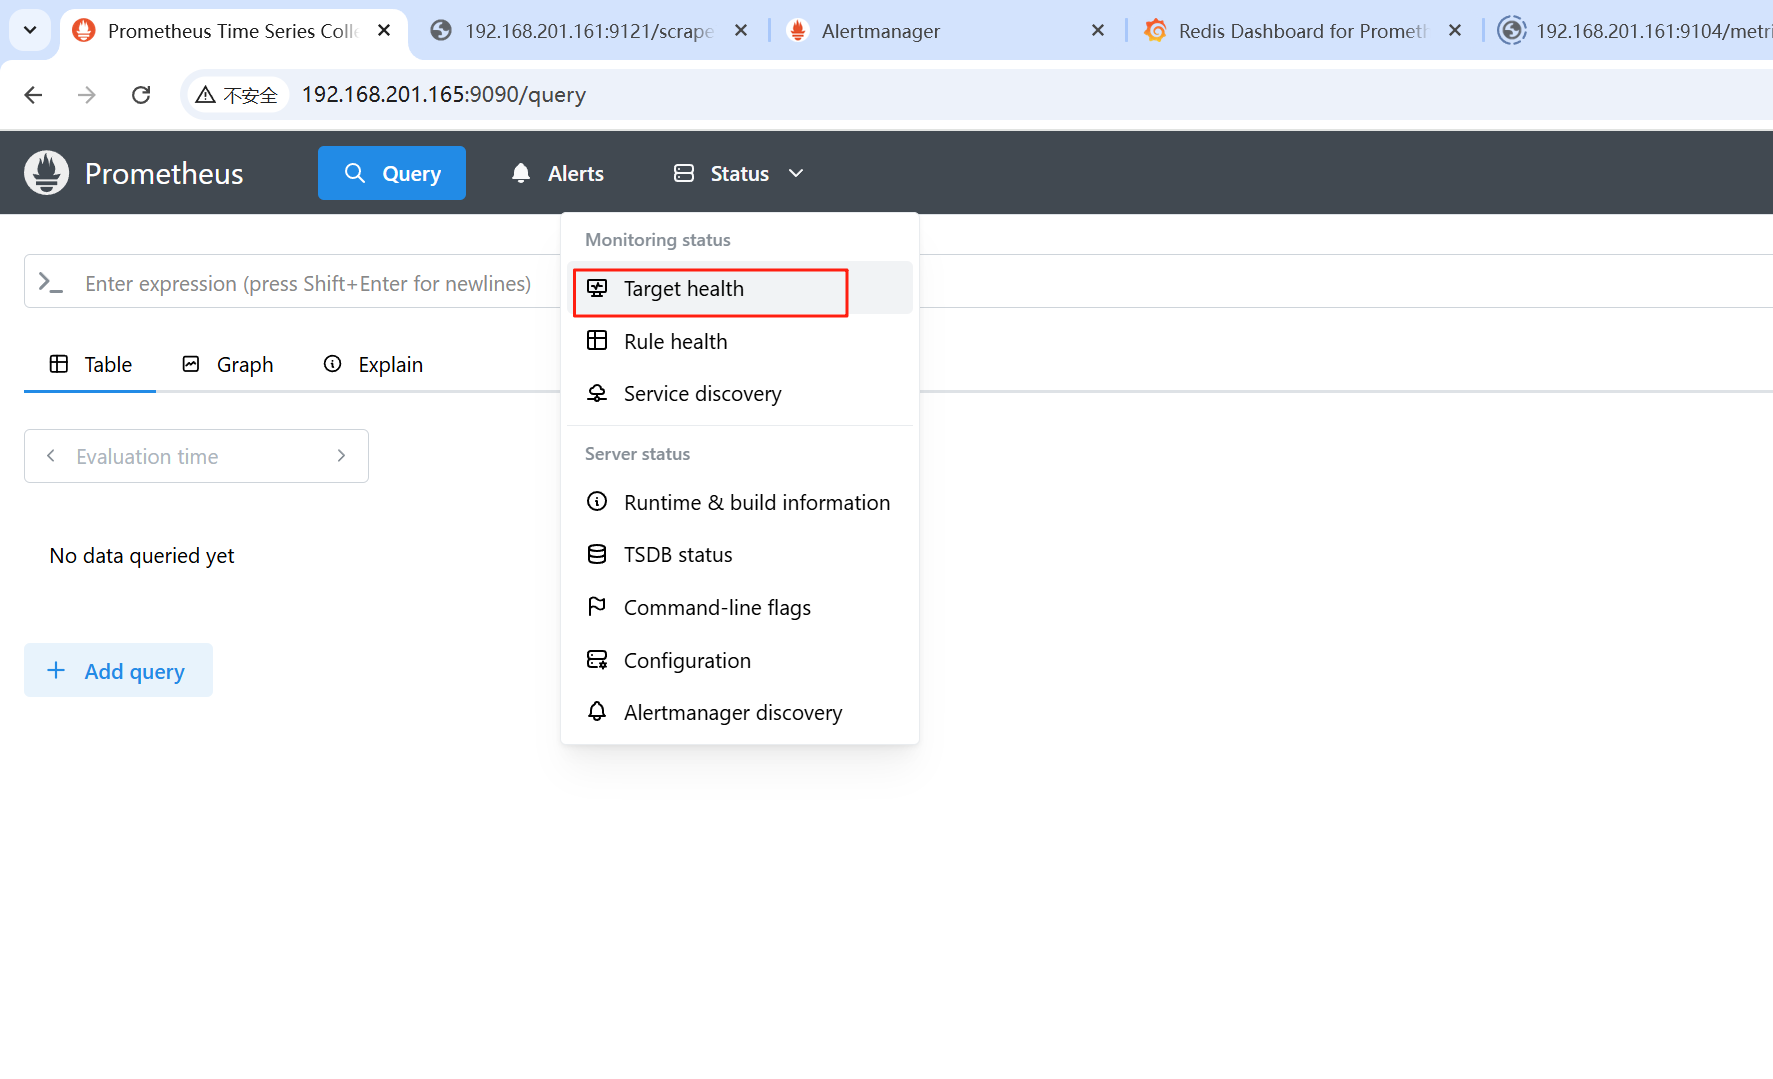
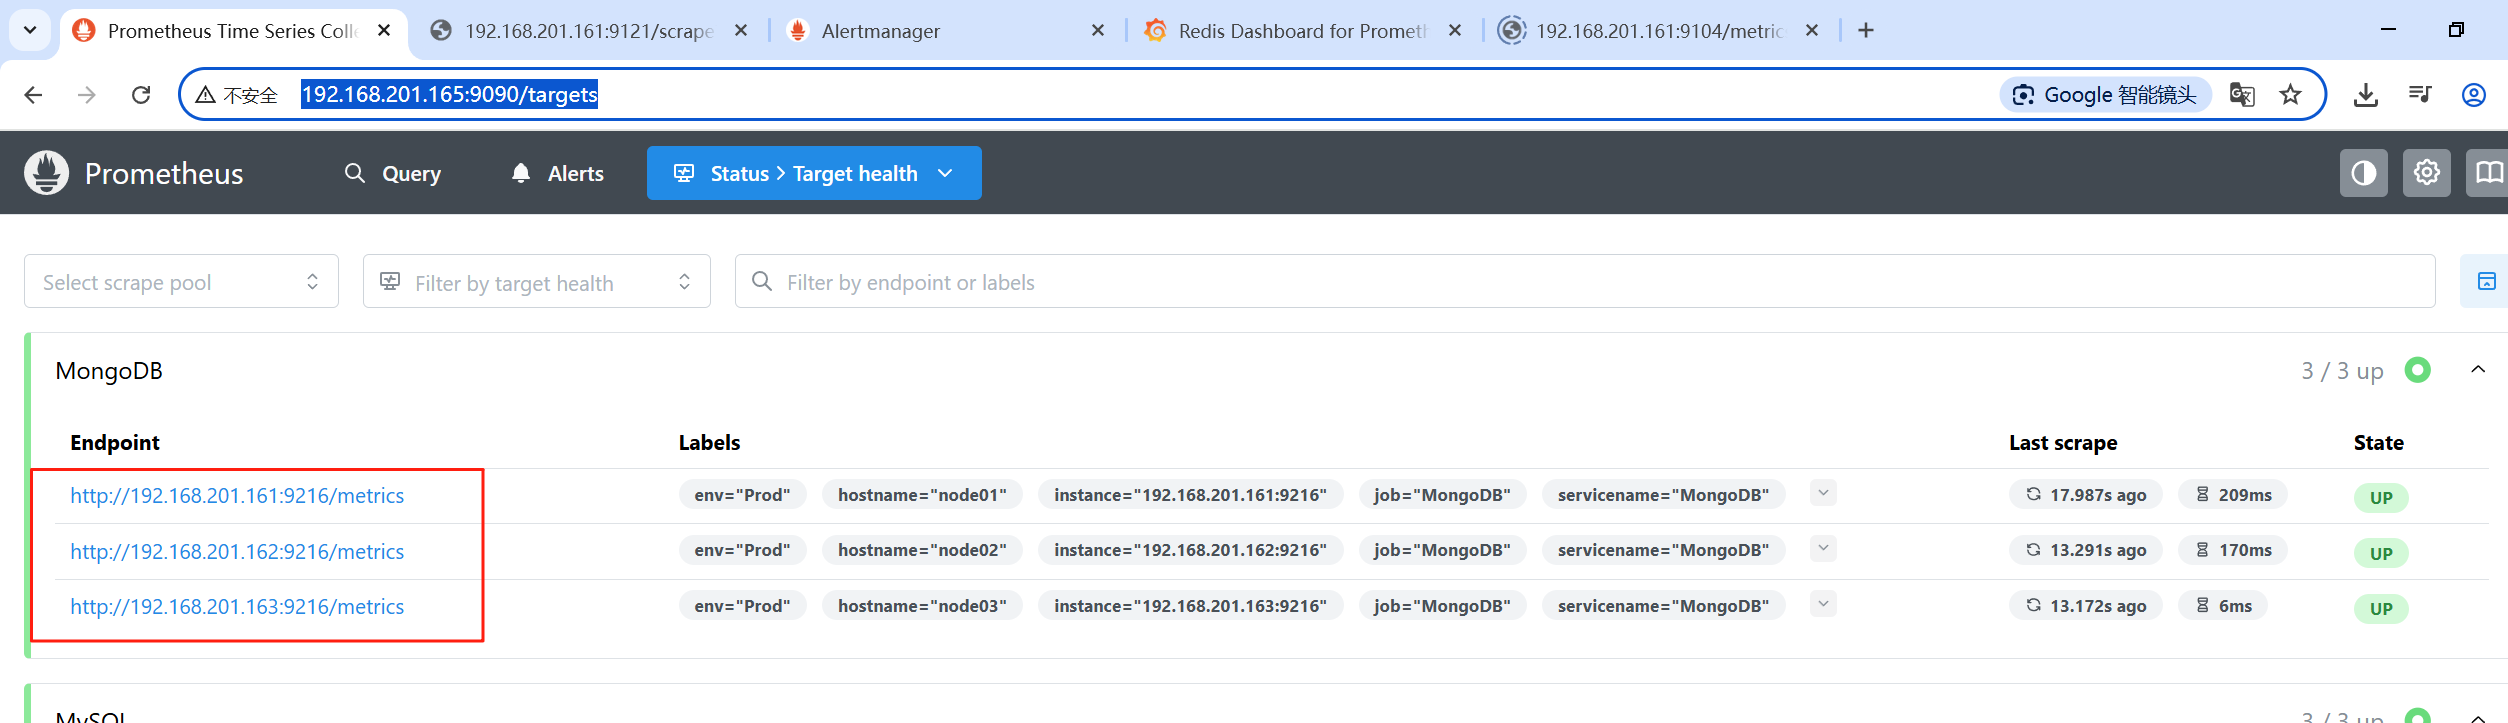
5、页面查看
http://192.168.201.165:9090/targets
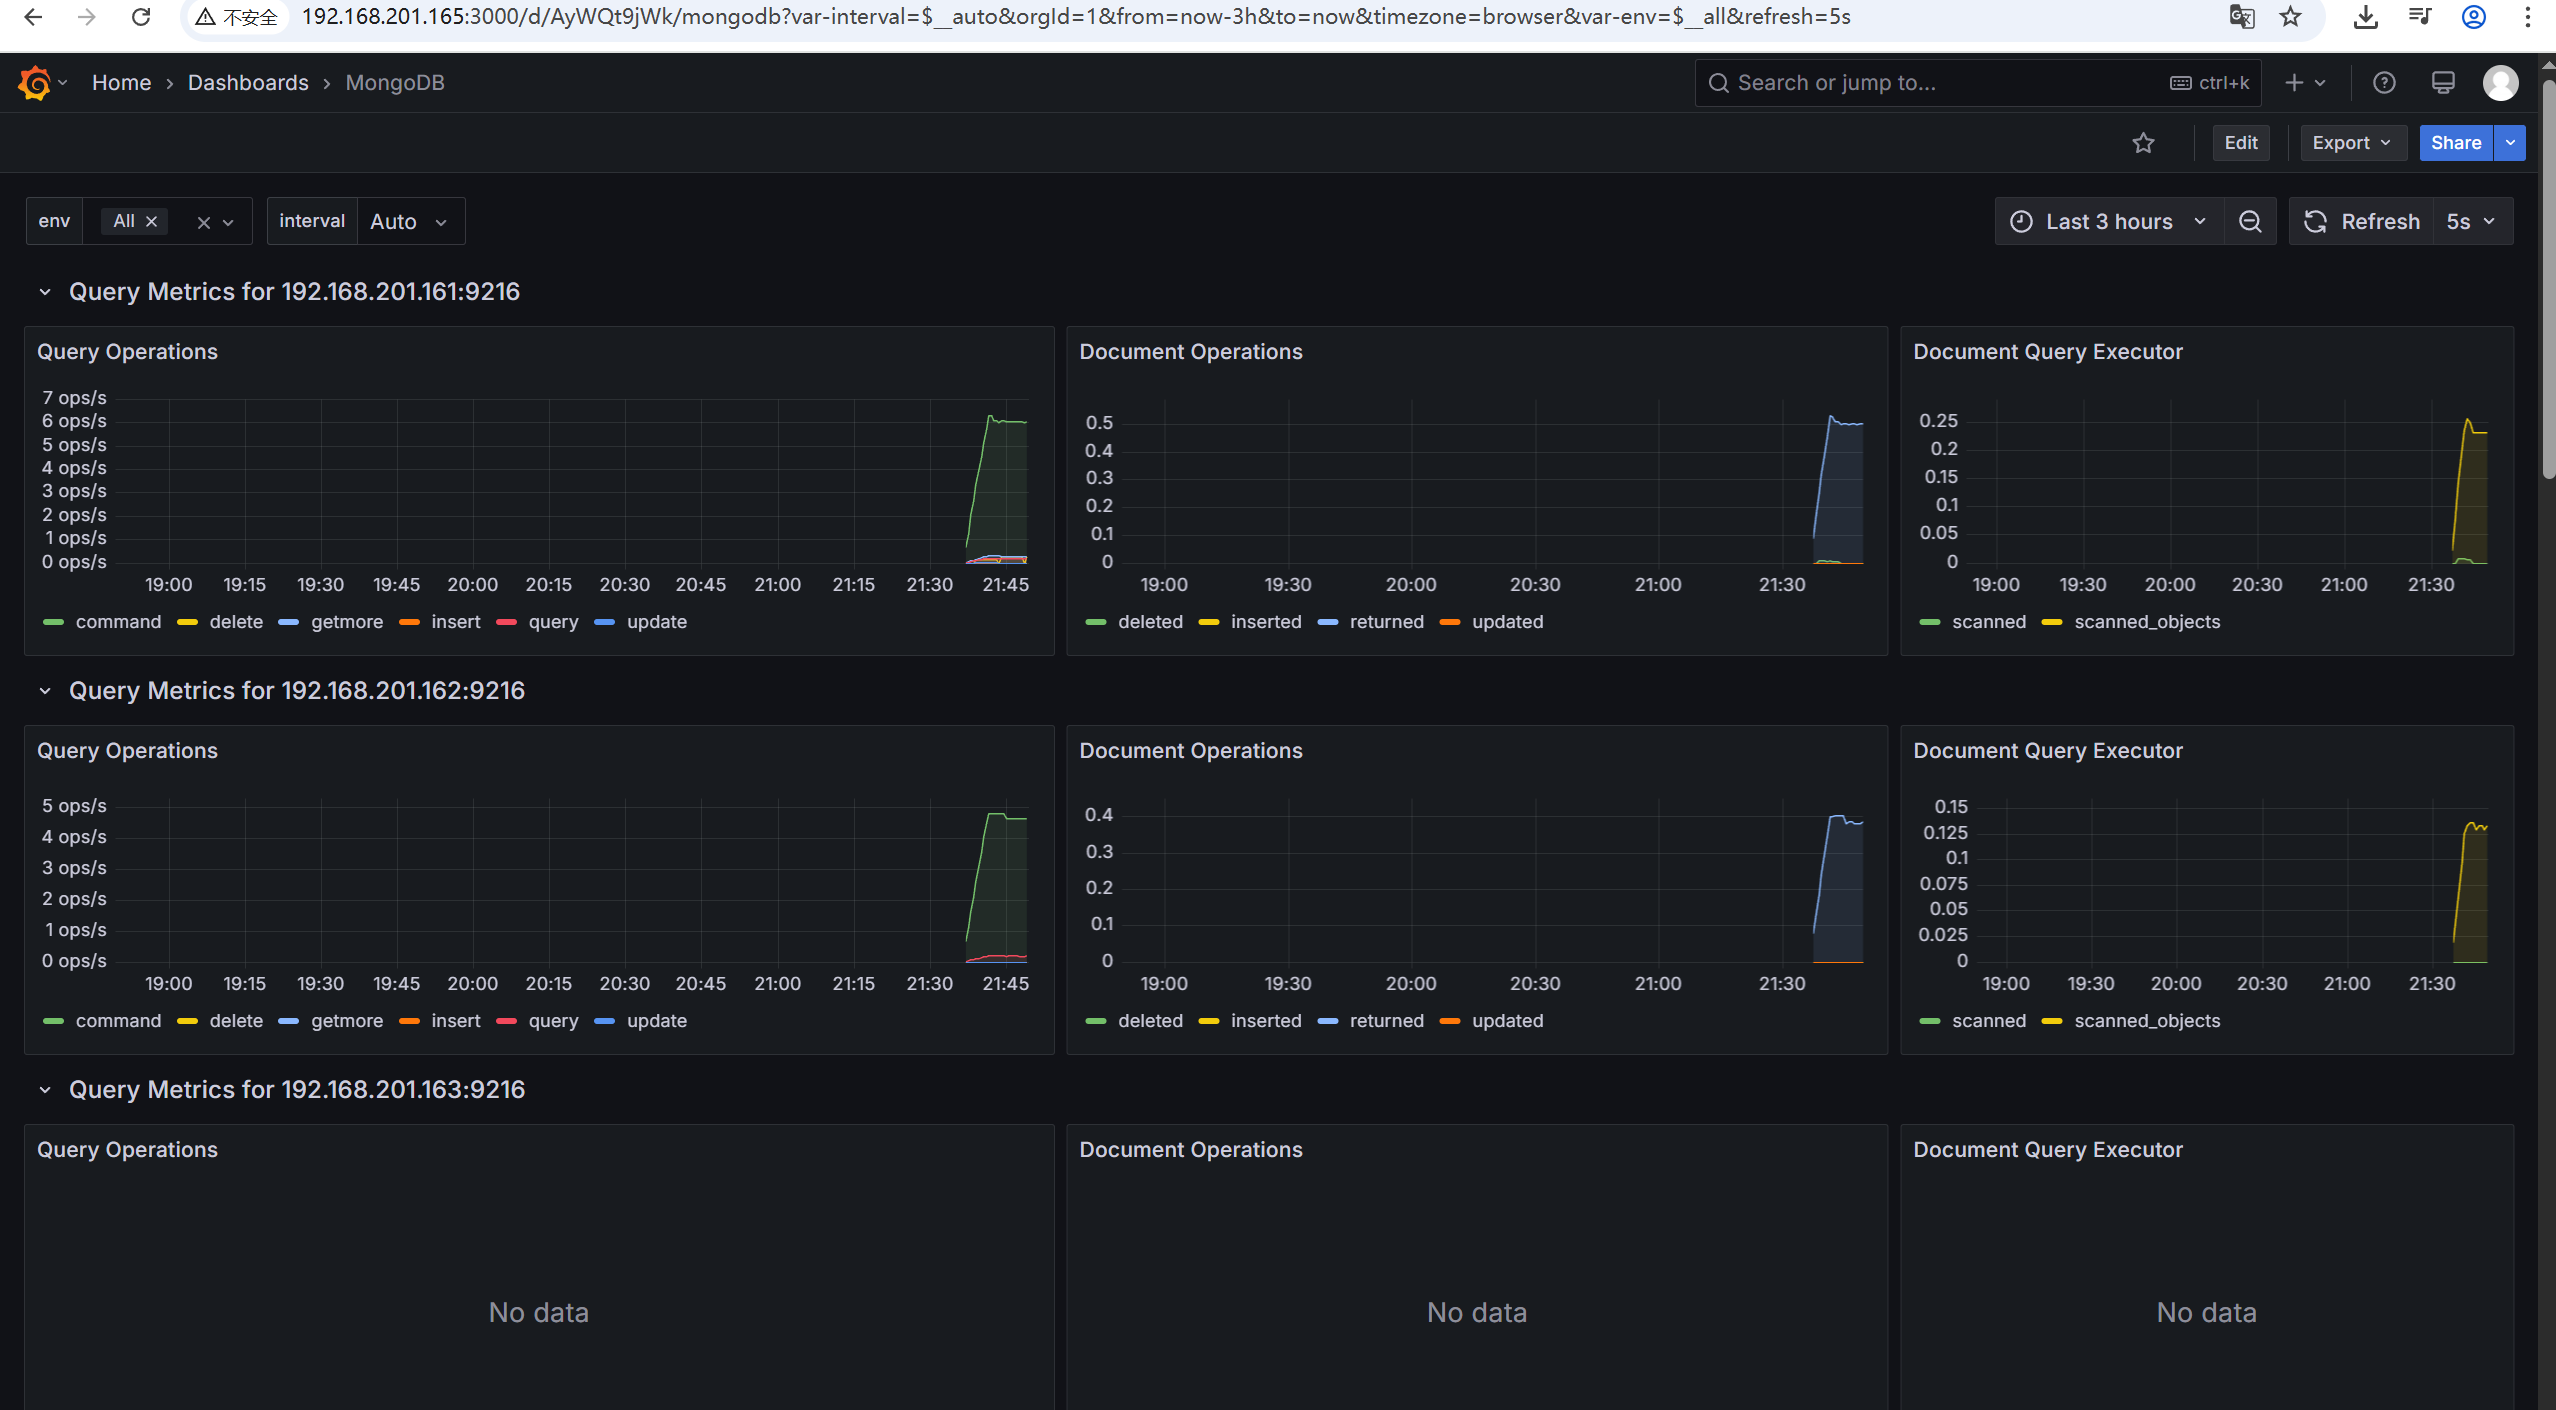
四、配置Granfana监控图和告警规则
1、在grafana导入dashboard模板
http://192.168.201.165:3000/
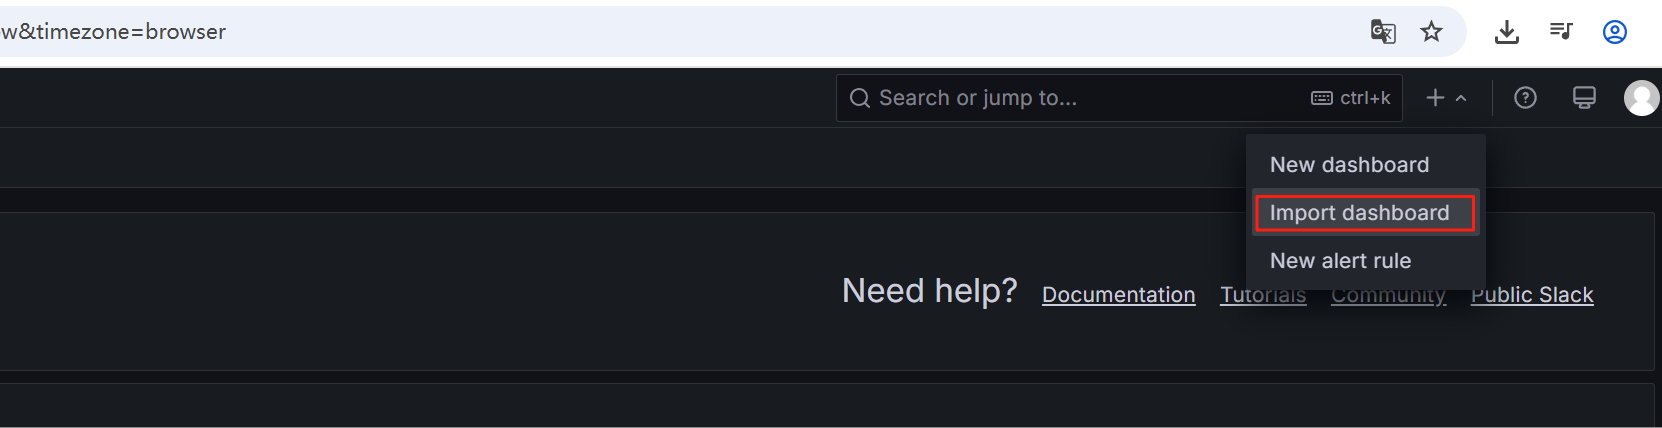
我这里使用的是14997的模板,点击Load
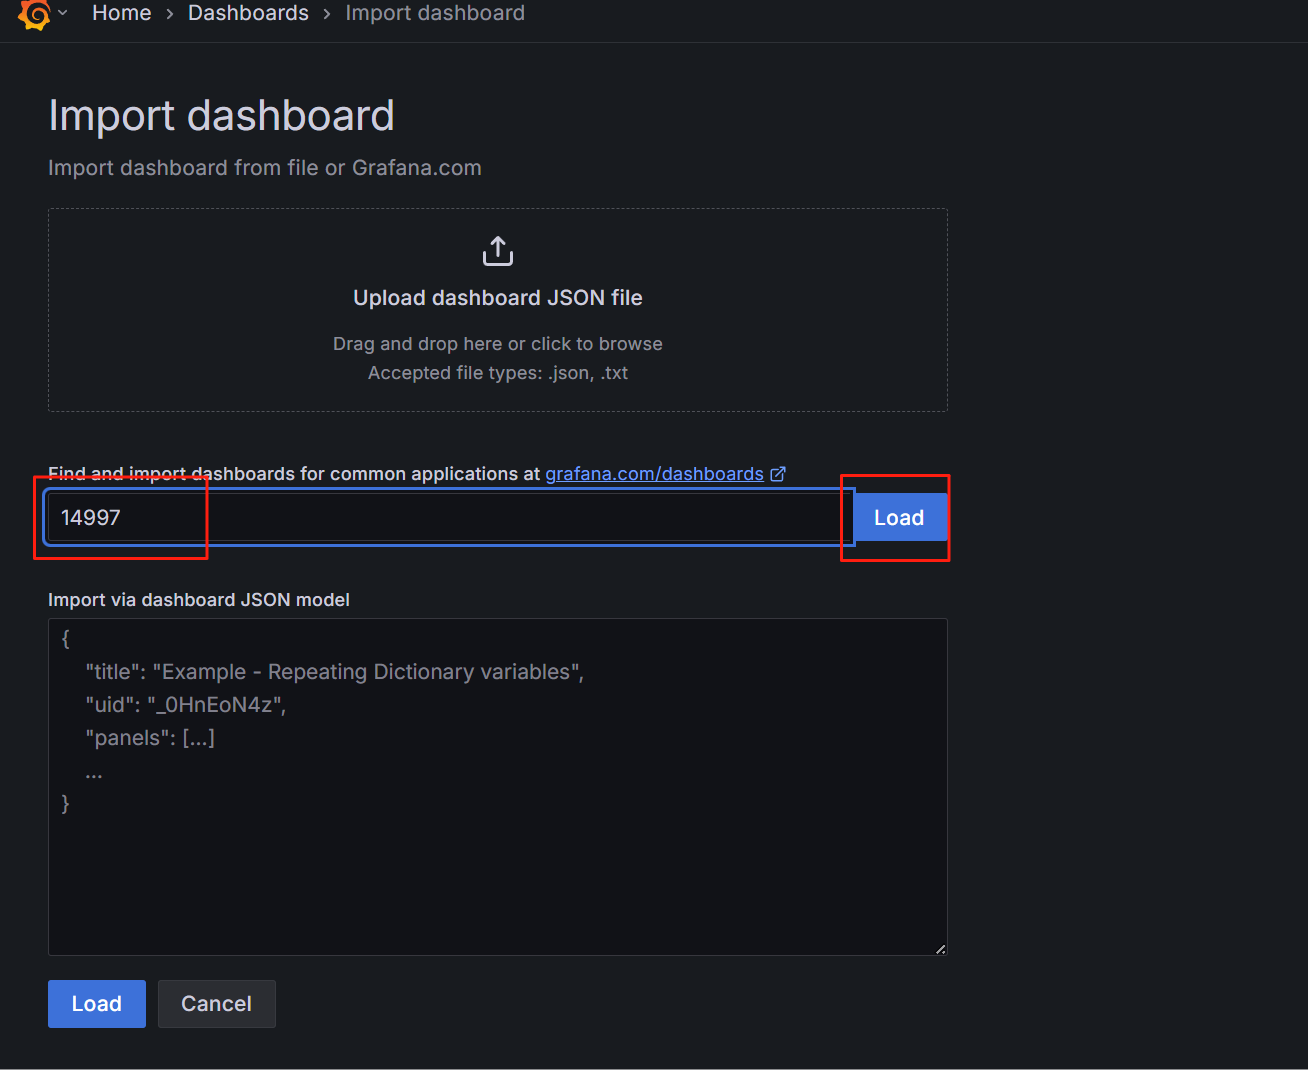
也可以自己选择其他的模板
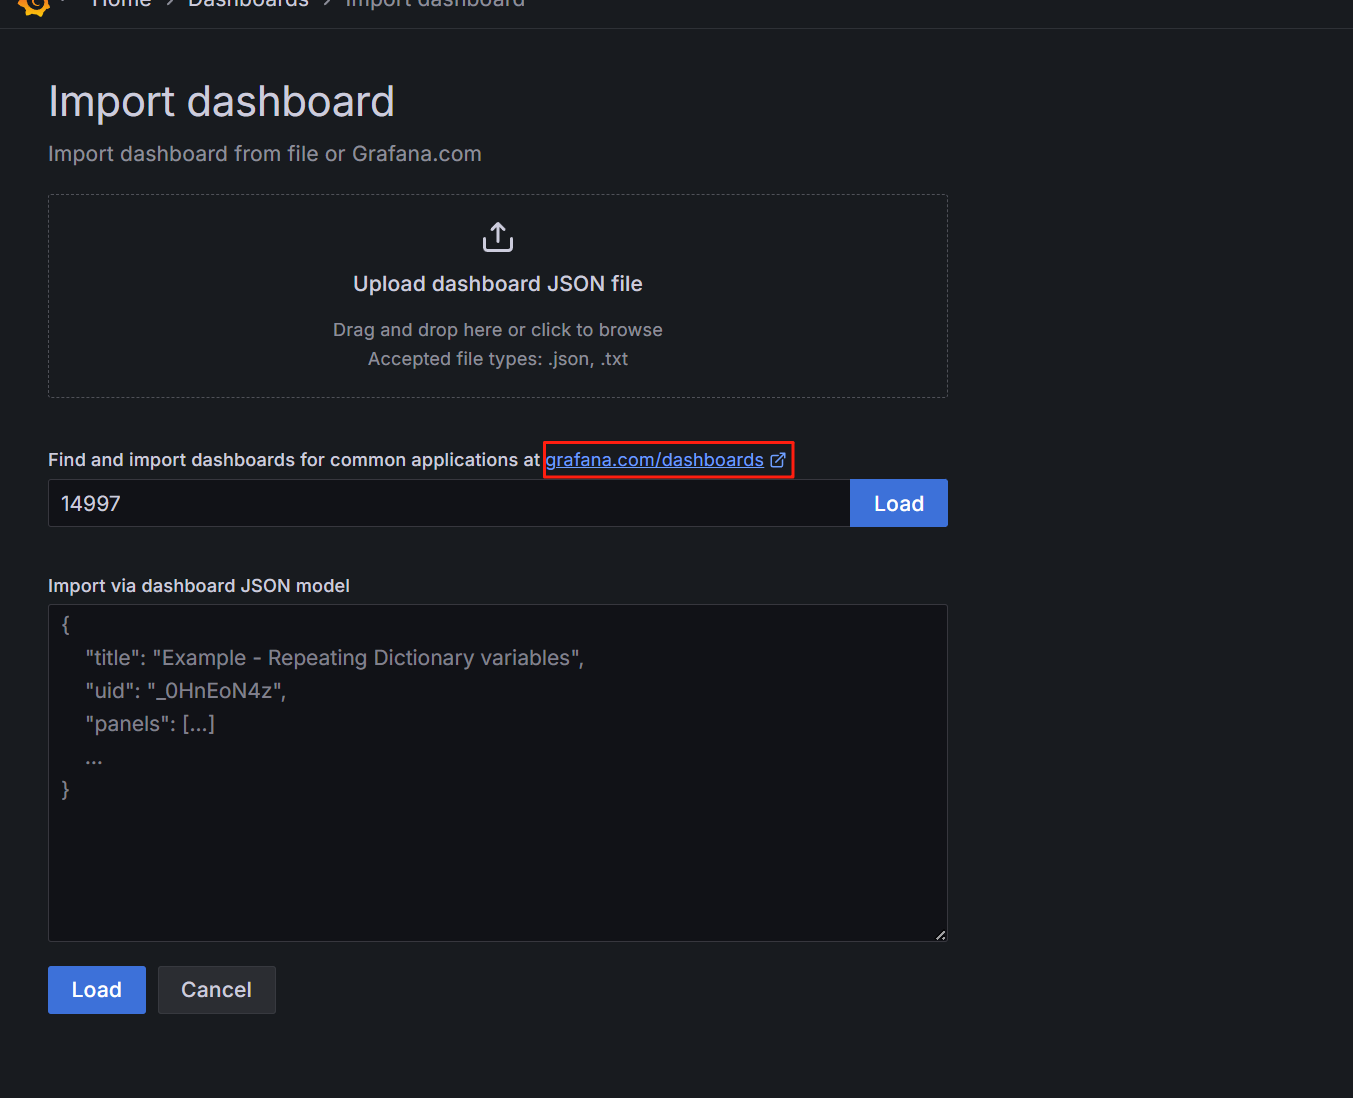

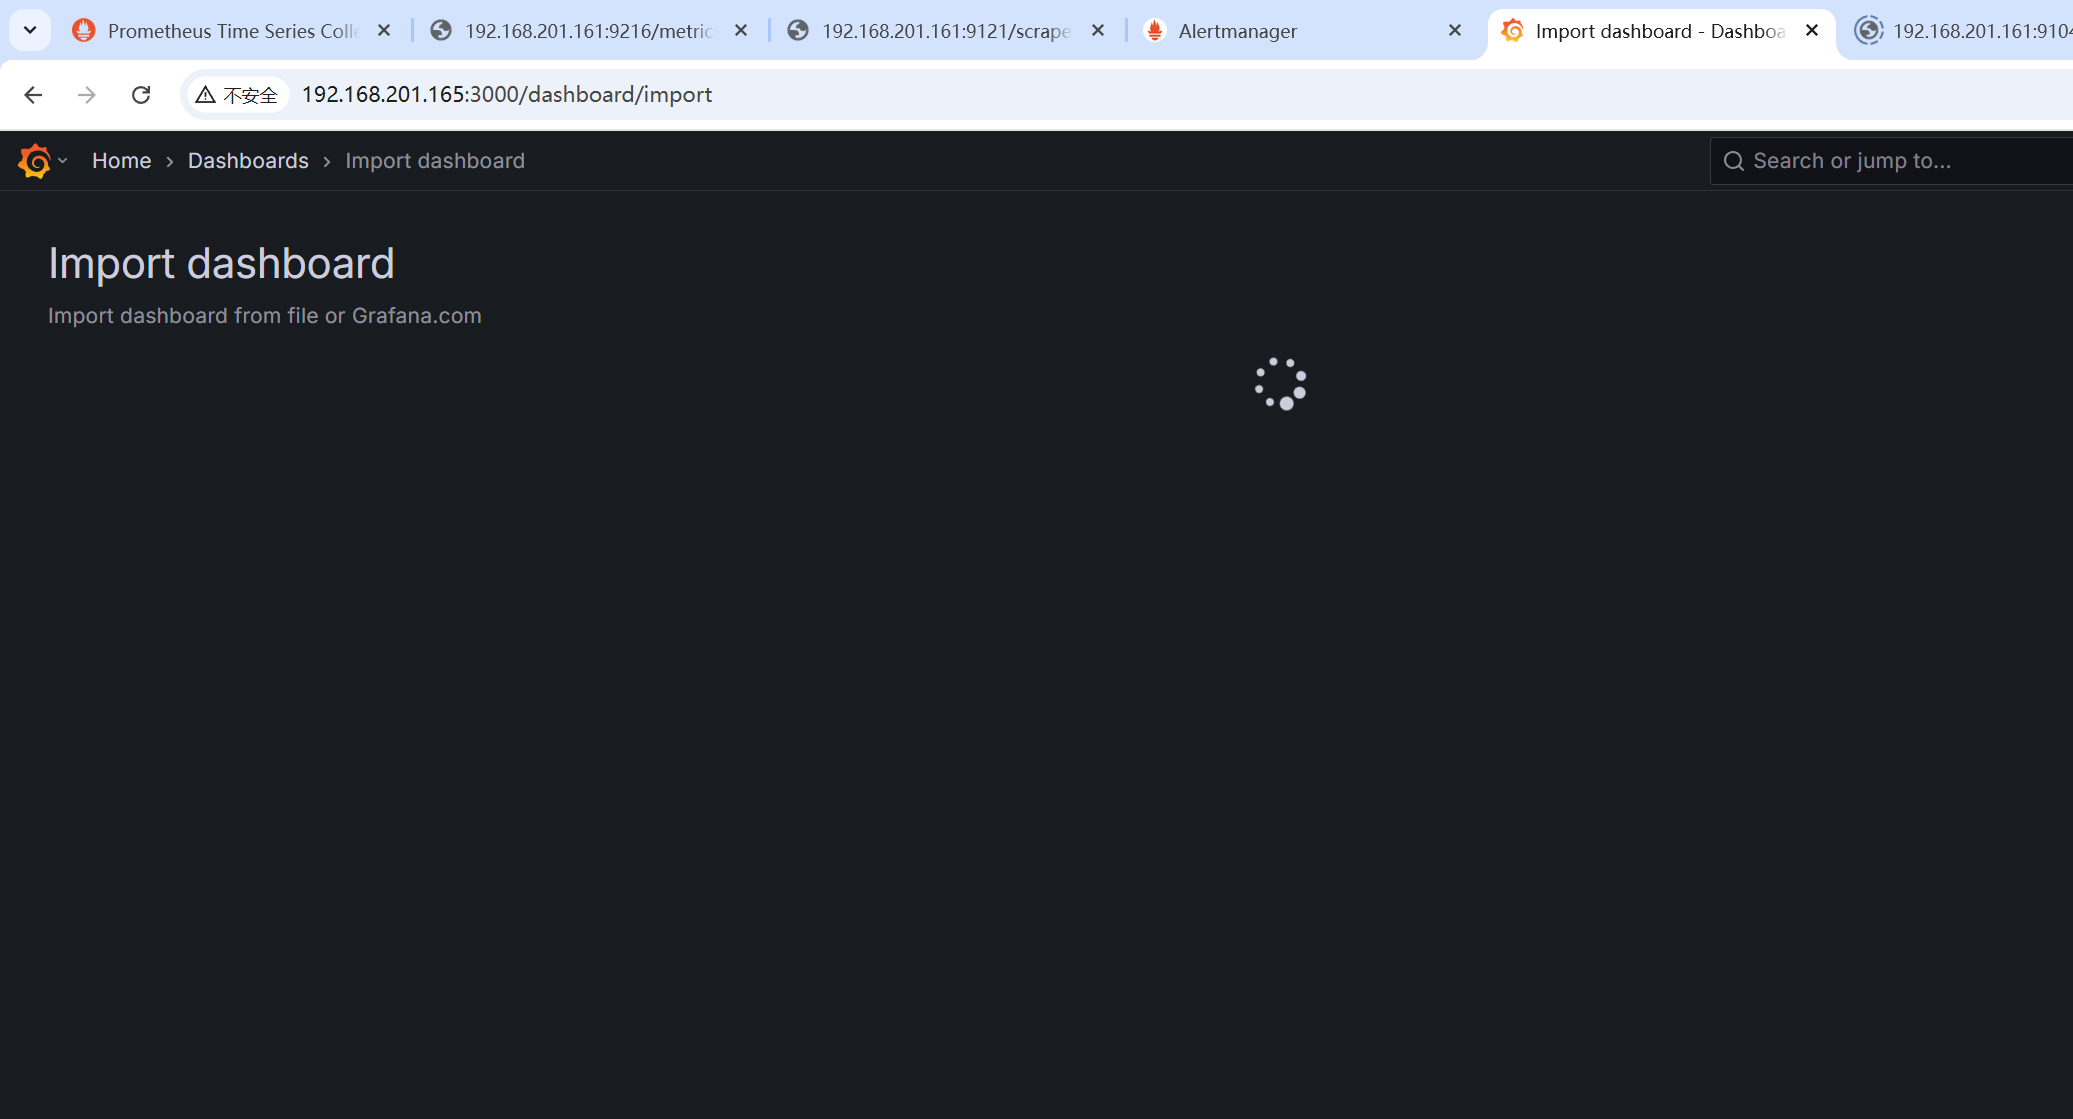
点击Load,然后稍等一会
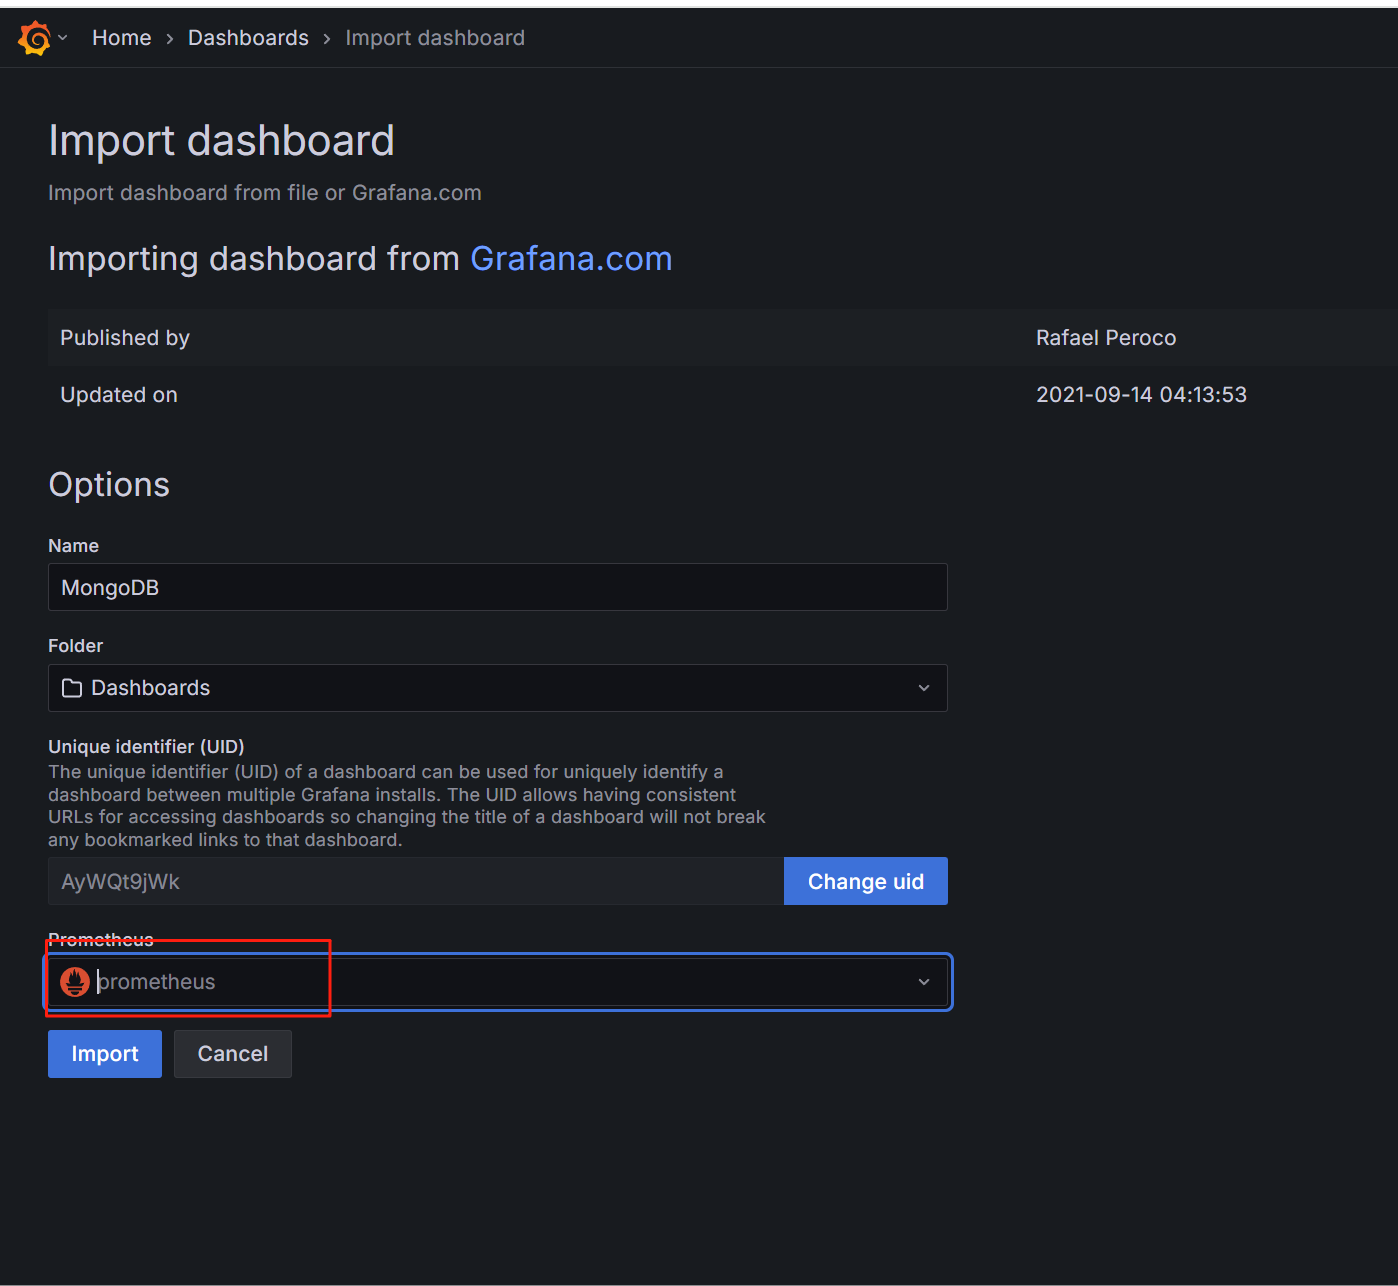
选择数据源,然后点击Import
2、配置MongoDB的告警规则
在165节点,也就是在prometheus节点执行
vim /usr/local/prometheus/rules.d/mongo_rules.yml
加入如下内容:
groups:
- name: mongo_exporter_alerts
  rules:
  - alert: MongodbDown
    expr: mongodb_up == 0
    for: 0m
    labels:
      severity: critical
    annotations:
      summary: MongoDB Down (instance {{ $labels.instance }})
      description: "MongoDB instance is down\nVALUE = {{ $value }}\nLABELS = {{ $labels }}"
  - alert: MongodbReplicaMemberUnhealthy
    expr: mongodb_rs_members_health == 0
    for: 0m
    labels:
      severity: critical
    annotations:
      summary: Mongodb replica member unhealthy (instance {{ $labels.instance }})
      description: "MongoDB replica member is not healthy\nVALUE = {{ $value }}\nLABELS = {{ $labels }}"
  - alert: MongodbReplicationLag
    expr: (mongodb_rs_members_optimeDate{member_state="PRIMARY"} - on (instance) group_right mongodb_rs_members_optimeDate{member_state="SECONDARY"}) / 1000 > 10
    for: 0m
    labels:
      severity: critical
    annotations:
      summary: MongoDB replication lag (instance {{ $labels.instance }})
      description: "Mongodb replication lag is more than 10s\nVALUE = {{ $value }}\nLABELS = {{ $labels }}"
  - alert: MongodbNumberCursorsOpen
    expr: mongodb_ss_metrics_cursor_open{csr_type="total"} > 10000
    for: 2m
    labels:
      severity: warning
    annotations:
      summary: MongoDB number cursors open (instance {{ $labels.instance }})
      description: "Too many cursors opened by MongoDB for clients (> 10k)\nVALUE = {{ $value }}\nLABELS = {{ $labels }}"
  - alert: MongodbCursorsTimeouts
    expr: increase(mongodb_ss_metrics_cursor_timedOut[1m]) > 100
    for: 2m
    labels:
      severity: warning
    annotations:
      summary: MongoDB cursors timeouts (instance {{ $labels.instance }})
      description: "Too many cursors are timing out\nVALUE = {{ $value }}\nLABELS = {{ $labels }}"
  - alert: MongodbTooManyConnections
    expr: avg by(instance) (rate(mongodb_ss_connections{conn_type="current"}[1m])) / avg by(instance) (sum (mongodb_ss_connections) by (instance)) * 100 > 80
    for: 2m
    labels:
      severity: warning
    annotations:
      summary: MongoDB too many connections (instance {{ $labels.instance }})
      description: "Too many connections (> 80%)\nVALUE = {{ $value }}\nLABELS = {{ $labels }}"
  - alert: MongodbVirtualMemoryUsage
    expr: (sum(mongodb_ss_mem_virtual) BY (instance) / sum(mongodb_ss_mem_resident) BY (instance)) > 3
    for: 2m
    labels:
      severity: warning
    annotations:
      summary: MongoDB virtual memory usage (instance {{ $labels.instance }})
      description: "High memory usage\nVALUE = {{ $value }}\nLABELS = {{ $labels }}"
2、检查配置文件
/usr/local/prometheus/promtool check config /usr/local/prometheus/prometheus.yml
4、重启prometheus
systemctl restart prometheus
systemctl status prometheus
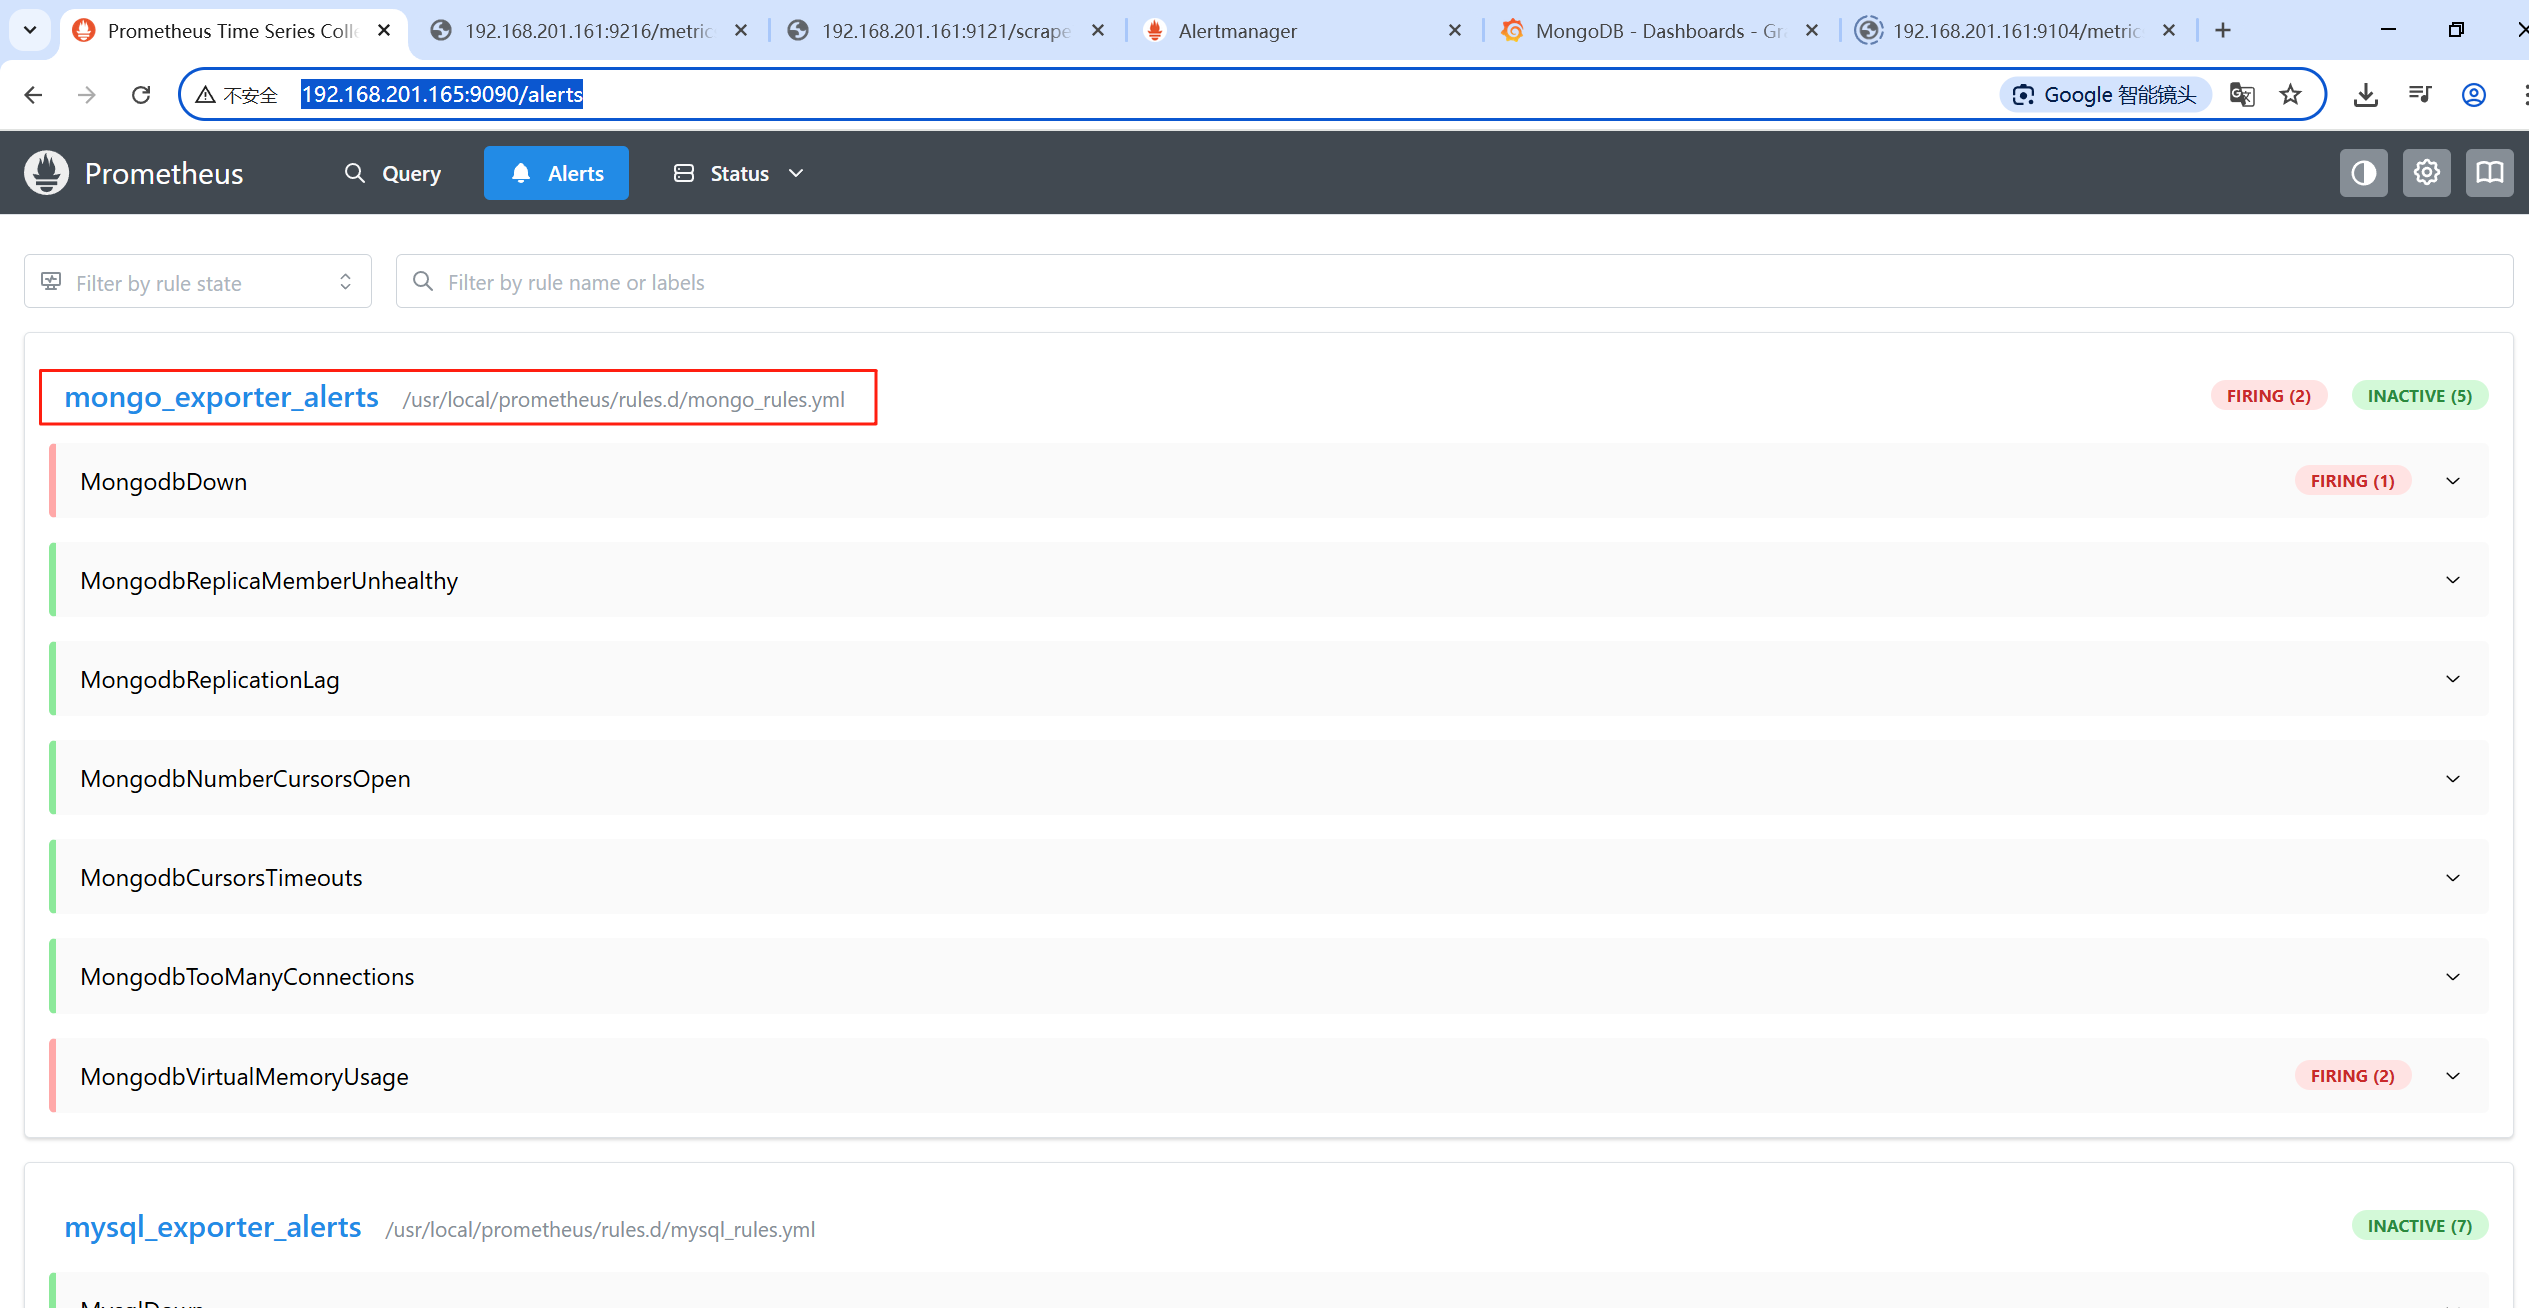
5、Prometheus页面查看
http://192.168.201.165:9090/alerts
五、测试告警
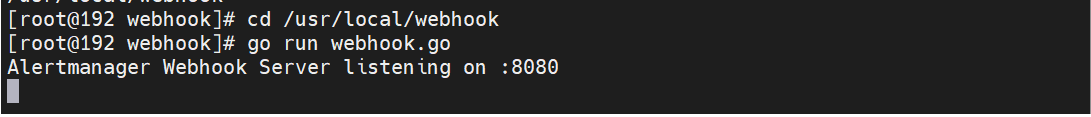
1、启动go程序
cd /usr/local/webhook
go run webhook.go
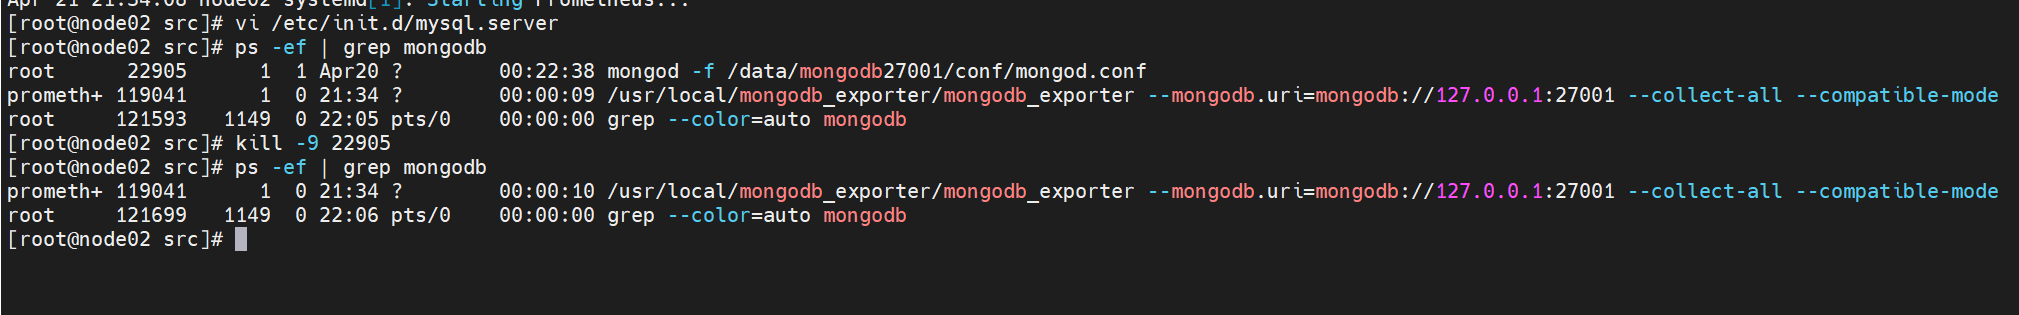
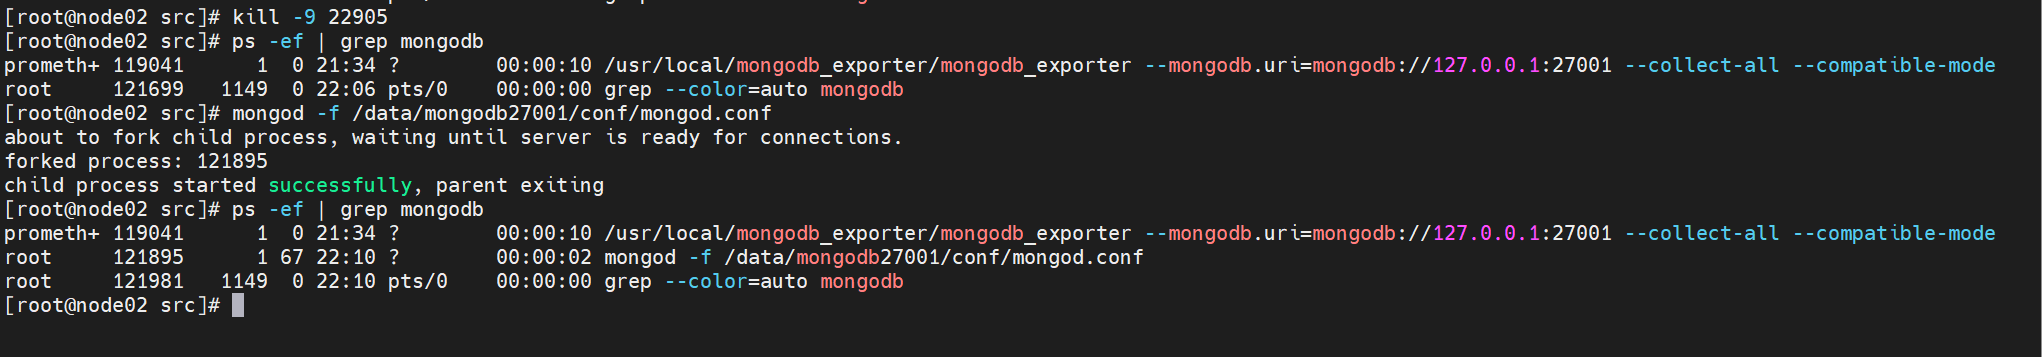
2、停掉162的mongodb
ps -ef | grep mongodb

kill -9 22905
ps -ef | grep mongodb
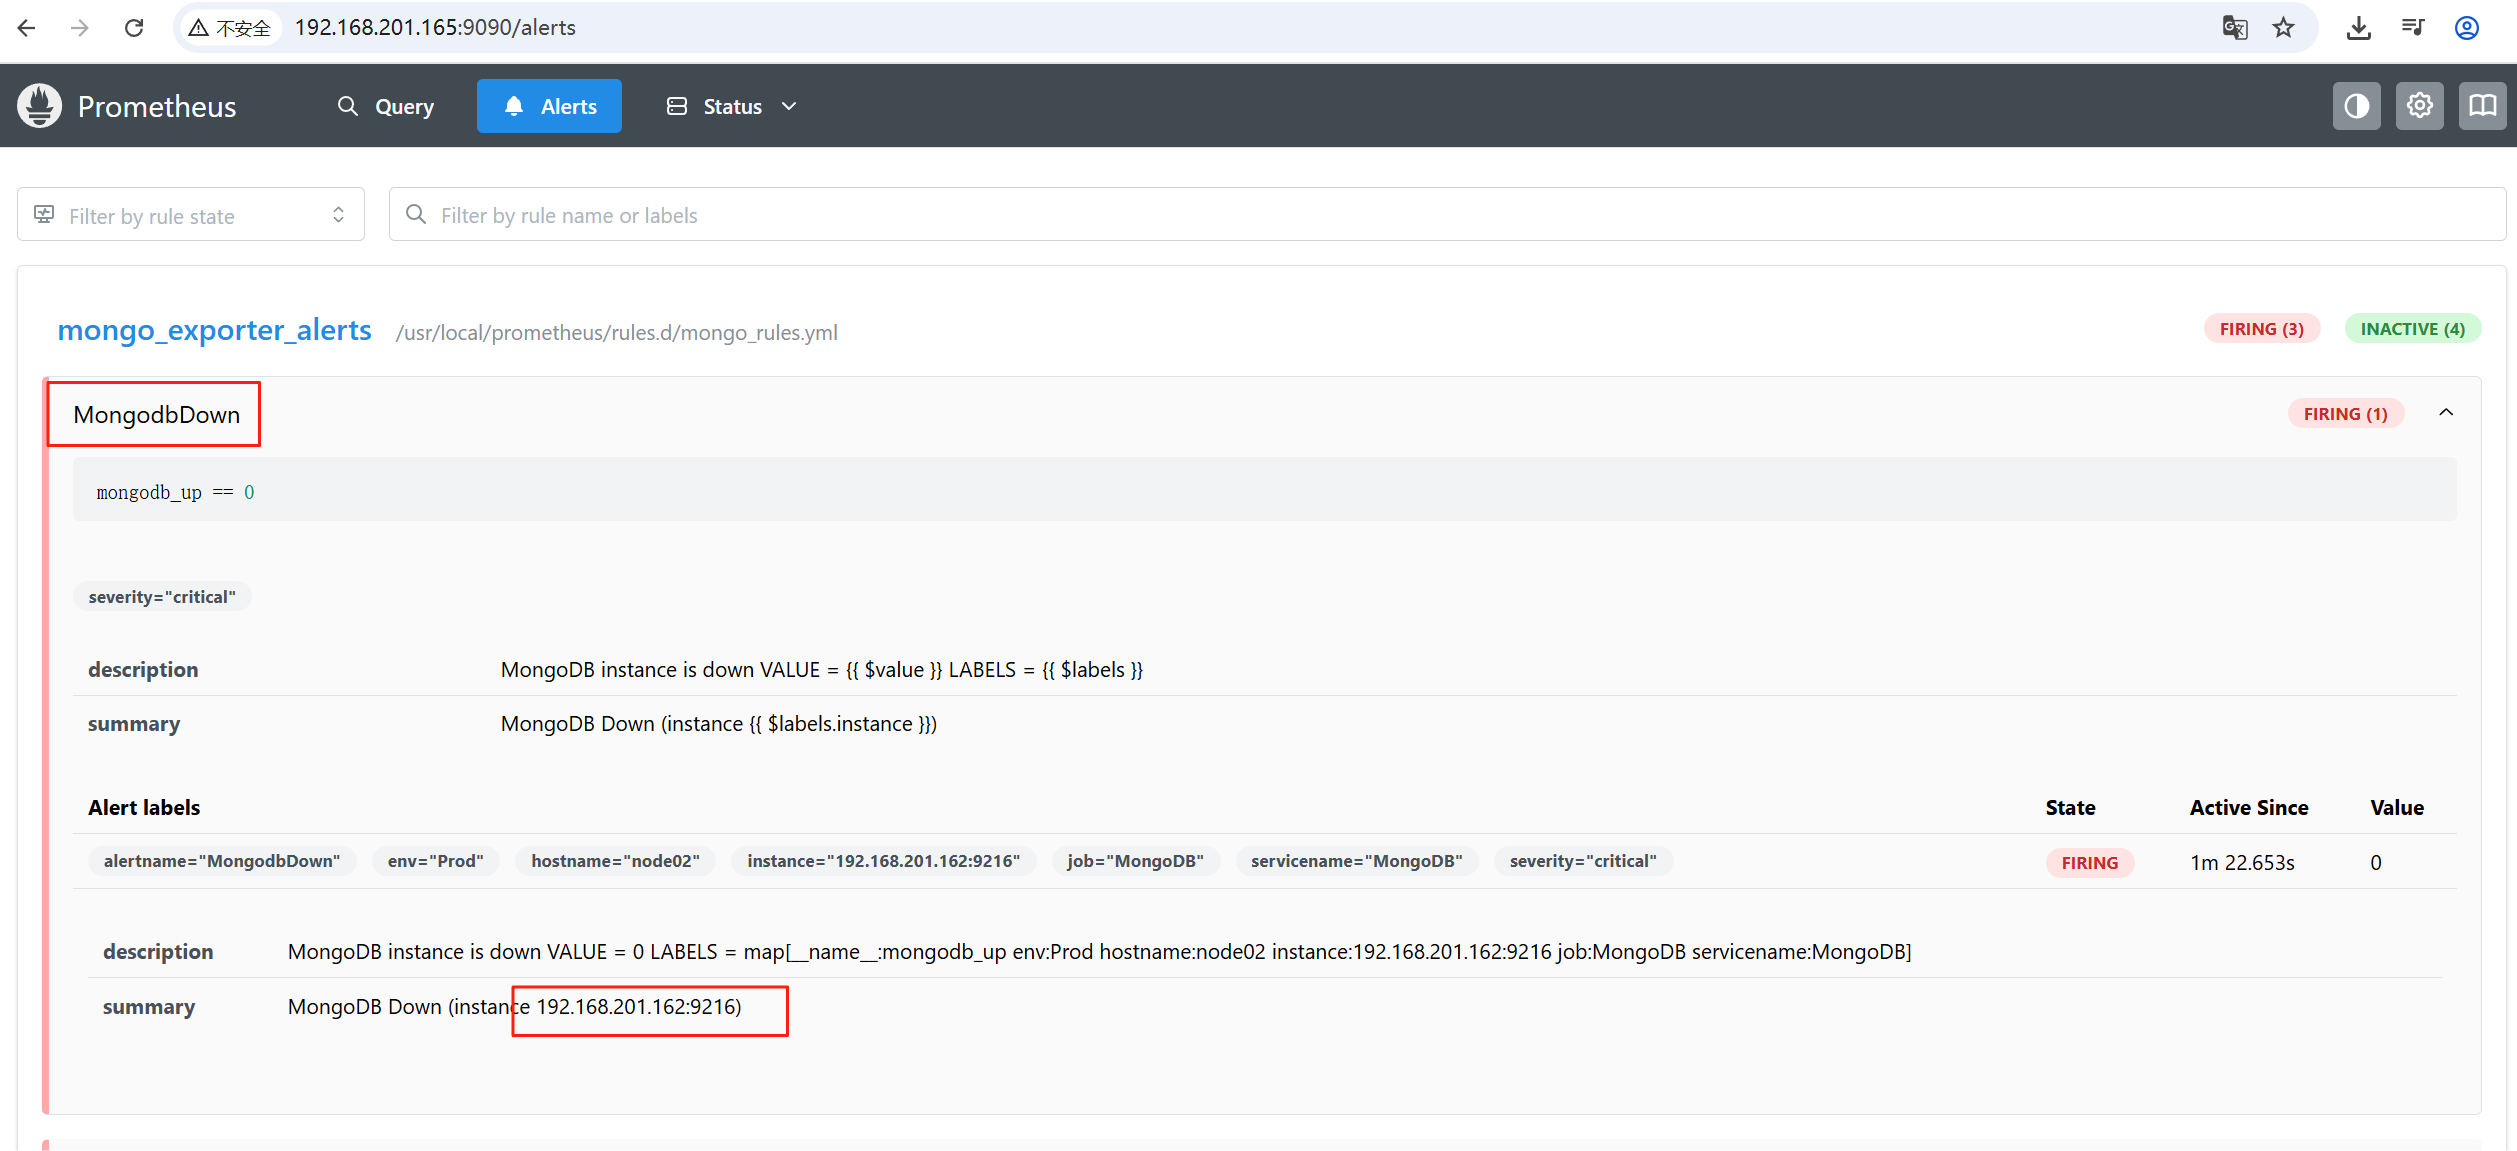
2、查看prometheus页面
http://192.168.201.165:9090/alerts
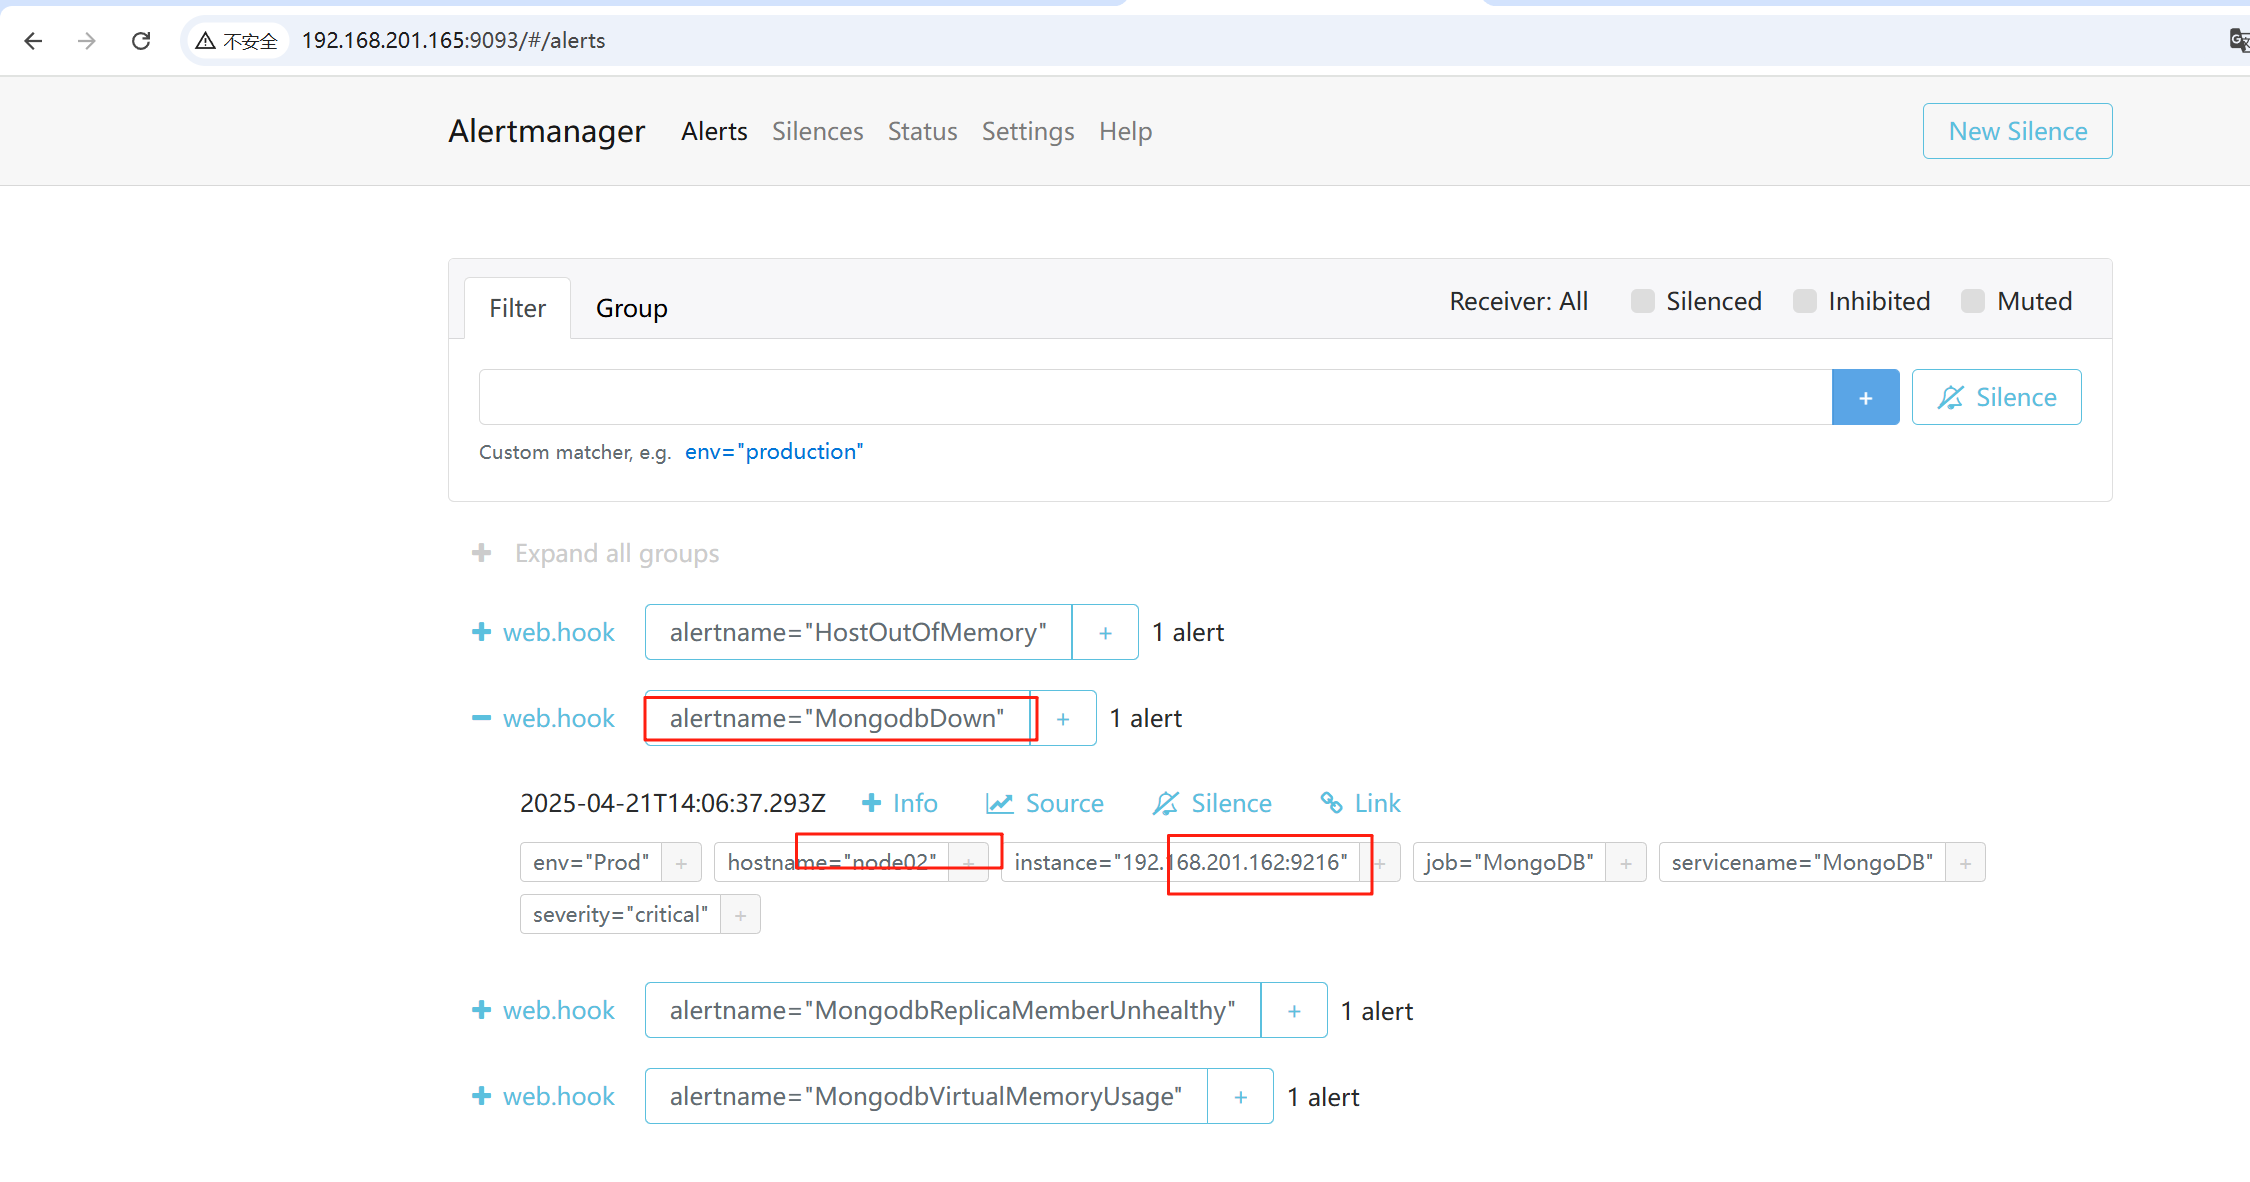
3、查看alertmanage页面
http://192.168.201.165:9093/#/alerts
4、查看go输出
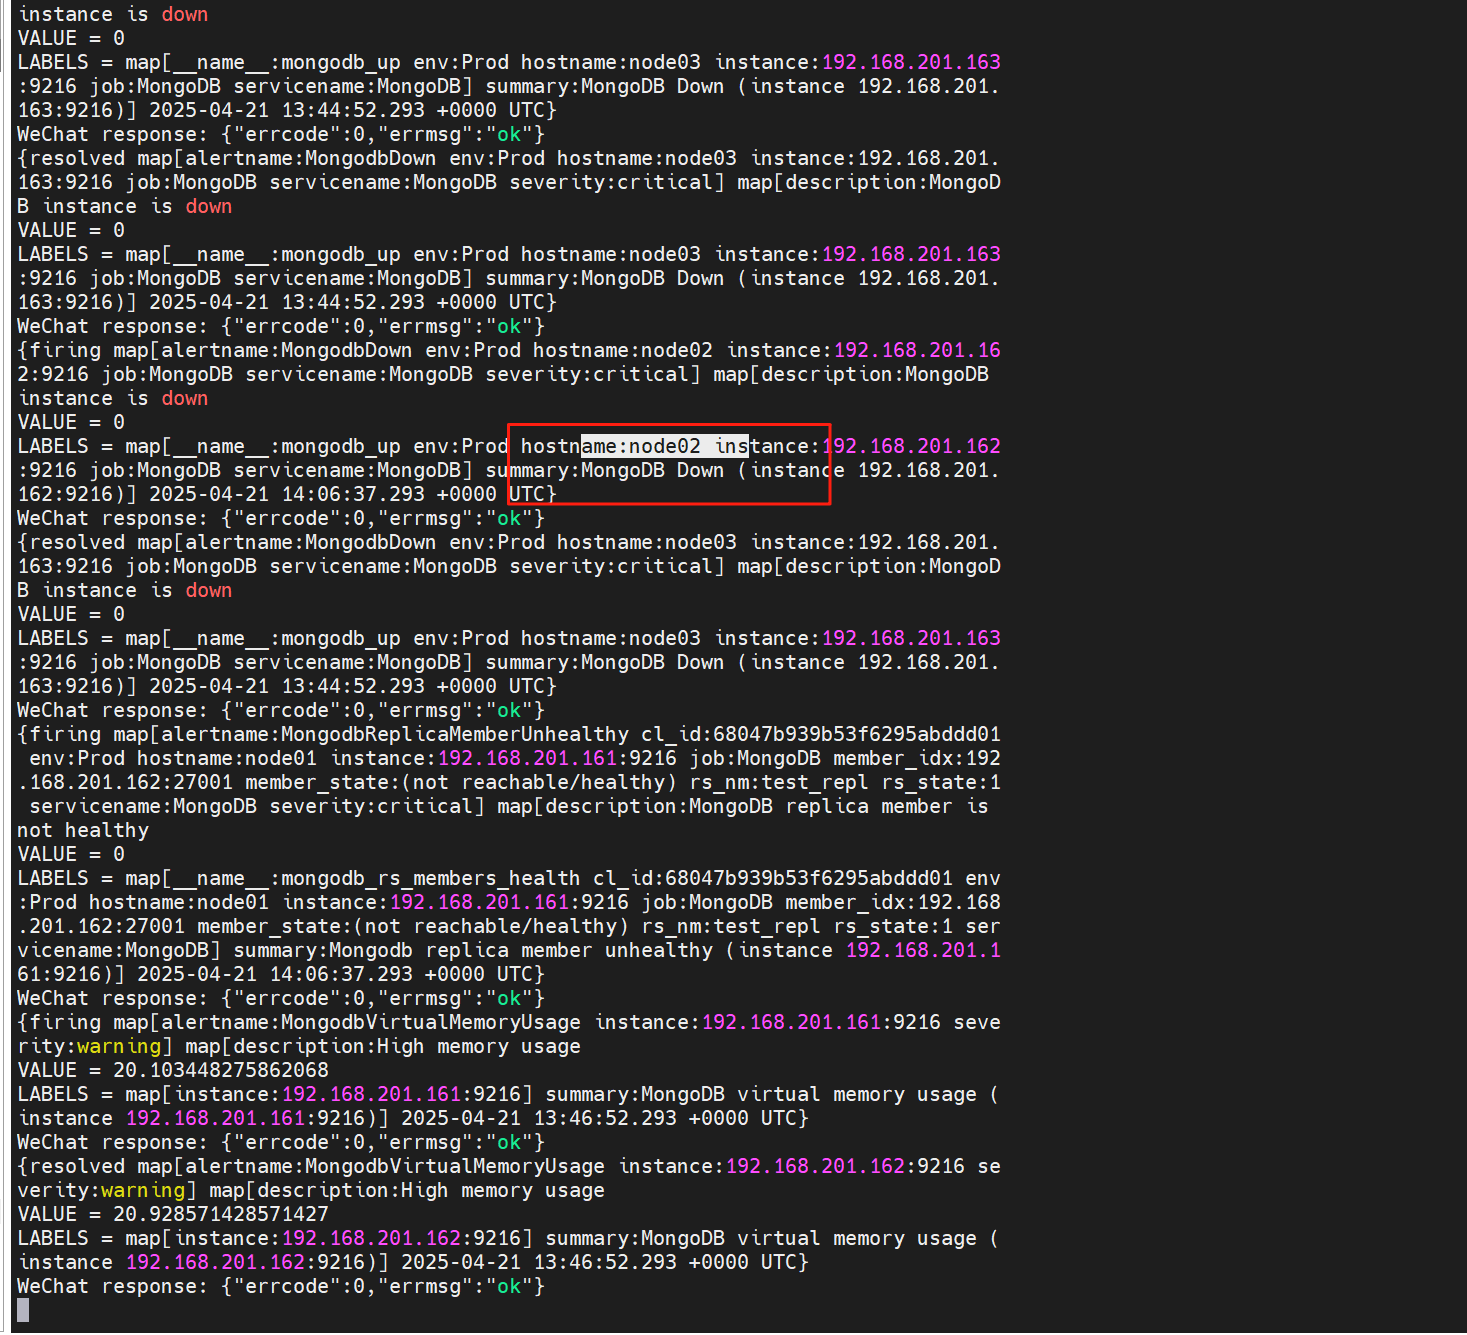
5、查看企业微信
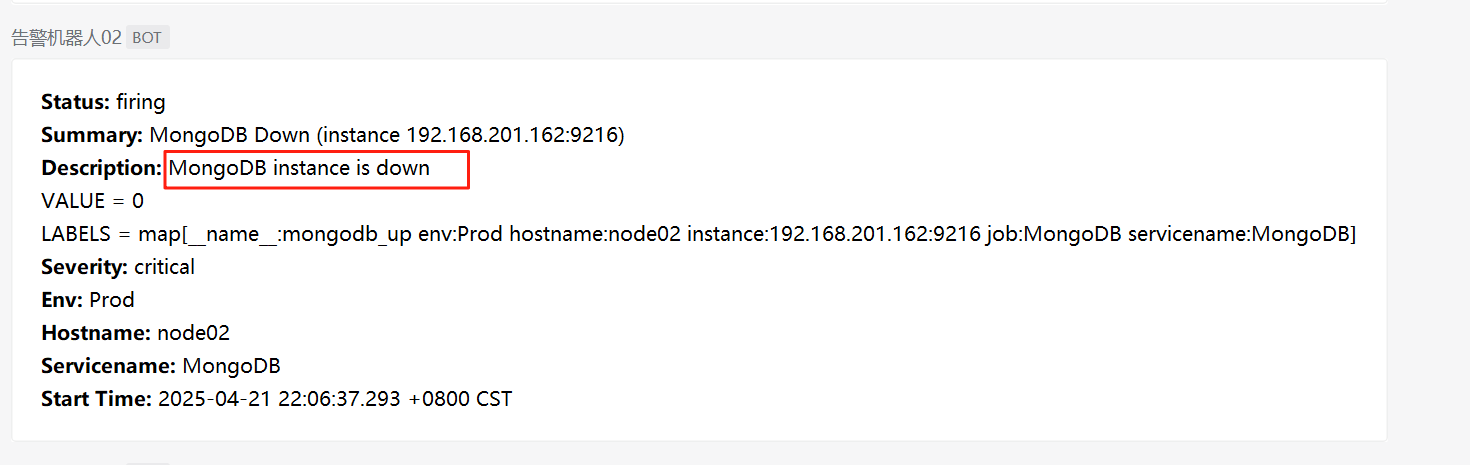
6、重启162的mongodb
mongod -f /data/mongodb27001/conf/mongod.conf
ps -ef | grep mongodb


 34
34

 被折叠的 条评论
为什么被折叠?
被折叠的 条评论
为什么被折叠?
 到【灌水乐园】发言


