


【环境准备】
虚拟机
192.168.100.202 主节点
192.168.100.203 分节点
192.168.100.204 分节点
【安装步骤】
主节点安装prometheus
步骤1:将部署包放置在/home目录下并进行解压
tar -zvxf /root/prometheus-2.48.0.linux-amd64.tar.gz
步骤2:移动安装目录到/usr/local目录下
mv prometheus-2.48.1.linux-amd64 /usr/local/
步骤3:建立软连接
ln -s /usr/local/prometheus-2.48.1.linux-amd64/ /usr/local/prometheus
步骤4:增加用户
useradd -s /sbin/nologin -M prometheus
步骤5:创建目录
mkdir /mnt/xylink/data/prometheus -p
步骤6:修改目录属主
chown -R prometheus:prometheus /usr/local/prometheus/
chown -R prometheus:prometheus /mnt/xylink/data/prometheus/
步骤7:编辑配置文件
vim /etc/systemd/system/prometheus.service
[Unit]
Description=Prometheus
Documentation=https://prometheus.io/
After=network.target
[Service]
Type=simple
User=prometheus
ExecStart=/usr/local/prometheus/prometheus --config.file=/usr/local/prometheus/prometheus.yml --storage.tsdb.path=/mnt/xylink/data/prometheus
Restart=on-failure
[Install]
WantedBy=multi-user.target
步骤8:重启服务
systemctl start prometheus
systemctl enable prometheus
主节点安装grafana
步骤1:解压安装文件
tar -zvxf /root/grafana-enterprise-10.2.2.linux-amd64.tar.gz
步骤2:移动安装目录到/usr/local目录下
mv grafana-v10.2.3 /usr/local/
步骤3:创建软连接
ln -s /usr/local/grafana-v10.2.3/ /usr/local/grafana
步骤4:增加用户
useradd -s /sbin/nologin -M grafana
步骤5:创建目录
mkdir /mnt/xylink/data/grafana
步骤6:修改目录属主
chown -R grafana:grafana /usr/local/grafana/
chown -R grafana:grafana /mnt/xylink/data/grafana/
步骤7:修改配置文件
vim /usr/local/grafana/conf/defaults.ini
data = /mnt/xylink/data/grafana/data
logs = /mnt/xylink/data/grafana/log
plugins = /mnt/xylink/data/grafana/plugins
provisioning = /mnt/xylink/data/grafana/conf/provisioning
vim /etc/systemd/system/grafana-server.service
systemctl start grafana-server
systemctl enable grafana-server
systemctl status grafana-server
[Unit]
Description=Grafana
After=network.target
[Service]
User=grafana
Group=grafana
Type=notify
ExecStart=/usr/local/grafana/bin/grafana-server -homepath /usr/local/grafana
Restart=on-failure
[Install]
WantedBy=multi-user.target
主节点及其他节点安装node_exporter
步骤1:解压安装包
tar -xf /root/node_exporter-1.7.0.linux-amd64.tar.gz
步骤2:新建一个目录专门安装各种exporter
mkdir -p /usr/local/prometheus_exporter
mv node_exporter-1.7.0.linux-amd64 /usr/local/prometheus_exporter
cd /usr/local/prometheus_exporter/
ln -s /usr/local/prometheus_exporter/node_exporter-1.7.0.linux-amd64/ /usr/local/node_exporter
cat > /etc/systemd/system/node_exporter.service << "EOF"
[Unit]
Description=node_export
Documentation=https://github.com/prometheus/node_exporter
[Service]
ExecStart=/usr/local/prometheus_exporter/node_exporter-1.7.0.linux-amd64/node_exporter
Restart=on-failure
[Install]
WantedBy=multi-user.target
EOF
进入主节点机器上的/usr/local/prometheus目录下,找到prometheus.yml文件,编辑里面的内容,如下所示:(根据项目情况增加红色部分)
scrape_configs:
- job_name: 'prometheus'
static_configs:
- targets: ['localhost:9090']
#采集node exporter监控数据
- job_name: node1
static_configs:
- targets: ['192.168.100.202:9100']
- job_name: node2
static_configs:
- targets: ['192.168.100.203:9100']
- job_name: node2
static_configs:
- targets: ['192.168.100.204:9100']
步骤3:重启服务
主节点重启
systemctl restart prometheus
systemctl restart grafana-server
systemctl restart node_exporter
分节点重启
systemctl restart node_exporter
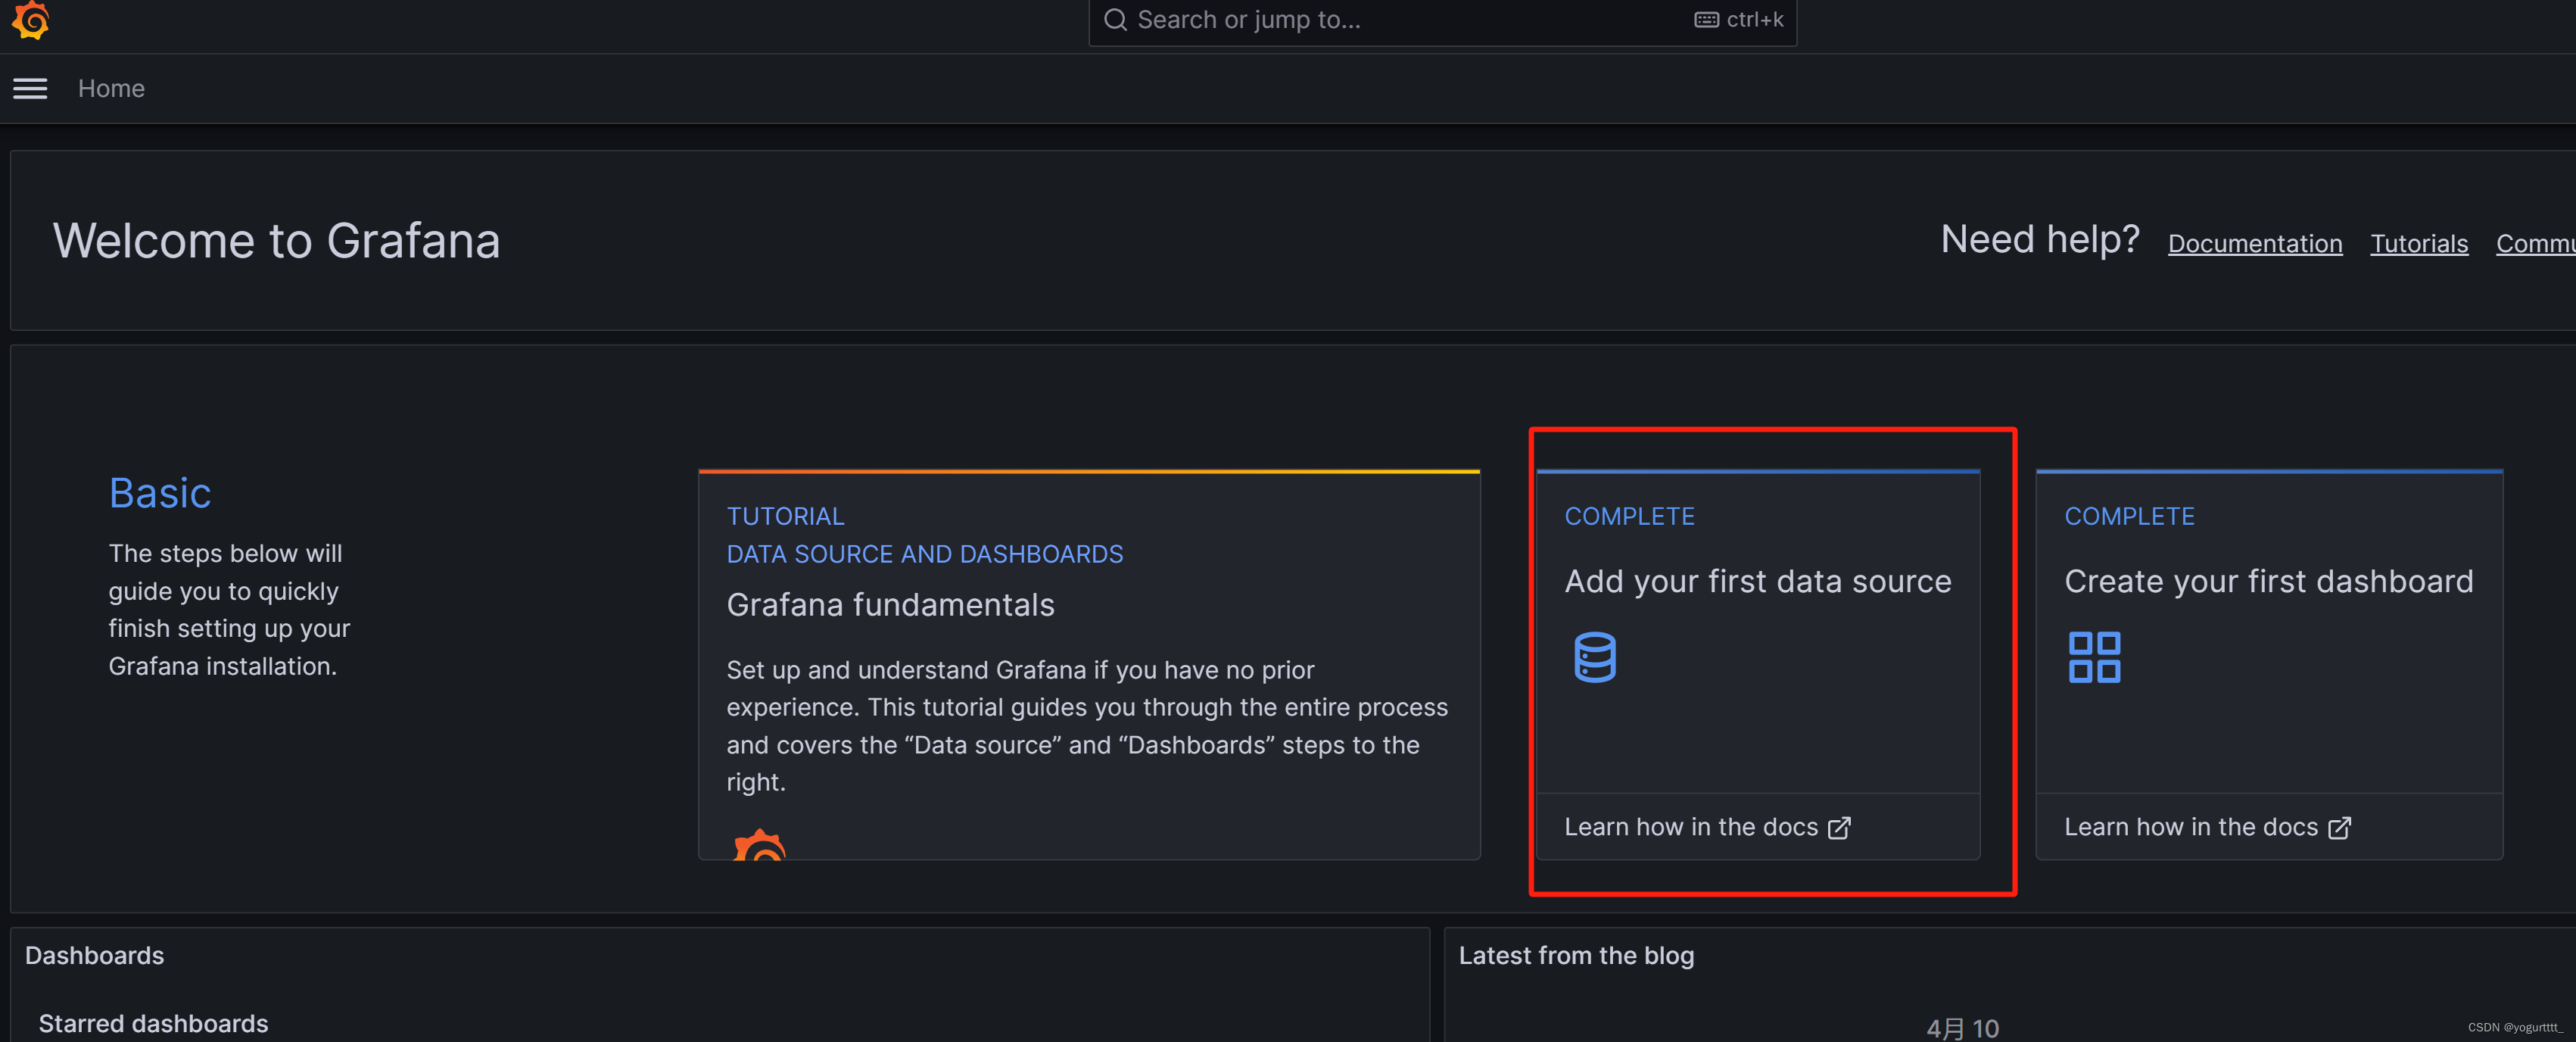
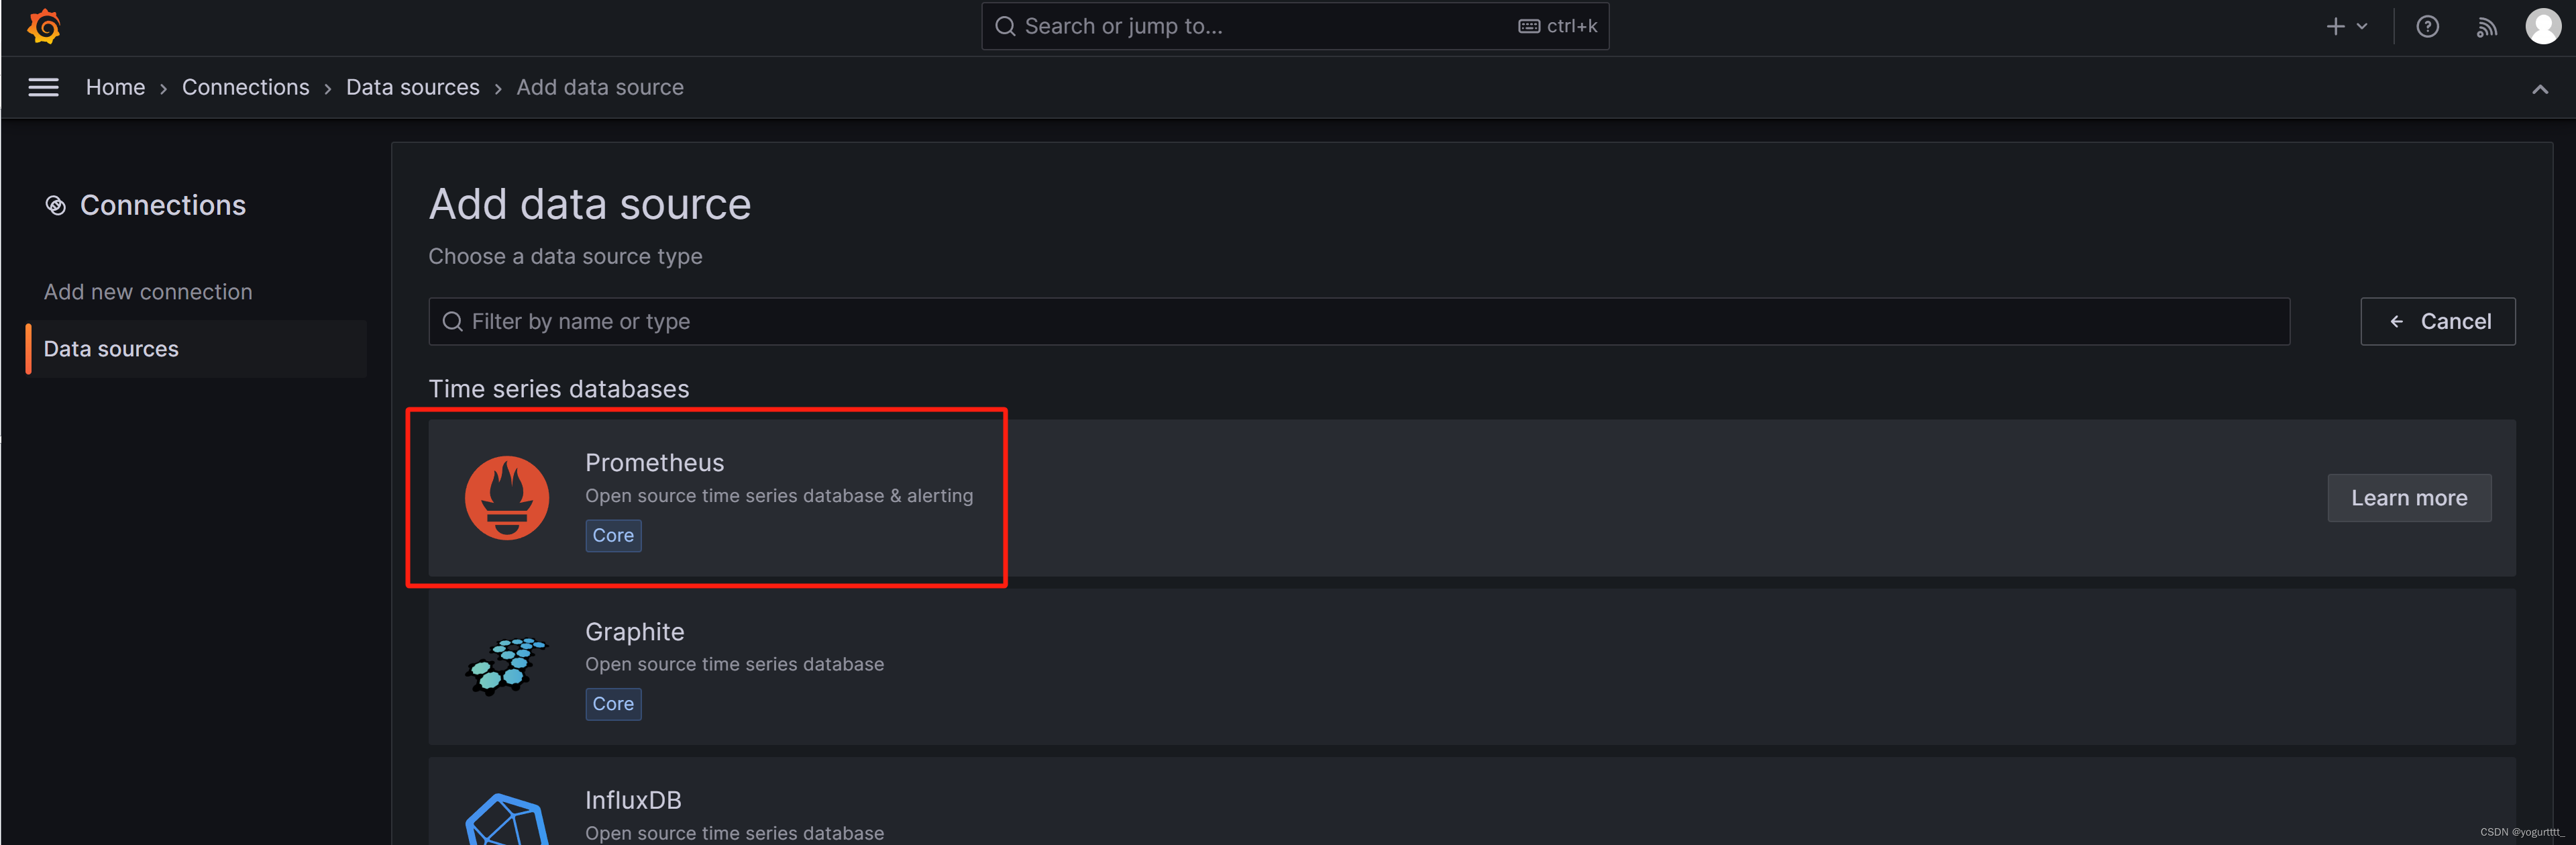
可视化页面操作
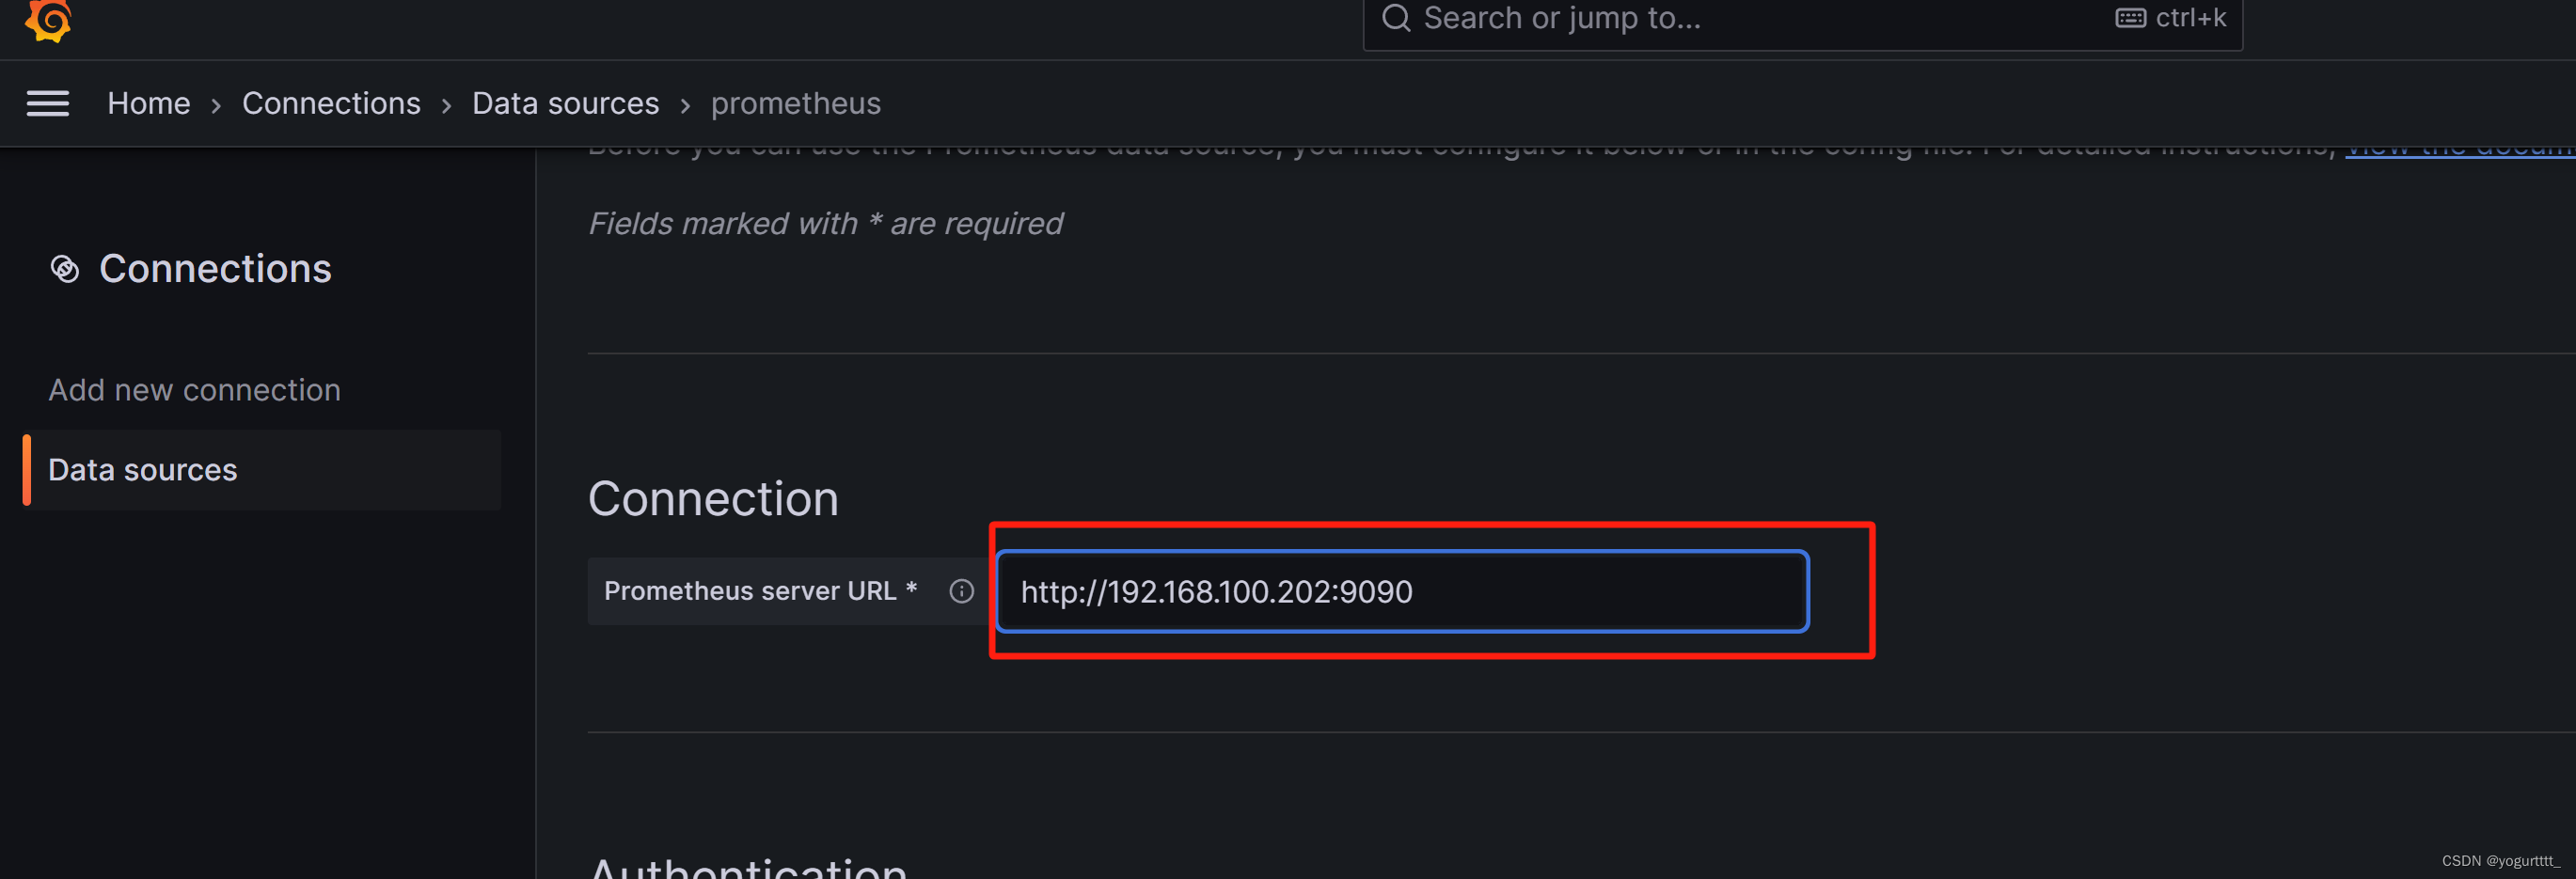
http://主节点 ip:3000进入到grafana页面,点击下面的”Add your first data source”
默认账号和密码:admin/admin
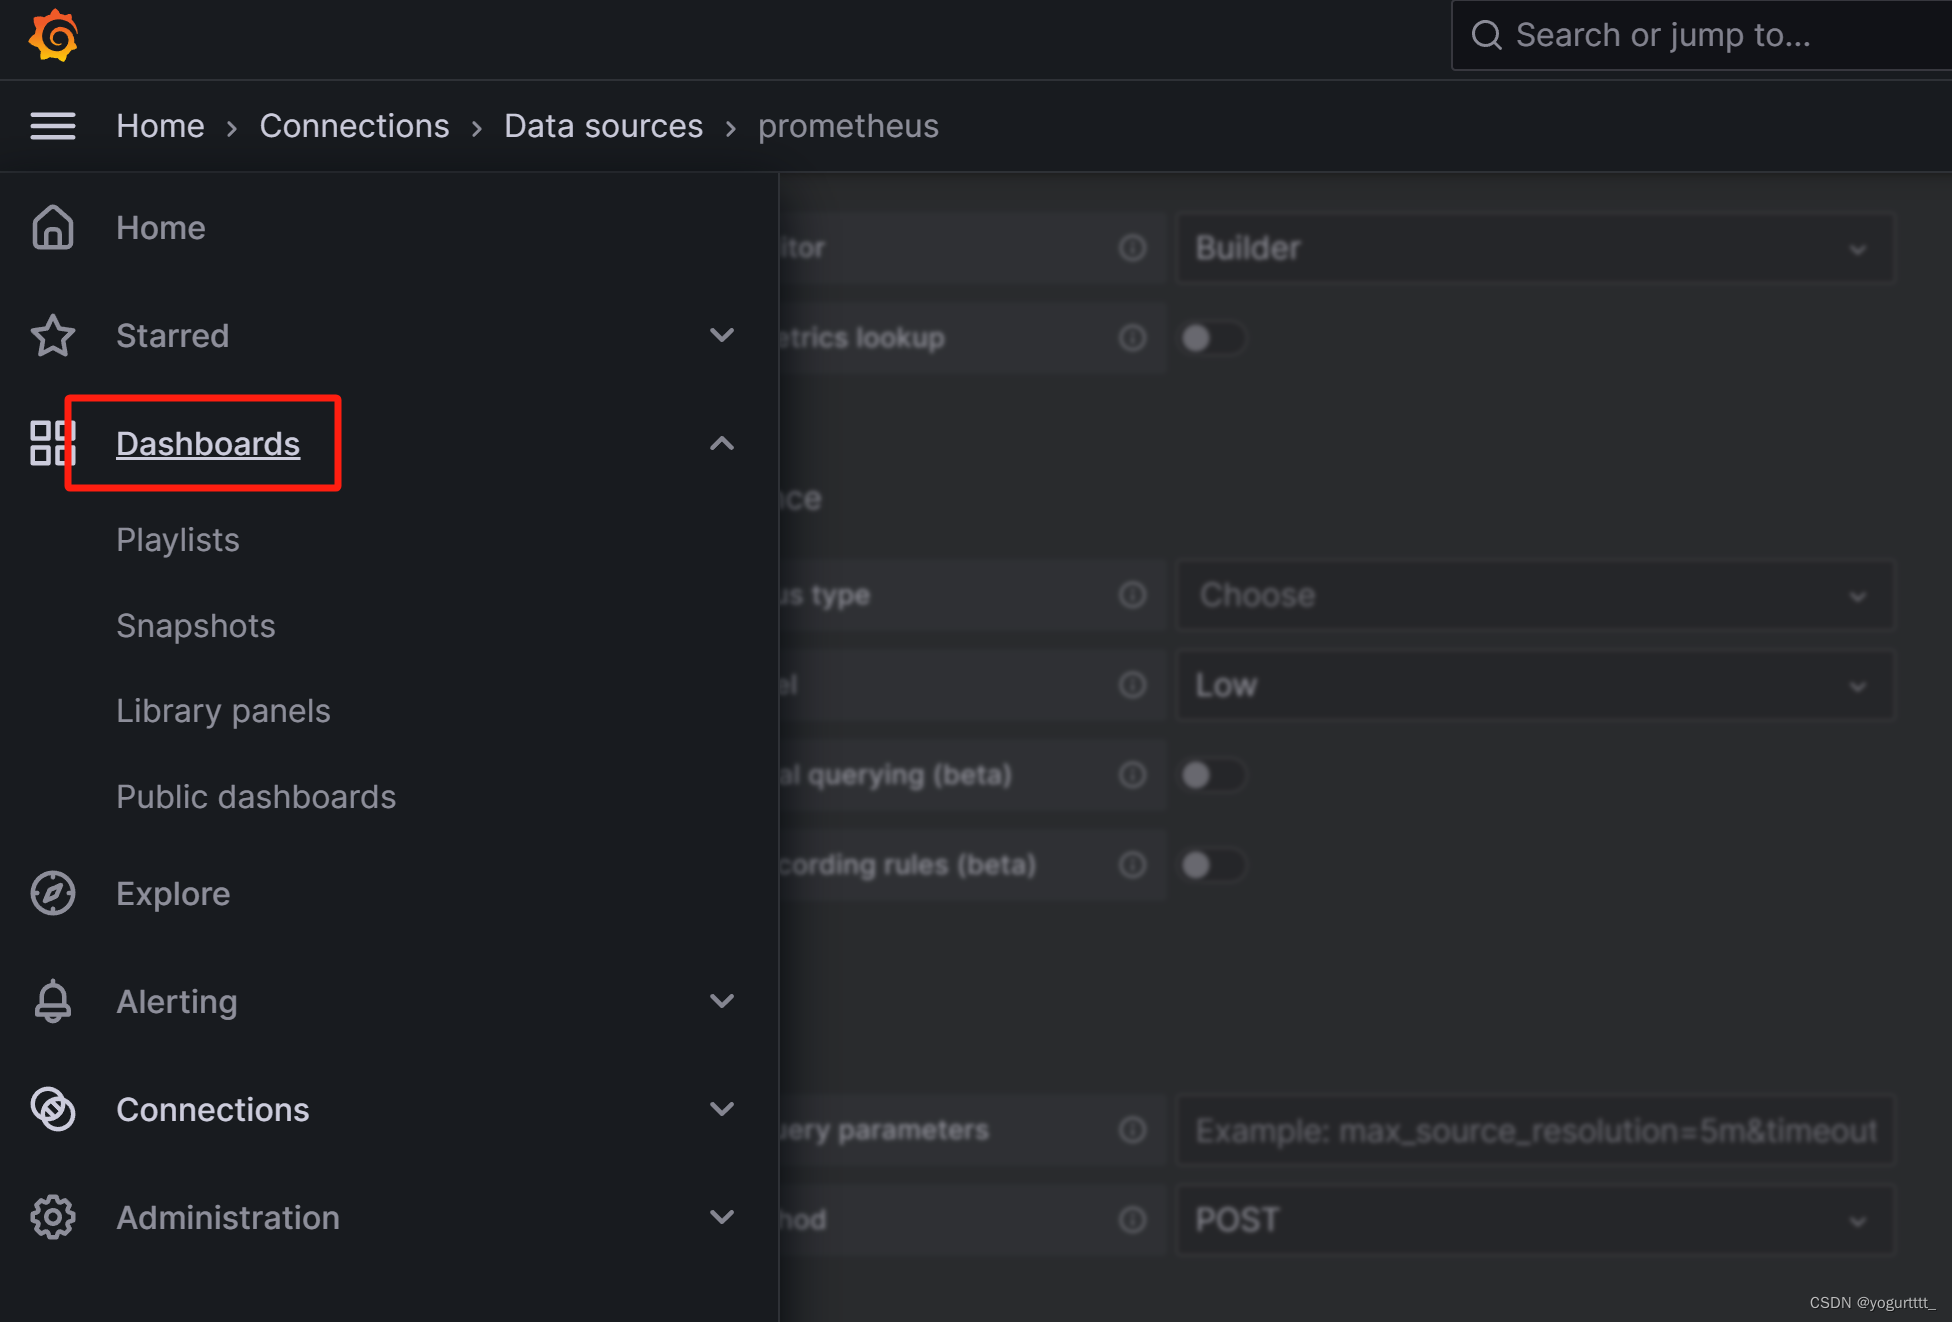
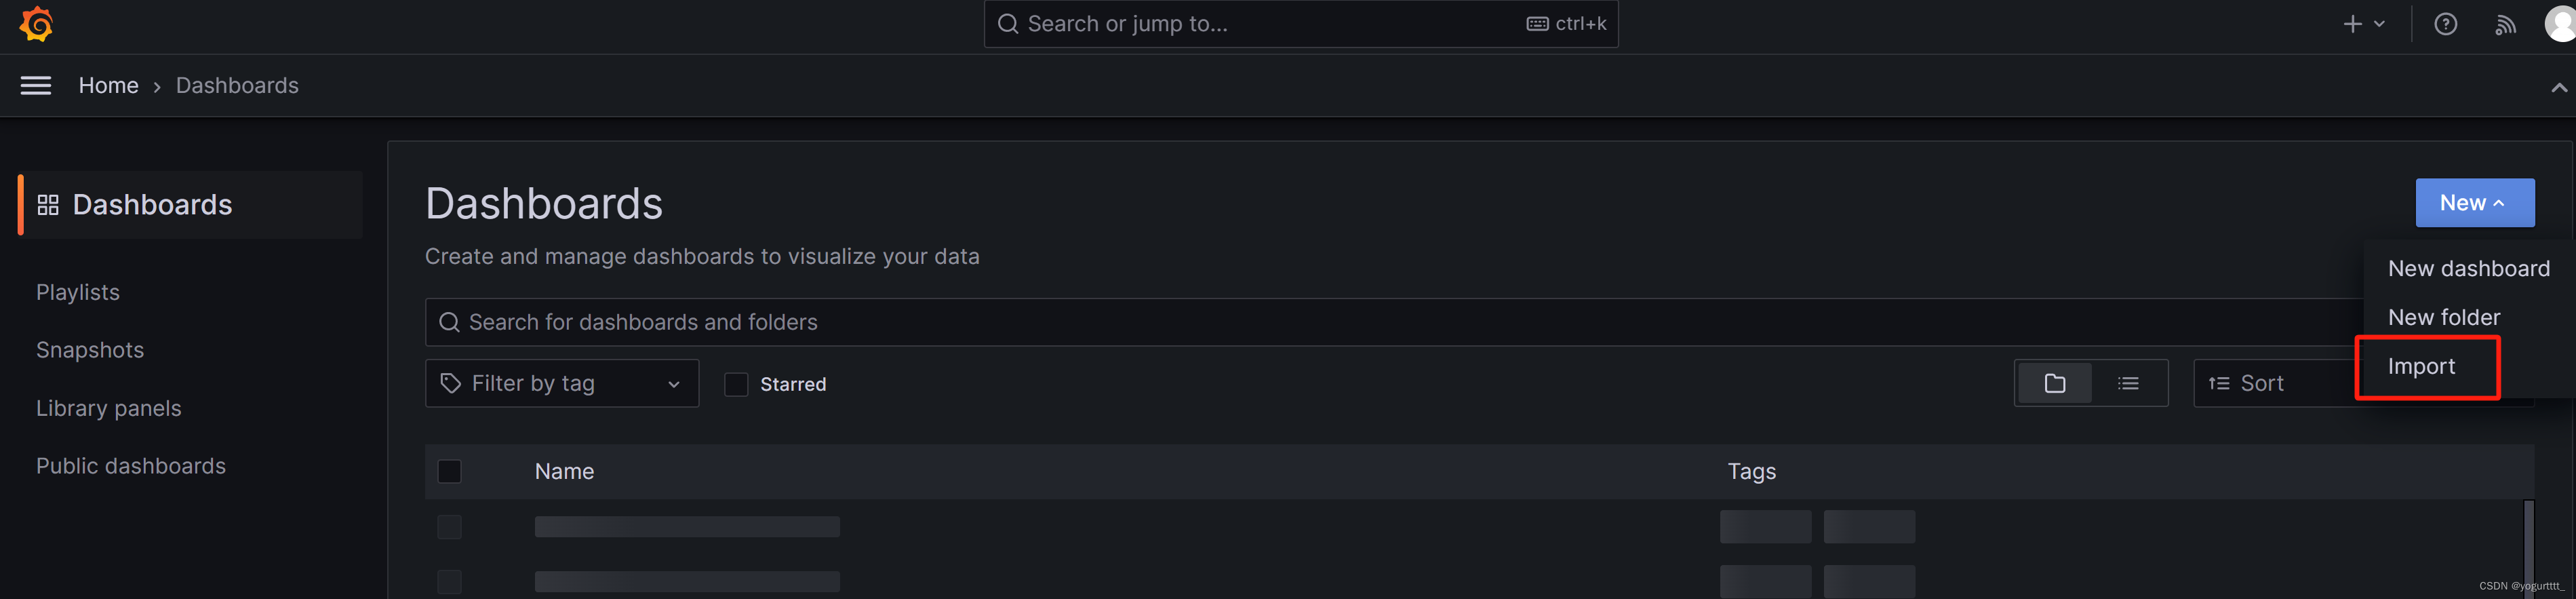
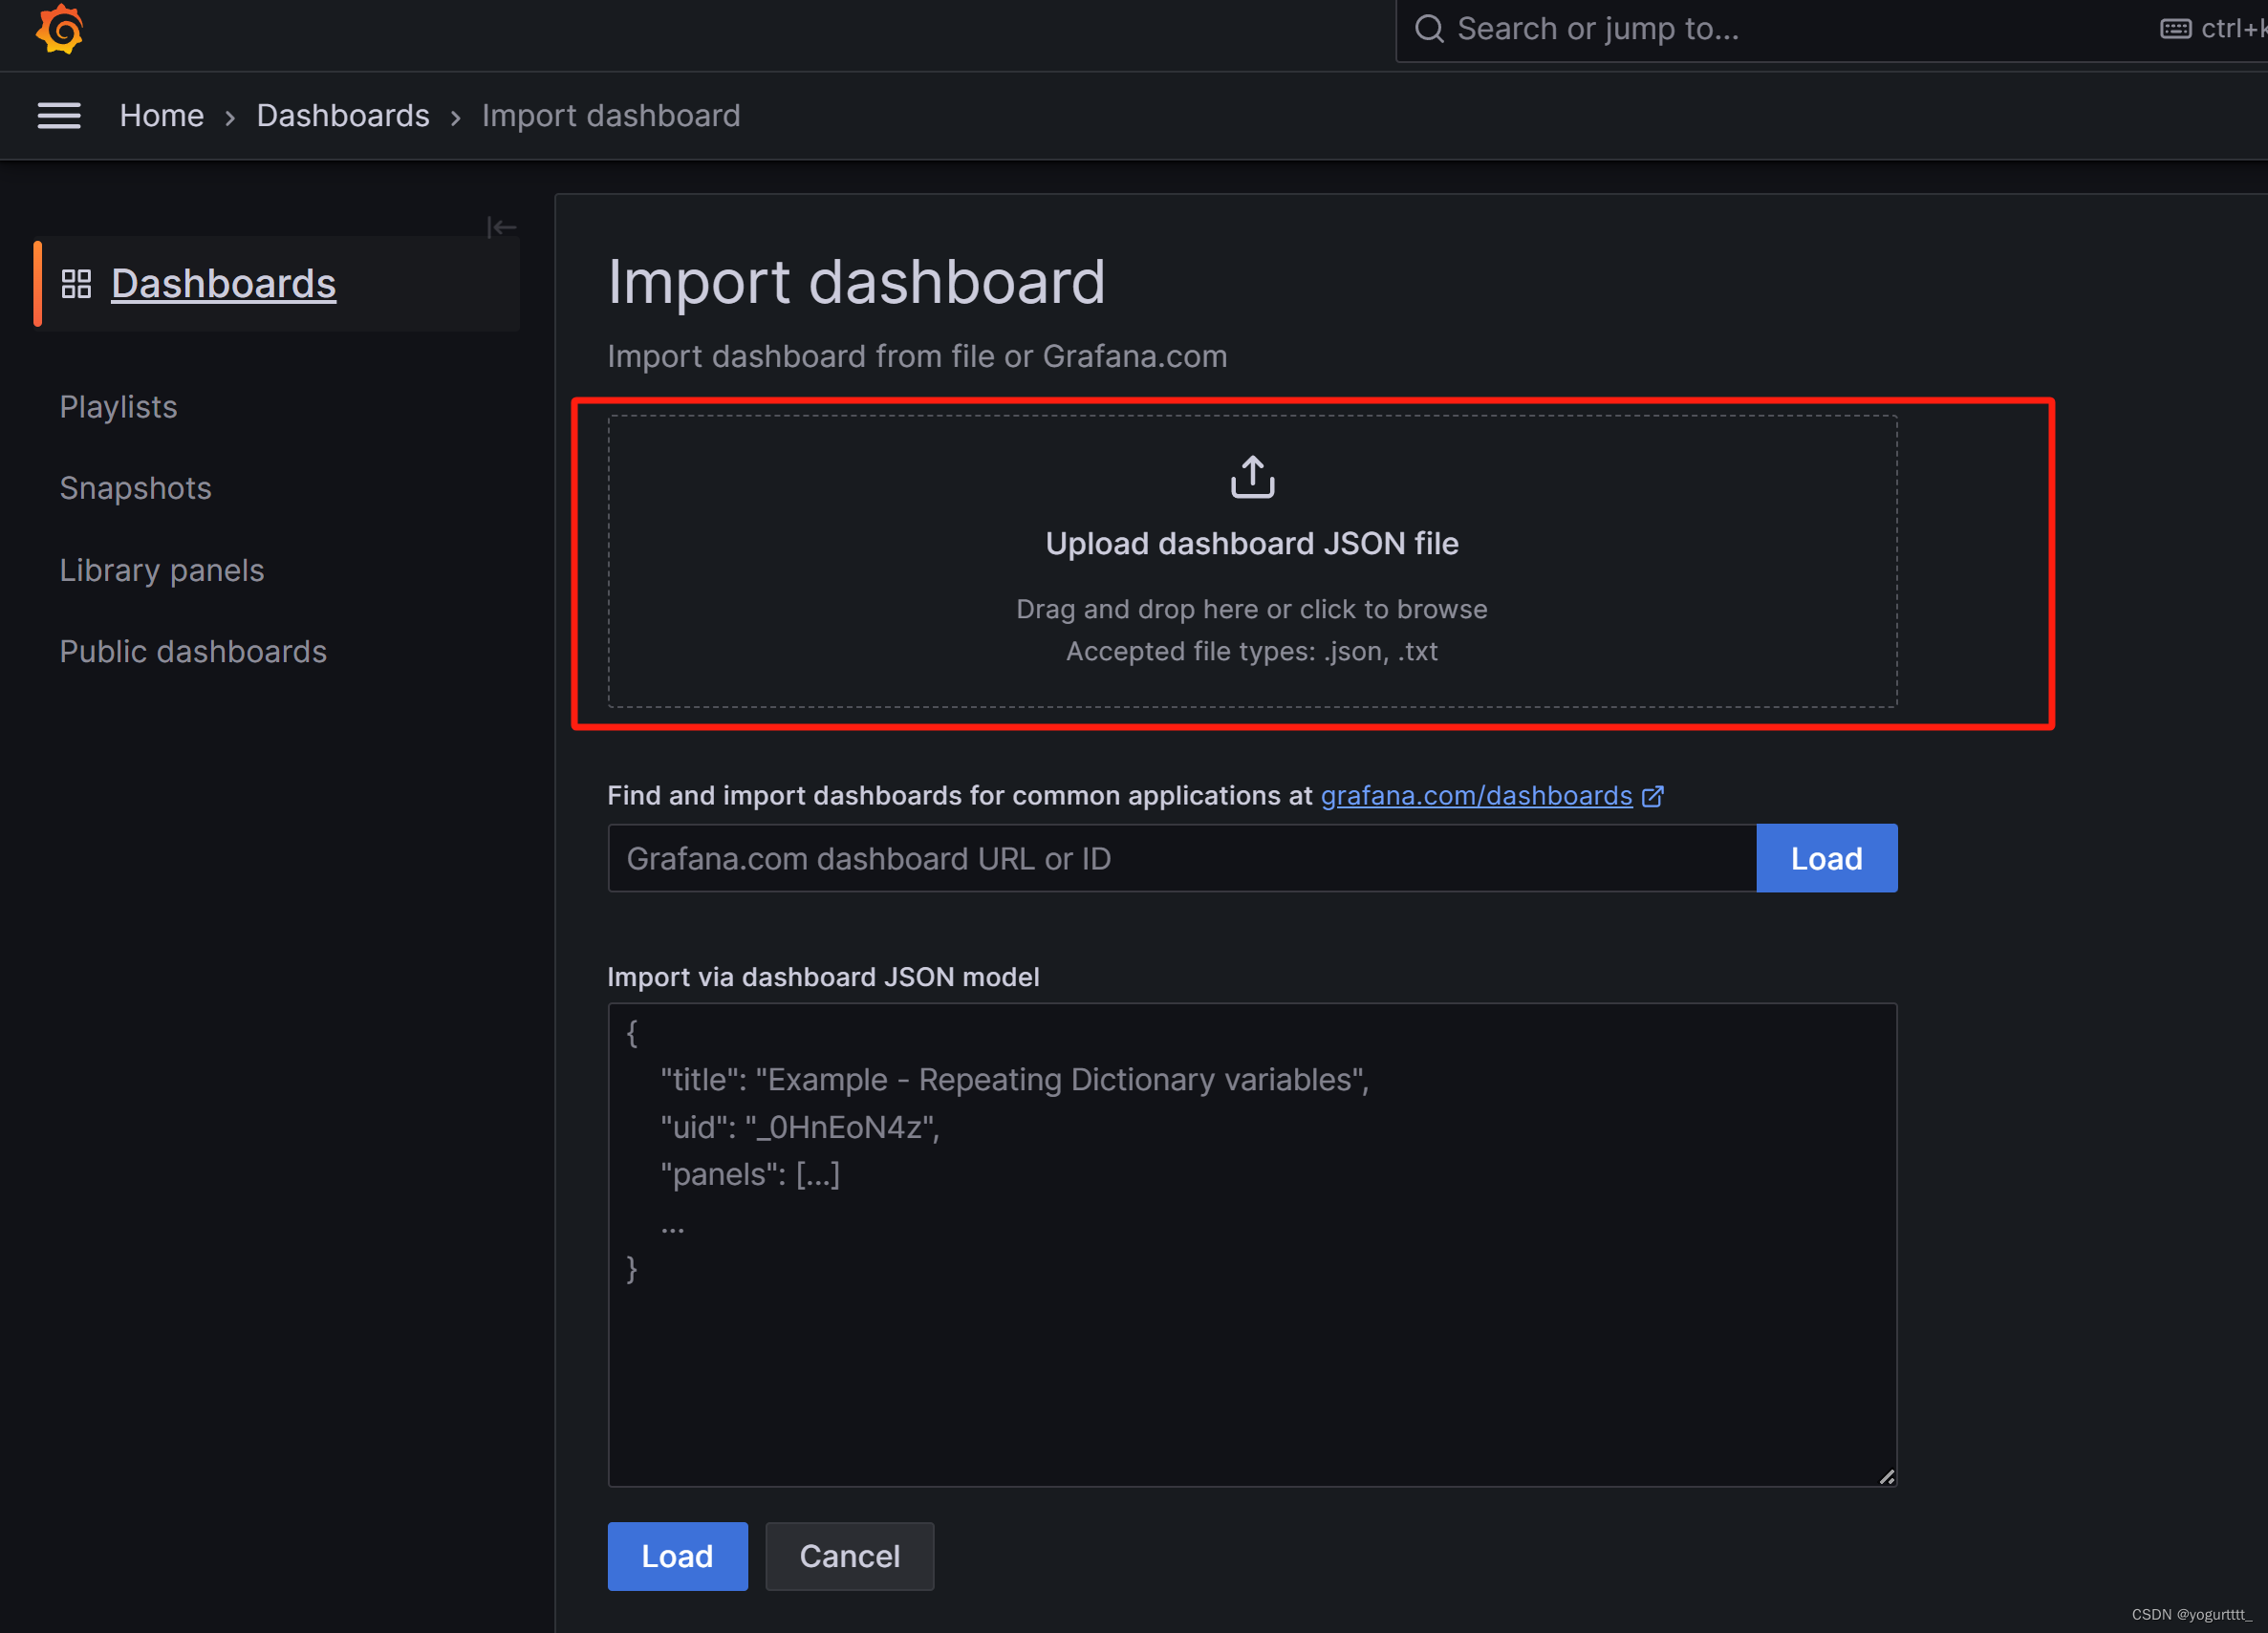 https://grafana.com/grafana/dashboards/可以找到json模板进行导入。
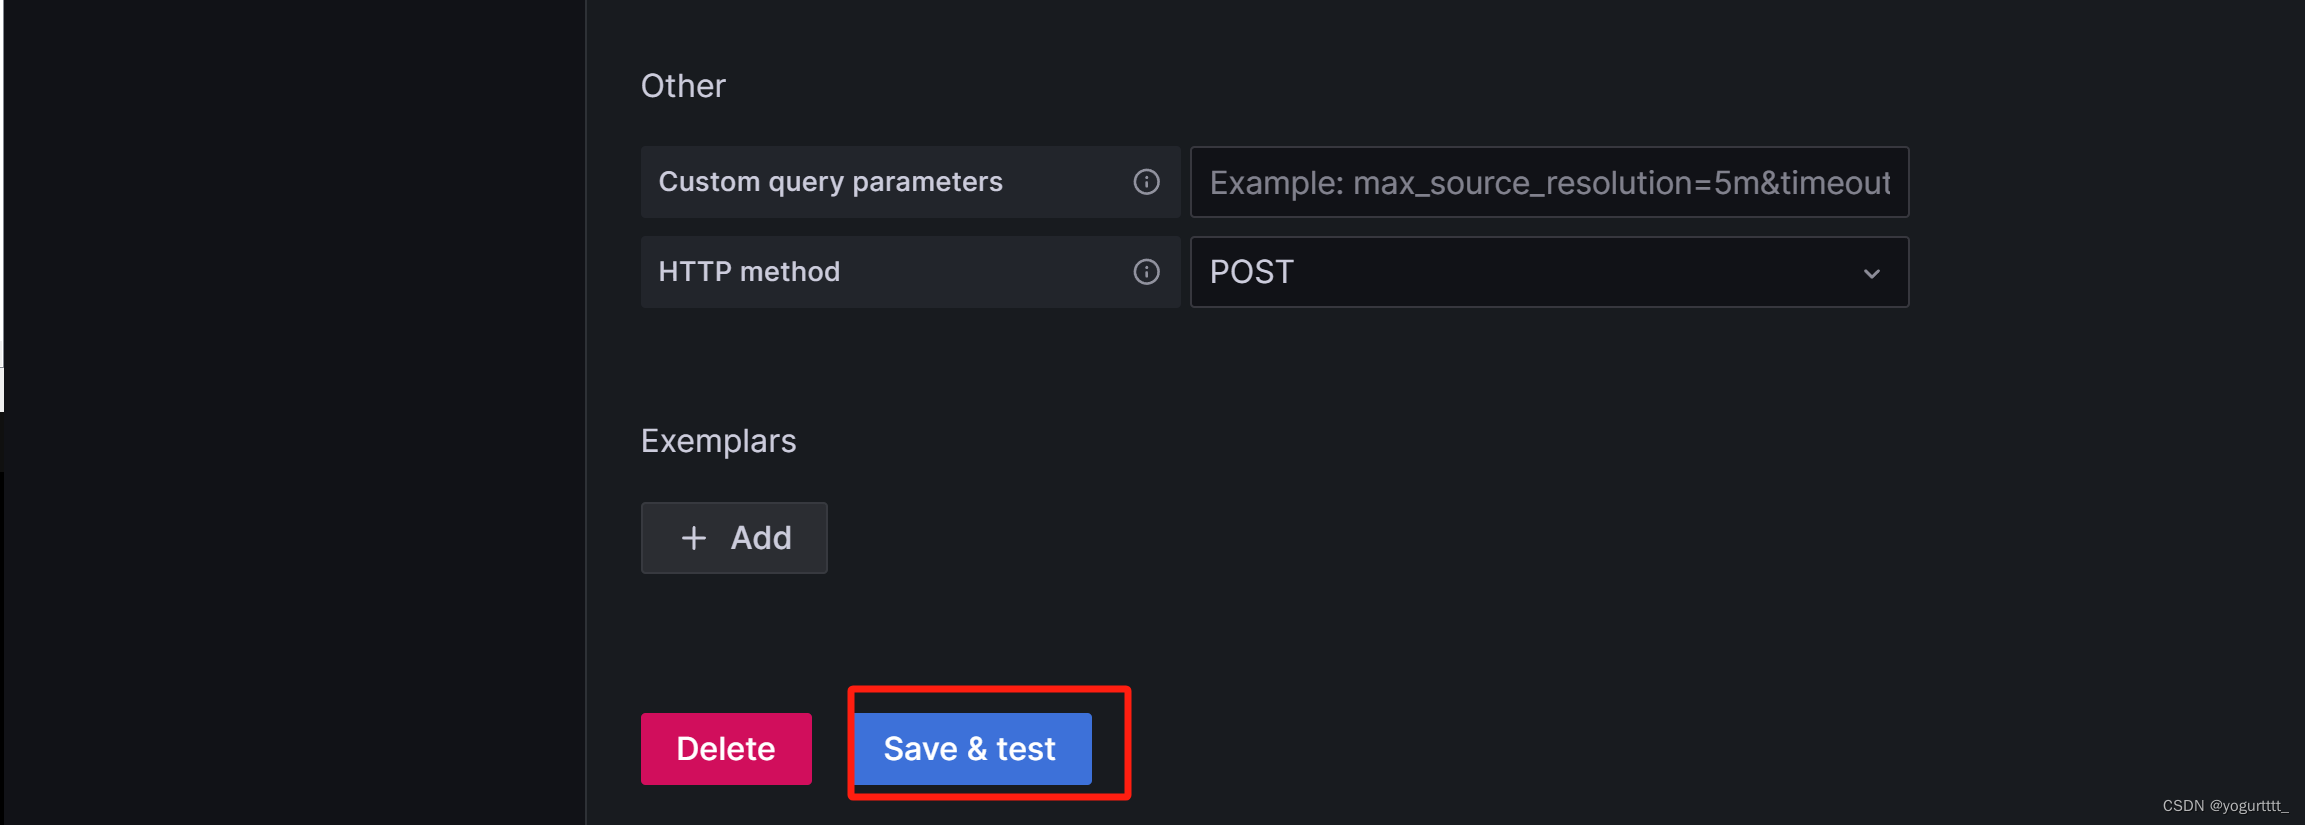
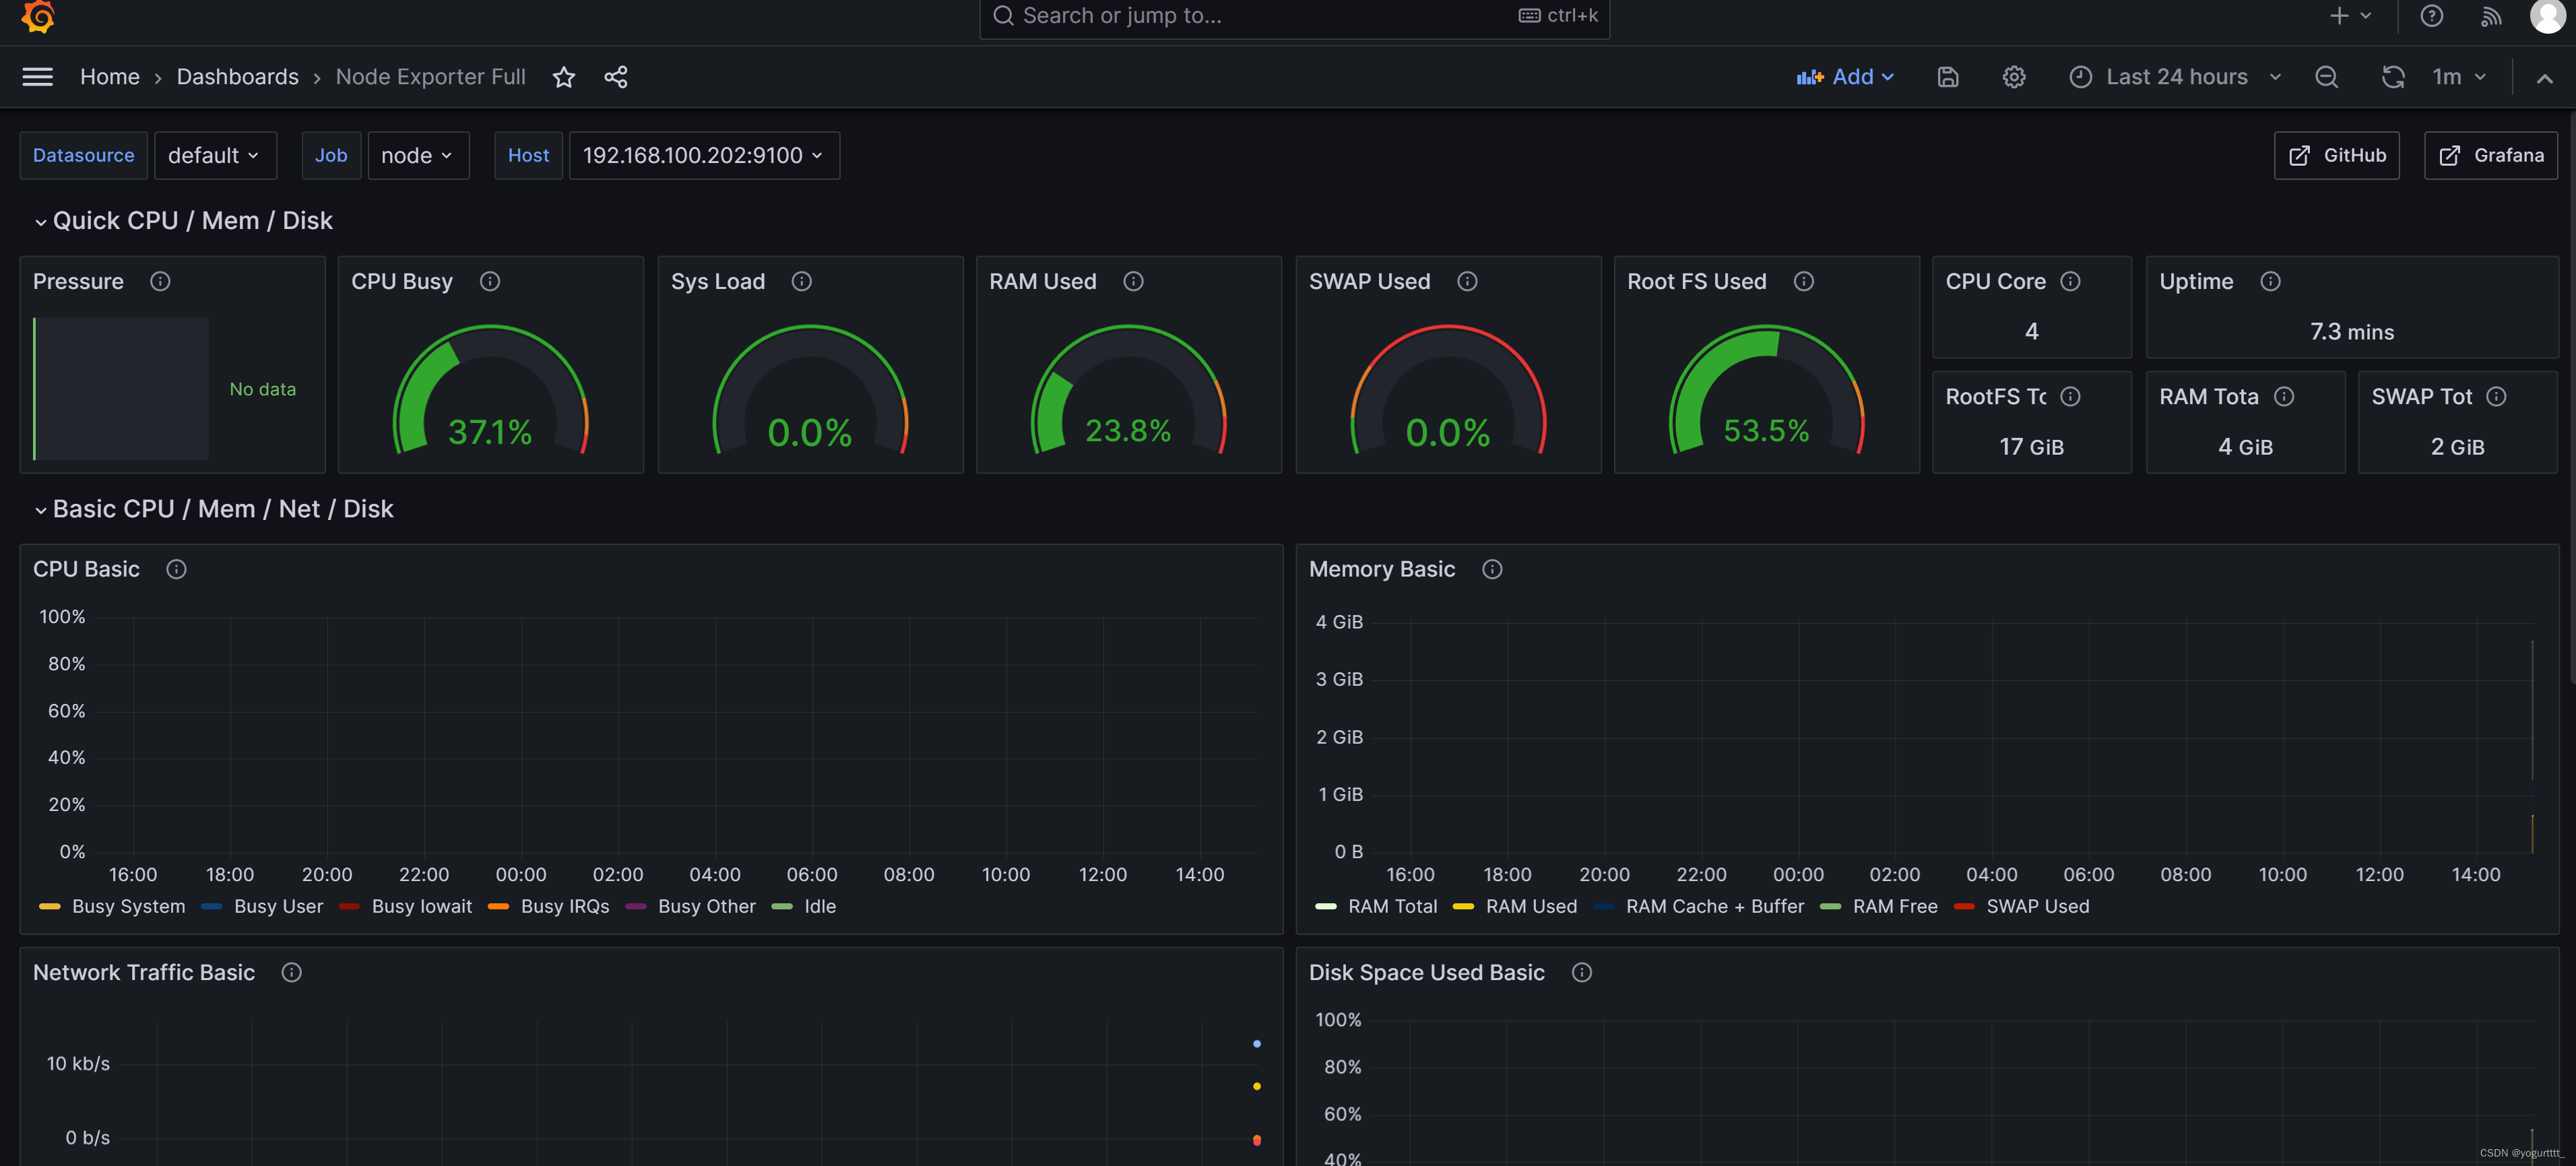
导入后就可以进行状态查看了。


 9782
9782


 被折叠的 条评论
为什么被折叠?
被折叠的 条评论
为什么被折叠?
 到【灌水乐园】发言


