


以qt官方的AreaChart Example 为例,学习简单的QT Charts的使用,更多教程请查看其他相关的案例。
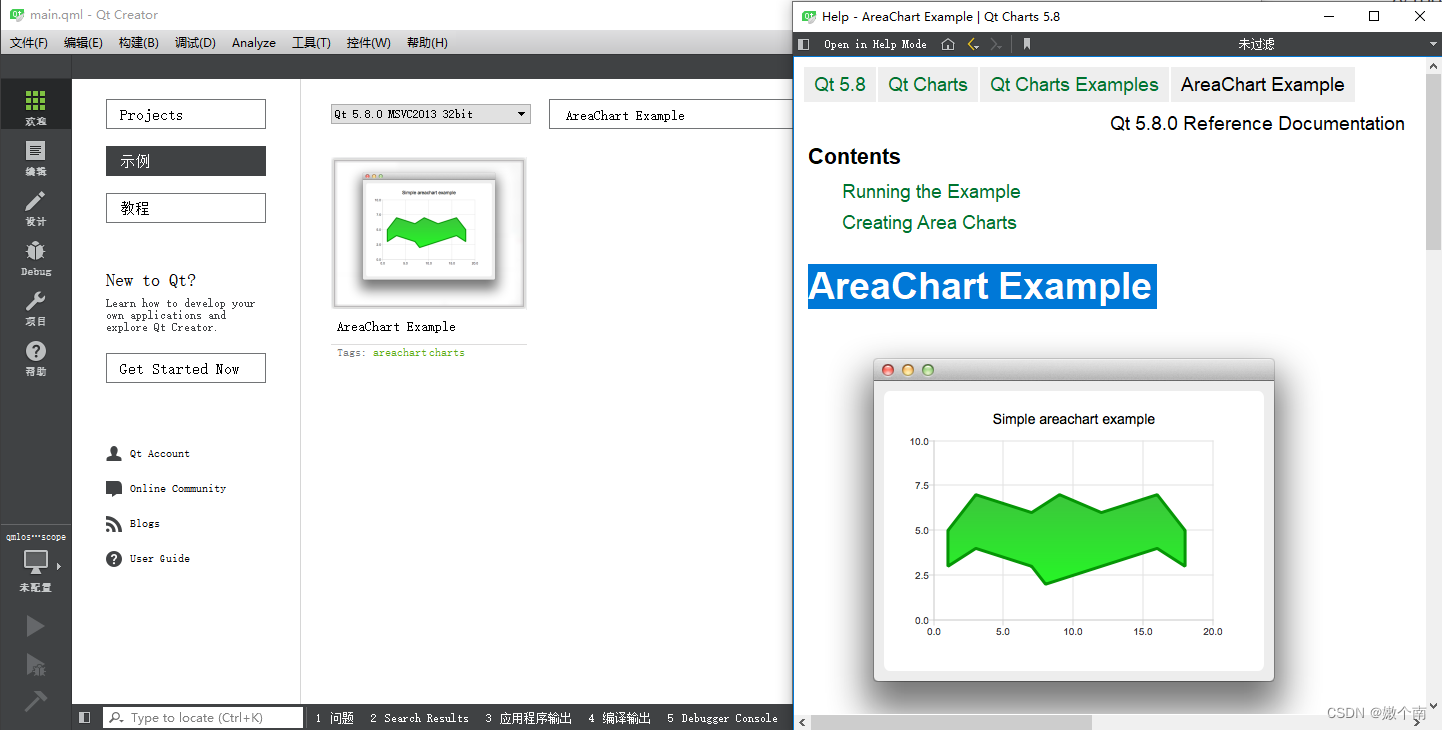
上图左边是qt creator中的实例,右边是帮助手册里面关于AreaChart示例的详细说明,下面主要根据帮助手册里的英文进行翻译,有兴趣的读者可以自行去查看相关的其他操作,这里只做一个抛砖引玉的作用,翻译的不好请谅解。
Running the Example——运行示例
To run the example from Qt Creator, open the Welcome mode and select the example from Examples. For more information, visit Building and Running an Example.
为了从Qt Creator运行示例,请打开 Welcome模式并从Examples中选择示例。
Creating Area Charts
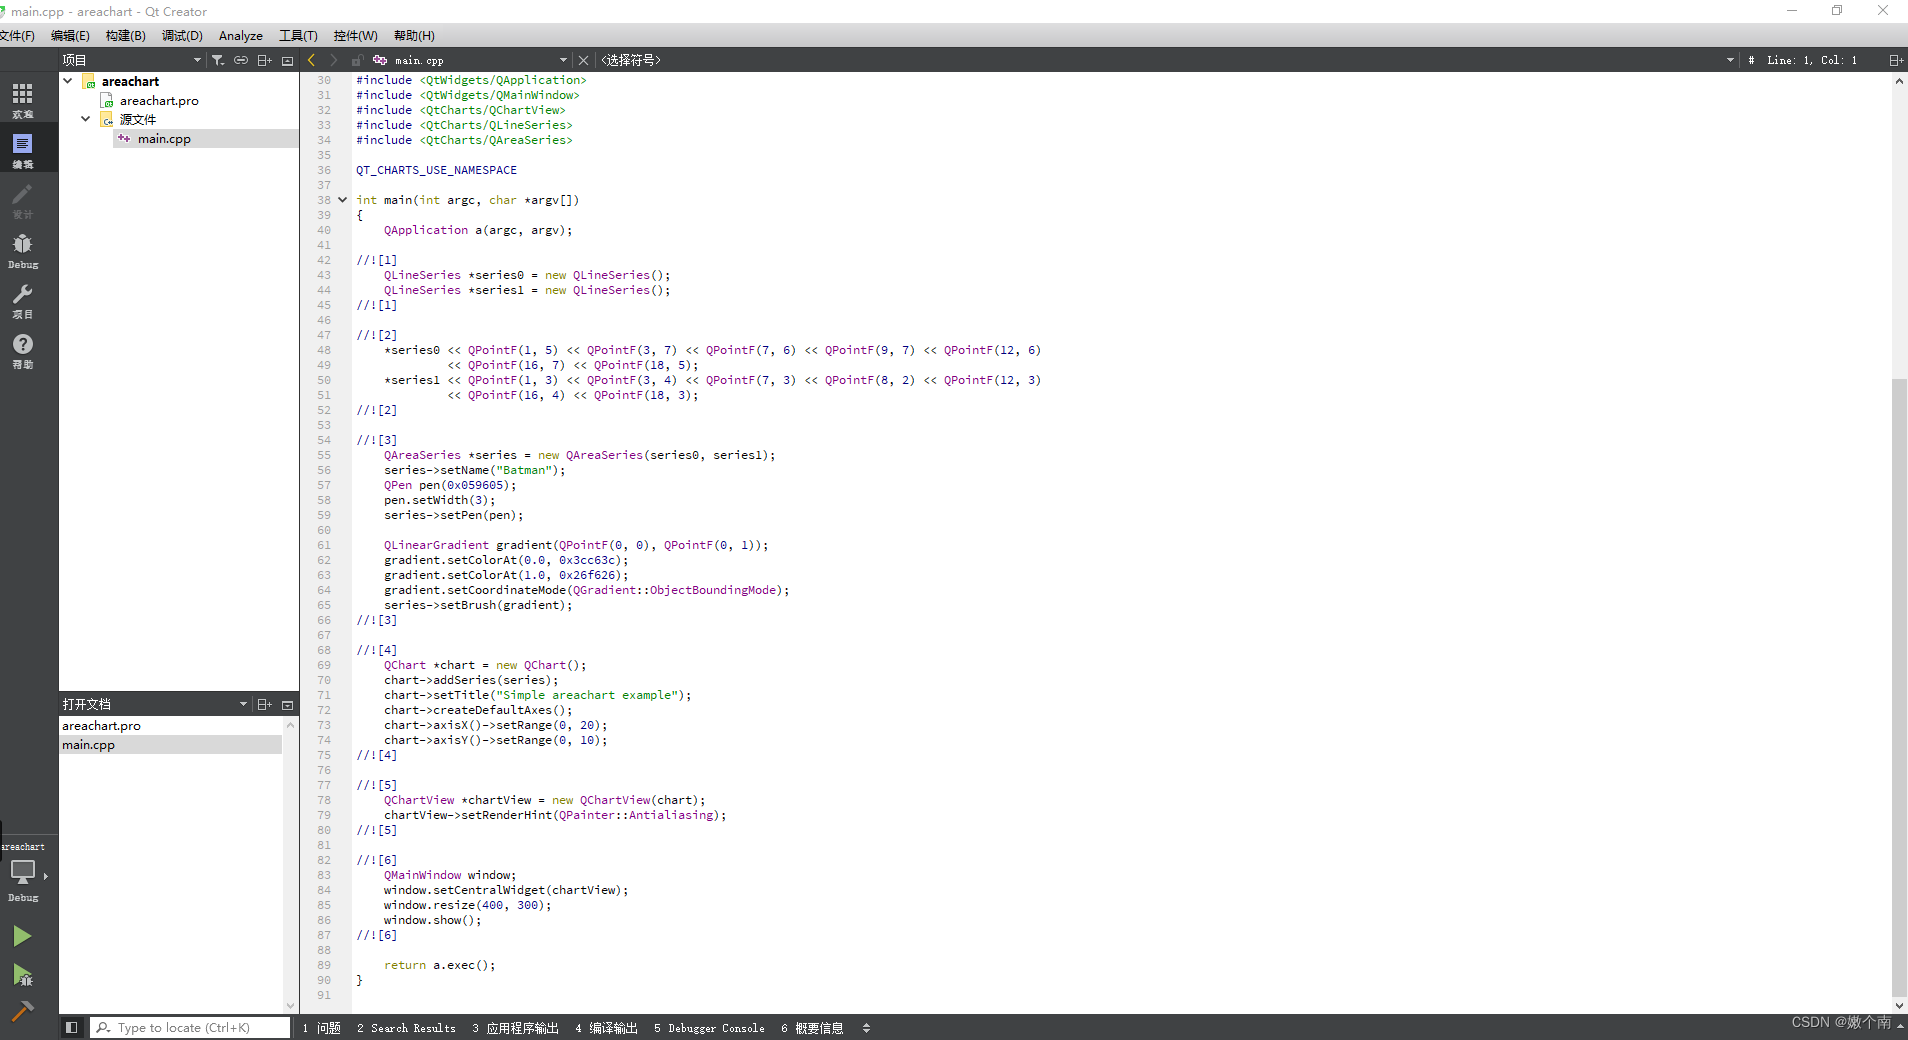
To create area charts, we need two QLineSeries instances. They are going to define the upper and lower boundary of the area.
为创建面积图,我们需要两个QLineSeries实例。他们将定义该区域的上下边界。
  QLineSeries *series0 = new QLineSeries();
  QLineSeries *series1 = new QLineSeries();
QLineSeries 具体是做什么的可以通过Qt自带的Assistant助手查看,如下图所示
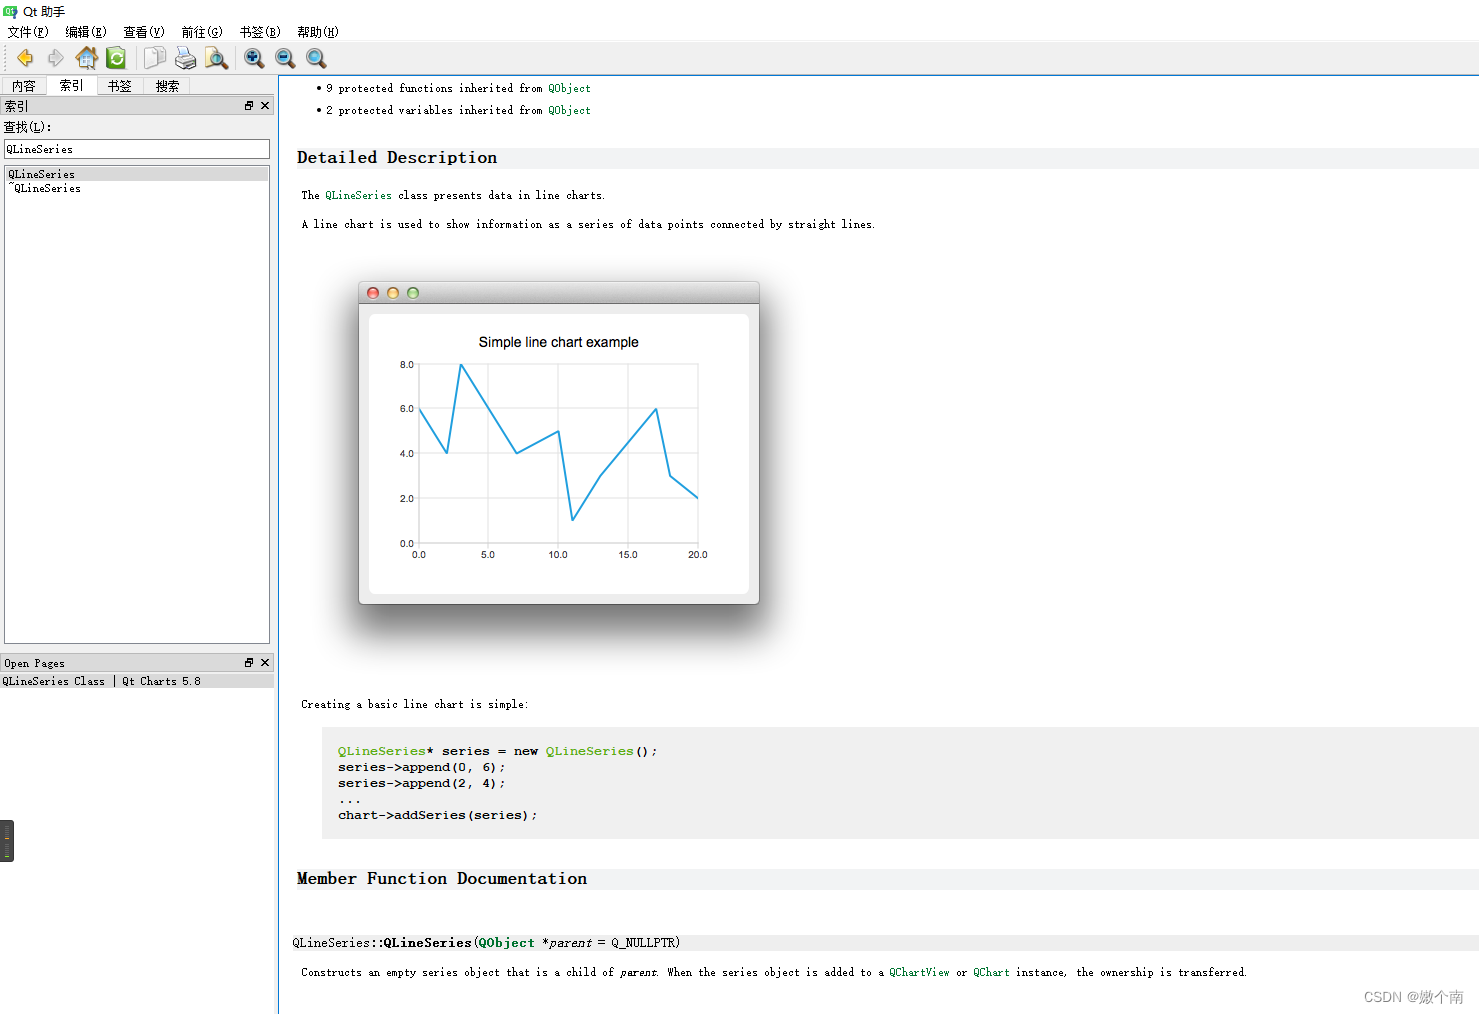
从文档中我们可知:
The QLineSeries class presents data in line charts.
A line chart is used to show information as a series of data points connected by straight lines.
即QLineSeries 是用于存放各个数据点的位置(x,y)。
We add data to both series and use the stream operator.
我们通过以下的方法将数据放在series中。
  *series0 << QPointF(1, 5) << QPointF(3, 7) << QPointF(7, 6) << QPointF(9, 7) << QPointF(12, 6)
           << QPointF(16, 7) << QPointF(18, 5);
  *series1 << QPointF(1, 3) << QPointF(3, 4) << QPointF(7, 3) << QPointF(8, 2) << QPointF(12, 3)
           << QPointF(16, 4) << QPointF(18, 3);
Now we create a QAreaSeries instance using two line series objects. We set the custom gradient fill and width of the outline.
然后使用两个line series对象创建一个QAreaSeries实例,设置自定义渐变填充和轮廓宽度。
  QAreaSeries *series = new QAreaSeries(series0, series1);
  series->setName("Batman");
  QPen pen(0x059605);
  pen.setWidth(3);
  series->setPen(pen);

  QLinearGradient gradient(QPointF(0, 0), QPointF(0, 1));
  gradient.setColorAt(0.0, 0x3cc63c);
  gradient.setColorAt(1.0, 0x26f626);
  gradient.setCoordinateMode(QGradient::ObjectBoundingMode);
  series->setBrush(gradient);
QAreaSeries和QLinearGradient请查Assistant助手查看详细说明,如果要花面积图需要以上步骤,如果只是绘制折线图,以上两个对象可以不使用。以下为绘制折线图的说明。
Last we create the QChartView instance, set the title, set anti-aliasing, and add the area series. We also create the default axes and specify the ranges on them.
最后,创建QChartView实例,设置标题,设置抗锯齿,并添加区域序列。创建默认轴并指定轴上的范围。
  QChart *chart = new QChart();
  chart->addSeries(series);
  chart->setTitle("Simple areachart example");
  chart->createDefaultAxes();
  chart->axisX()->setRange(0, 20);
  chart->axisY()->setRange(0, 10);
以上就是QChart的使用,addSeries表示加入数据,setTitle表示添加标题,createDefaultAxes表基于已添加到图表中的series为图表创建坐标轴,具体参考QT Assistant助手中的说明,最后两行设置X、Y轴范围。关于QChart更多的用法参考QT Assistant助手中的说明,具体用法见图2。
The chart is ready to be shown.
最后创建QChartView显示。
  QChartView *chartView = new QChartView(chart);
  chartView->setRenderHint(QPainter::Antialiasing);
其他需要说明的内容
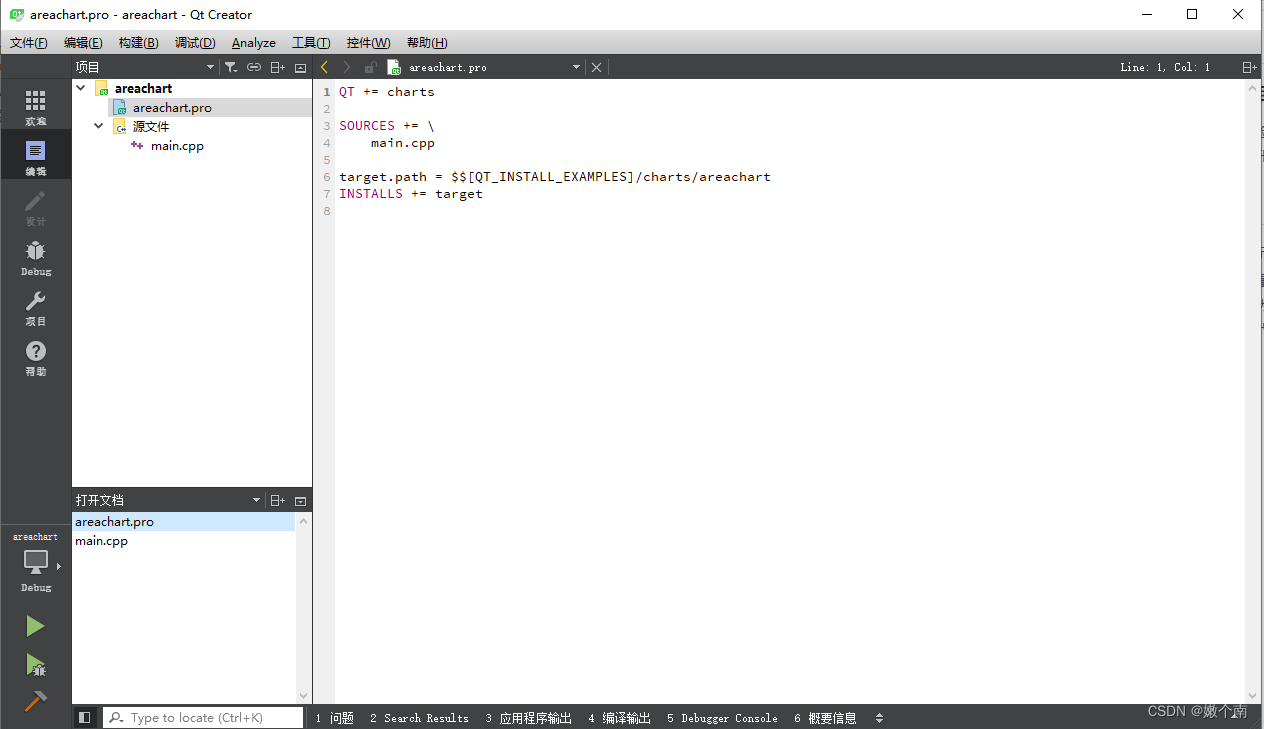
1、项目中的.pro文件
.pro文件中需要添加 QT += charts
2、main.cpp中怎么调用QCharView类
*QMainWindow window;
window.setCentralWidget(chartView);
window.resize(400, 300);
window.show();*
window.setCentralWidget(xxxx);是所有qt界面程序的入口,实际使用工程中可以是其他界面类,然后在界面里调用QCharView对象的实例或者继承自QCharView类后再实例化,显示折线图。


 1713
1713


 被折叠的 条评论
为什么被折叠?
被折叠的 条评论
为什么被折叠?
 到【灌水乐园】发言


