# -*- coding: utf-8 -*-
import matplotlib as mpl
import matplotlib.pyplot as plt
import numpy as np
plt.style.use('classic')

plt.rcParams['font.sans-serif'] = ['SimHei'] #解决中文显示
plt.rcParams['axes.unicode_minus'] = False #解决符号无法显示

x=np.array([1,2,3,4,5,6,7,8])
y1=np.array([3,5,35,300,800,600,1200,4000])
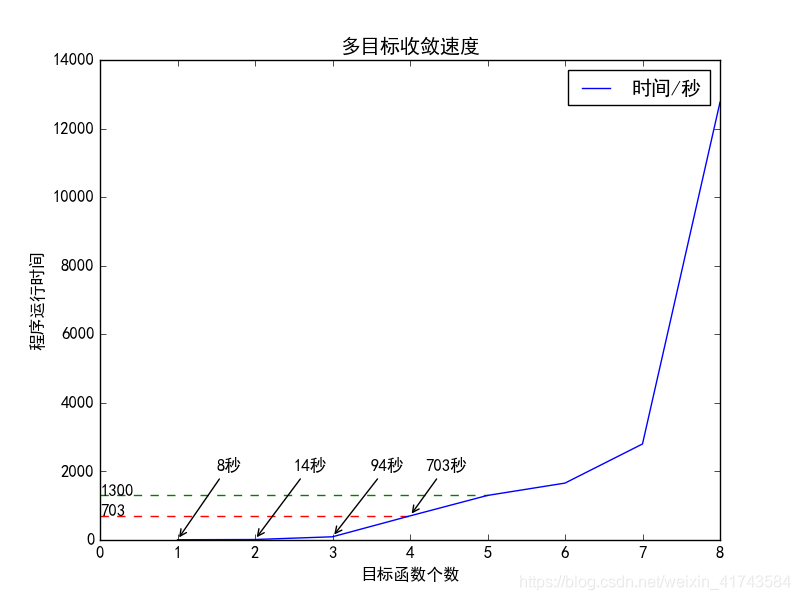
y2=np.array([8,14,94,703,1300,1660,2801,12768])

fig1 = plt.figure()

ax = plt.axes()
ax.plot(x, y2,label='时间/秒')
ax.set(xlabel='目标函数个数', ylabel='程序运行时间',title='多目标收敛速度')

plt.hlines(703, 0, 4, colors='r', linestyle="--")
plt.text(0, 703, "703")
plt.hlines(1300, 0, 5, colors='g', linestyle="--")
plt.text(0, 1300, "1300")

# annotate
plt.annotate("703秒", (4,703), xycoords='data',
             xytext=(4.2, 2000),
             arrowprops=dict(arrowstyle='->'))
plt.annotate("94秒", (3,94), xycoords='data',
             xytext=(3.5, 2000),
             arrowprops=dict(arrowstyle='->'))
plt.annotate("14秒", (2,14), xycoords='data',
             xytext=(2.5, 2000),
             arrowprops=dict(arrowstyle='->'))
plt.annotate("8秒", (1,8), xycoords='data',
             xytext=(1.5, 2000),
             arrowprops=dict(arrowstyle='->'))
plt.legend()
plt.show()
fig1.savefig('my_figure1.png')

import numpy as np
from matplotlib import pyplot as plt
from matplotlib.path import Path
from matplotlib.patches import PathPatch

# Use seaborn to change the default graphics to something nicer
import seaborn as sns
# And set a nice color palette
sns.set_color_codes('deep')

# Create the plot object
fig, ax = plt.subplots(figsize=(5, 4))
x = np.linspace(0, 1000)

# Add finishing constraint: x2 <= 100/2 - x1/2
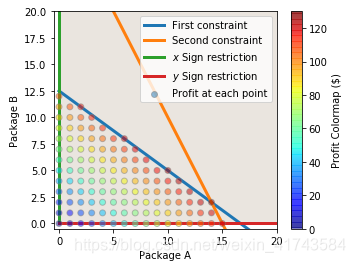
plt.plot(x, 50/4 - 3*x/4, linewidth=3, label='First constraint')
plt.fill_between(x, 0, 100/2 - x/2, alpha=0.1)

# Add carpentry constraint: x2 <= 80 - x1
plt.plot(x, 30 - 2*x, linewidth=3, label='Second constraint')
plt.fill_between(x, 0, 100 - 2*x, alpha=0.1)

# Add non-negativity constraints
plt.plot(np.zeros_like(x), x, linewidth=3, label='$x$ Sign restriction')
plt.plot(x, np.zeros_like(x), linewidth=3, label='$y$ Sign restriction')

#====================================================
# This part is different from giapetto_feasible.py
# Plot the possible (x1, x2) pairs
pairs = [(x, y) for x in np.arange(101)
                for y in np.arange(101)
                if (300*x + 400*y) <= 5000
                and (200*x + 100*y) <= 3000]

# Split these into our variables
chairs, tables = np.hsplit(np.array(pairs), 2)

# Caculate the objective function at each pair
z =8*chairs + 9*tables

# Plot the results
plt.scatter(chairs, tables, c=z, cmap='jet', edgecolor='gray', alpha=0.5, label='Profit at each point', zorder=3)

# Colorbar
cb = plt.colorbar()
cb.set_label('Profit Colormap ($)')
#====================================================

# Labels and stuff
plt.xlabel('Package A')
plt.ylabel('Package B')
plt.xlim(-0.5, 20)
plt.ylim(-0.5, 20)
plt.legend()
fig01 = plt.figure()
plt.show()


 633
633

 被折叠的 条评论
为什么被折叠?


