


python获取图片坐标系中的图形,将其展示到新的坐标系中,并存储到excel中
1.原始图片
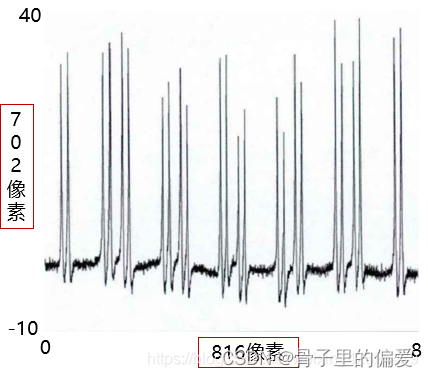
2.重新定义转换的图片
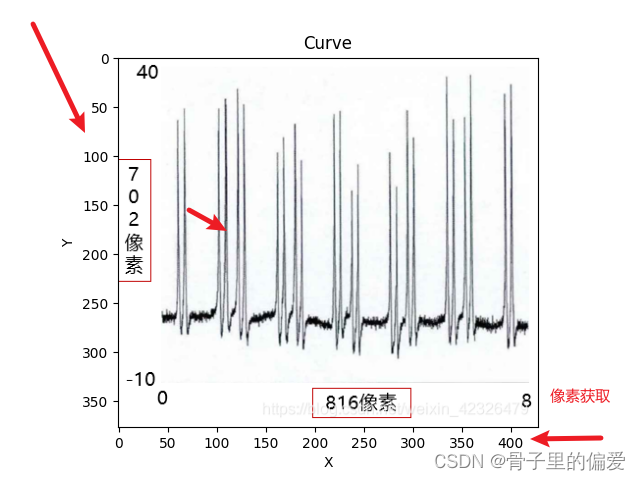
3.代码展示
import cv2
import numpy as np
import matplotlib.pyplot as plt
import pandas as pd

def get_curve_vertices(lines):
    vertices = []
    for line in lines:
        x1, y1, x2, y2 = line[0]
        vertices.append((x1, y1))
        vertices.append((x2, y2))
    vertices = np.array(vertices)

    connectivity = 4
    output = cv2.connectedComponentsWithStats(blurred, connectivity, cv2.CV_32S)
    labels = output[1]
    stats = output[2]

    curve_labels = np.unique(labels)
    curve_labels = curve_labels[1:]

    curve_vertices = []
    for label in curve_labels:
        index = np.where(labels == label)
        curve_pixels = vertices[index]
        curve_center = np.mean(curve_pixels, axis=0)
        curve_vertices.append(curve_center)

    return curve_vertices

image_path = "path/to/image.jpg"
output_path = "path/to/output.xlsx"

image = cv2.imread(image_path)
gray = cv2.cvtColor(image, cv2.COLOR_BGR2GRAY)
blurred = cv2.GaussianBlur(gray, (5, 5), 0)
edges = cv2.Canny(blurred, 50, 150)
lines = cv2.HoughLinesP(edges, 1, np.pi/180, threshold=100, minLineLength=100, maxLineGap=10)

curve_vertices = get_curve_vertices(lines)
x = [pt[0] for pt in curve_vertices]
y = [pt[1] for pt in curve_vertices]

# 创建画布并绘制图形
fig, ax = plt.subplots()
ax.imshow(cv2.cvtColor(image, cv2.COLOR_BGR2RGB))
ax.plot(x, y, '-o', color='red', linewidth=2)
plt.xlabel('X')
plt.ylabel('Y')
plt.title('Curve')
plt.show()

data = {'X': x, 'Y': y}
df = pd.DataFrame(data)
df.to_excel(output_path, index=False)
import cv2
import numpy as np
import matplotlib.pyplot as plt
import pandas as pd

def get_curve_vertices(mask):
    """
    提取曲线的顶点坐标
    """
    contours, _ = cv2.findContours(mask, cv2.RETR_EXTERNAL, cv2.CHAIN_APPROX_SIMPLE)
    curve_vertices = []

    for contour in contours:
        for point in contour:
            curve_vertices.append((point[0][0], point[0][1]))

    return curve_vertices

image_path = "C:/Users/zhangchang/Desktop/pictureDeal/006.png"
output_path = "C:/Users/zhangchang/Desktop/pictureDeal/output6.xlsx"

image = cv2.imread(image_path)
hsv = cv2.cvtColor(image, cv2.COLOR_BGR2HSV)

# 定义颜色范围(红色)
lower_color = np.array([0, 120, 70])
upper_color = np.array([10, 255, 255])

mask = cv2.inRange(hsv, lower_color, upper_color)
curve_vertices = get_curve_vertices(mask)
x = [pt[0] for pt in curve_vertices]
y = [pt[1] for pt in curve_vertices]

# 创建画布并绘制图形
fig, ax = plt.subplots()
ax.imshow(cv2.cvtColor(image, cv2.COLOR_BGR2RGB))
ax.plot(x, y, color='red', linewidth=2)
plt.xlabel('X')
plt.ylabel('Y')
plt.title('Z')
plt.show()

# 保存到Excel文件
data = {'x': x, 'Y': y}
df = pd.DataFrame(data)
df.to_excel(output_path, index=False)
4.获取到坐标存储到excel中


 被折叠的 条评论
为什么被折叠?
被折叠的 条评论
为什么被折叠?
 到【灌水乐园】发言


