


使用R语言的shiny包画一个时钟
第一次接触shiny包,是一个非常有趣的R包,可以快速创建一个与用户交互的UI。这里介绍一个简单的例子,用shiny包做一个会随时间变化的时钟。
## 导入shiny包
library(shiny)

#ui端的代码
ui <- fluidPage(
  titlePanel("Hello Shiny!"),
  sidebarLayout(
    sidebarPanel(
    ),
    mainPanel(
      plotOutput(outputId = "distPlot")
    )
  )
)

#server端的代码
server <- function(input, output, session) {
  output$distPlot <- renderPlot({
    ## 设置每1000ms更新一次,即一秒一次
    invalidateLater(1000, session)
    ## 获取系统当前时间
    time <- Sys.time()
    ## 提取出时分秒
    H <-  as.numeric(str_sub(time, 12, 13))
    if(H > 12){ # 将24h制转化成12h制
      H <- H - 12
    }
    # 分秒
    M <- as.numeric(str_sub(time, 15, 16))
    S <- as.numeric(str_sub(time, 18, 19))
    # 12个钟点的位置,可以通过4.2的大小调整其具体中心点的位置
    x <- 5 + 4.2*c(0, 1/2, sqrt(3)/2, 1, sqrt(3)/2, 1/2, 0, -1/2, -sqrt(3)/2, -1,  -sqrt(3)/2, -1/2)
    y <- 5 + 4.2*c(1, sqrt(3)/2, 1/2, 0, -1/2, -sqrt(3)/2, -1,  -sqrt(3)/2, -1/2, 0, 1/2, sqrt(3)/2)
    # 12个钟点的label
    labs <- c(12, 1:11)
    ## 时针的位置,即画一条线段
    Z_H_x <- c(5, 5+.4*(5*sin(H*2*pi/12)))
    Z_H_y <- c(5, 5+.4*(5*cos(H*2*pi/12)))
    ## 分针的位置
    Z_M_x <- c(5, 5+.5*(5*sin(M*2*pi/60)))
    Z_M_y <- c(5, 5+.5*(5*cos(M*2*pi/60)))
    ## 秒针的位置
    Z_S_x <- c(5, 5+.6*(5*sin(S*2*pi/60)))
    Z_S_y <- c(5, 5+.6*(5*cos(S*2*pi/60)))
    ## 通过ggplot绘制当前时分秒下钟图,会随着时间不断更新
    ggplot()+
      geom_point(aes(x = 5, y = 5), size = 150, color = "grey30")+
      geom_point(aes(x = 5, y = 5), size = 100, color = "white")+
      geom_point(aes(x =x, y = y), color = "White", size = 15)+
      geom_text(aes(x =x, y = y, label = labs), color = "black", size = 10)+
      geom_line(aes(x =Z_H_x, y = Z_H_y), color = "black", size = 3)+
      geom_line(aes(x =Z_M_x, y = Z_M_y), color = "black", size = 2)+
      geom_line(aes(x =Z_S_x, y = Z_S_y), color = "red", size = 1)+
      geom_point(aes(x = 5, y = 5), size = 5, color = "black")+
      xlim(c(0, 10))+
      ylim(c(0, 10))+
      coord_fixed()+ # 确保比例恒定
      theme_bw()
      })
}
## 运行APP
shinyApp(ui = ui, server = server)
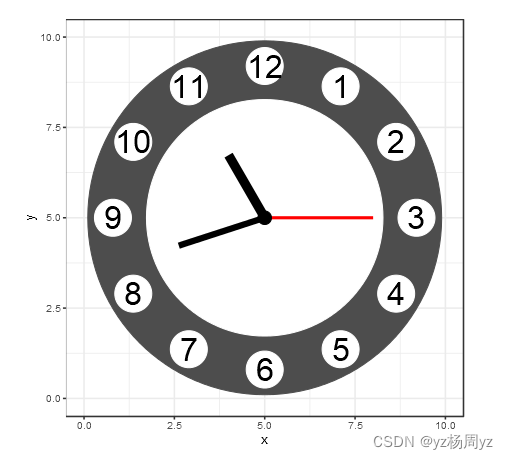
运行效果
程序能够较为流畅地刷新时钟地效果图,总体达到了较好的模拟时钟的效果,感兴趣的同学可以对时钟再进行深入的优化。
Rshiny时钟


 2173
2173


 被折叠的 条评论
为什么被折叠?
被折叠的 条评论
为什么被折叠?
 到【灌水乐园】发言


