


来个需求,需要图形统计,以前写vue图形统计都是用echarts,时间紧迫,我就想echarts 有没有reactnative的插件?结果还真有。
安装
yarn add @wuba/react-native-echarts echarts
yarn add react-native-svg
import React, { useRef, useEffect,useState } from 'react';
import * as echarts from 'echarts/core';
import {View,Text,Image,Dimensions,TouchableOpacity} from 'react-native';
import { BarChart } from 'echarts/charts';
import {Toast,ActivityIndicator } from '@ant-design/react-native'
import {
ToolboxComponent,
LegendComponent,
TooltipComponent,
DataZoomComponent,
} from 'echarts/components';
import { SVGRenderer, SvgChart } from '@wuba/react-native-echarts';
// echarts.use([SVGRenderer, LineChart, BarChart]);
echarts.use([
SVGRenderer,
BarChart,
ToolboxComponent,
TooltipComponent,
LegendComponent,
DataZoomComponent,
]);
function getOption(ylist:[],onlinList:[],offList:[],userList:[]) {
const option = {
title: {
text: ''
},
tooltip: {
trigger: 'axis',
axisPointer: {
type: 'shadow'
}
},
// legend: {},
grid: {
left: '3%',
right: '4%',
bottom: '2%',
top: 5,
containLabel: true
},
splitLine: {
show: true,
lineStyle: {
color: '#FFCE82',
width: 0.5,
},
},
xAxis: {
axisLabel: { // 隐藏刻度线
show: false
},
},
yAxis: {
type: 'category',
data: ylist,
axisTick: { // 隐藏刻度线
show: false
},
},
series: [
{
name: '线上',
type: 'bar',
data: onlinList,
itemStyle: {
color: '#369AFF', // 设置线的颜色为红色
width: 3,
},
barGap: 0,
// barCategoryGap: 0,
},
{
name: '线下',
type: 'bar',
data: offList,
itemStyle: {
color: '#53D475', // 设置线的颜色为红色
width: 3,
},
barGap: 0,
// barCategoryGap: 0,
},
{
name: '用户',
type: 'bar',
data: userList,
itemStyle: {
color: '#F1DF69', // 设置线的颜色为红色
width: 3,
},
barGap: 0,
// barCategoryGap: 0,
}
]
};
return option
}
export default function Revenuestatistics() {
const svgRef = useRef<any>(null);
const [day,setDay] = useState()
const [loding,setloding] = useState(false)
useEffect(() => {
setloding(true)
getData().then((res:any)=>{
setloding(false)
const ylist = []
const onlinList = []
const offList = []
const userList = []
res.data.vos.forEach((v:any)=>{
ylist.push(v.addressName)
onlinList.push(v.onlineNum)
offList.push(v.offlineNum)
userList.push(v.customerNum)
})
const option = getOption(ylist,onlinList,offList,userList)
let chart = echarts.init(svgRef.current, 'light', {
renderer: 'svg',
width: Dimensions.get('window').width,
height: Dimensions.get('window').height-200,
});
chart.setOption(option);
return () => chart?.dispose();
}).catch((err:any)=>{
setloding(false)
})
}, []);
return <View>
<View style={{flexDirection:'row'}}>
<View style={{flexDirection:'row',alignItems:'center',paddingHorizontal:10}}>
<Image style={{width:18,height:18,marginRight:10}} source={require('../../assets/images/Chart4.png')} />
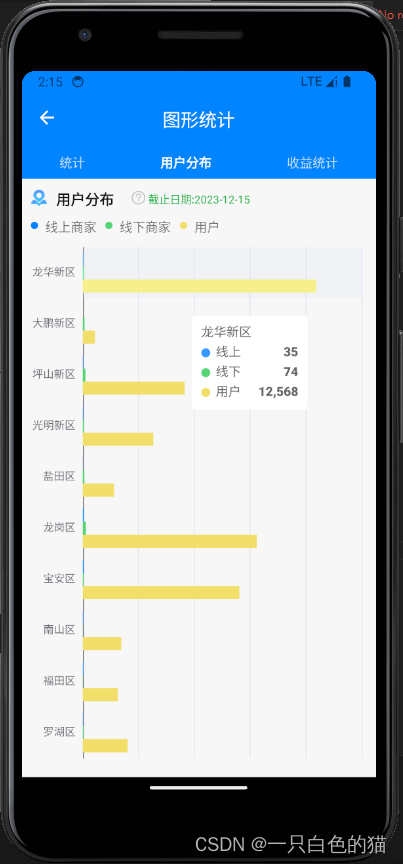
<Text style={{color:'#171717',fontSize:16,fontWeight:'bold'}}>用户分布</Text>
</View>
</View>
<View style = {{flexDirection:'row',padding:10}}>
<View style = {{flexDirection:'row',alignItems:'center',}}>
{/* 小圆球 */}
<View style={{width:8,height:8,backgroundColor:'#0084FF',borderRadius:5}}></View>
<Text style={{marginLeft:8}}>线上商家</Text>
</View>
<View style = {{flexDirection:'row',alignItems:'center',marginHorizontal:10}}>
{/* 小圆球 */}
<View style={{width:8,height:8,backgroundColor:'#53D475',borderRadius:5}}></View>
<Text style={{marginLeft:8}} >线下商家</Text>
</View>
<View style = {{flexDirection:'row',alignItems:'center'}}>
{/* 小圆球 */}
<View style={{width:8,height:8,backgroundColor:'#F1DF69',borderRadius:5}}></View>
<Text style={{marginLeft:8}} >用户</Text>
</View>
</View>
{loding ?<ActivityIndicator/> : <SvgChart ref={svgRef} />}
</View>
}


 595
595


 被折叠的 条评论
为什么被折叠?
被折叠的 条评论
为什么被折叠?
 到【灌水乐园】发言


