


基于vue3 和 F2 3.5.0
<template>
  <div :style="{minHeight: `${height}px`,width: '100%' }" ref="container">
    <canvas v-show="showChart"  :id="chartId" class="chart-canval"></canvas>
    <empty-box v-show="!showChart"></empty-box>
  </div>
</template>

<script setup lang="ts">
import {ref, onMounted} from 'vue'
import F2 from '@antv/f2/lib/index-all.js';

const props = defineProps({
  height: {
    type: Number,
    default: 300,
    required: false
  },
  chartId: {
    type: String,
    default: 'barChart'
  },
  group: {
    type: Boolean,
    default: true
  },
  color: {
    type: String,
    default: 'itemName'
  },
  colorArray: {
    type: Array,
    default: ['l(90) 0:#BFDCFDFF 1:#458BFFFF','l(90) 0:#CFF4F3FF 1:#73E3CBFF','#7357F6FF', '#459EF5FF', '#78D86CFF', '#97DFD8FF', '#F0BD58FF', '#7DBBF8FF', '#A1E498FF', '#B6E9E4FF', '#F5D18AFF', '#B5D8FBFF', '#C9EFC4FF', '#D5F2EFFF', '#F9E5BCFF'],
    // default: ['#459EF5FF','#97DFD8FF','#84BBF0FF','#F0BD58FF','#7357F6FF'],
  },
  legendPosition: {
    type: String,
    default: 'bottom'
  },
  unit: {
    type: String,
    default: ''
  },
  intervalPositionX: {
    type: String,
    default: 'xValue'
  },
  intervalPositionY: {
    type: String,
    default: 'yValue'
  },
  isScrollBar: {
    type: Boolean,
    default: false
  },
  adjustType: {
    type: String,
    default: 'dodge'
  },
  intervalSize: {
    type: Number,
    default: 15
  },
  transposed: {
    type: Boolean,
    default: false
  },
  isShowText: {
    type: Boolean,
    default: false
  },
  showToolTotal: {
    type: Boolean,
    default: false
  }
})

const chart = ref()
const container = ref()
const showChart = ref(true)

onMounted(() => {
  setTimeout(() => {
    newChartBox()
  }, 100);
})
const newChartBox = () => {
  const clientWidth = document.documentElement.clientWidth
  const domWidth = container.value.clientWidth

  chart.value = new F2.Chart({
    id: props.chartId,
    width: domWidth || clientWidth,
    height: props.height,
    // padding: [10, 20, 20, 10],
    appendPadding: [10, 25, 10, 10],
    pixelRatio: window.devicePixelRatio,
  });
}

/**
 * @description: 柱状图
 * @param {*} data 数据
 * @return {*}
 */
const initChartTimeout = (data: any) => {
  if (data.length > 0) {
    showChart.value = true
    let ipX: any = {}
    // let nameList: any = {}

    if (chart.value) {
      chart.value.clear(); // 清理所有
    }
    chart.value.tooltip(false);
    chart.value.legend({
      position: props.legendPosition,
      align: 'center',
    })

    if (props.isScrollBar) {
      const originDates = data.map((item: any) => item[props.intervalPositionX]).slice(0, 4);
      ipX[props.intervalPositionX] = {
        tickCount: 4,
        values: originDates,
      }

      ipX[props.intervalPositionY] = {
        tickCount: 4
      }

      chart.value.source(data, ipX);
      chart.value.interval()
          .position(`${props.intervalPositionX}*${props.intervalPositionY}`)
          .color(props.colorArray)//分组时改变color属性
          .size(props.intervalSize); // 柱状宽度

      chart.value.interaction('pan');

      chart.value.scrollBar({
        mode: "x",
        xStyle: {
          offsetY: -5
        }
      });

      chart.value.axis(props.intervalPositionX, {//y轴配置
        label: (label: any) => {
          return {text:  label}
        }
      })
    } else {
      ipX[props.intervalPositionX] = {
        tickCount: 5,
      }

      let colorItem: any
      if ( props.group ) {
        colorItem = [props.color,props.colorArray]
      } else {
        colorItem = [props.colorArray]
      }

      chart.value.source(data,ipX);
      chart.value.interval()
          .position(`${props.intervalPositionX}*${props.intervalPositionY}`)
          .color(...colorItem)//分组时改变color属性
          .adjust({
            type: props.adjustType, // 分组 stack 堆叠
            marginRatio: 0.5 // 设置分组间柱子的间距
          })
          .size(props.intervalSize); // 柱状宽度
    }

    if ( props.isShowText) {
      data.forEach((obj: any) => {
        chart.value.guide().text({
          position: [obj[props.intervalPositionX], obj[props.intervalPositionY]],
          content: obj[props.intervalPositionY],
          style: {
            textAlign: 'center',
            fontSize: '10',
          },
          offsetY: -10,
          limitInPlot: true,
        });
      });
    }

    if (props.transposed) {
      chart.value.coord({
        transposed: true
      });

      chart.value.guide().text({
        top: true, // 是否绘制在 canvas 最上层,默认为 false
        position: [0, 0], // ['min', 'max']、文本的起始位置,值为原始数据值,支持 callback
        content: props.unit || '',
        style: {
          // fill: '#000', // 文本颜色
          fontSize: '8', // 文本大小
        },
        offsetX: -25, // x 方向的偏移量 -15
        offsetY: 26, // y 方向偏移量 -20
      });

    } else {
      chart.value.guide().text({
        top: true, // 是否绘制在 canvas 最上层,默认为 false
        position: ['min', 'max'], // 文本的起始位置,值为原始数据值,支持 callback
        content: props.unit || '',
        style: {
          // fill: '#000', // 文本颜色
          fontSize: '10', // 文本大小
        },
        offsetX: -15, // x 方向的偏移量 -15
        offsetY: -10, // y 方向偏移量 -20
      });
    }

    chart.value.tooltip({
      layout: 'vertical',
      offsetY: props.transposed ? 0 : 110,
      background: {
        radius: 6,
        fill: '#1890FF',
      },
      nameStyle: {
        fontSize: 10,
      },
      valueStyle: {
        fontSize: 10,
      },
      onShow: function onShow(ev: any) {
        const items = ev.items;
        items.unshift({
          name: items[0].title,
          x: items[0].x,
          y: items[0].y,
        })
      },
      // onChange(obj: any) {
      //   obj.items
        // if ( props.showToolTotal ) {
        //   obj.items.unshift({
        //       name: '',
        //       value: '222'
        //     });
        // } else {
        //  obj.items
        // }
      // }
    })


    render()
  } else {
    showChart.value = false
  }

}

const initChart = (data: any) => {
  setTimeout(() => {
    initChartTimeout(data)
  }, 100);
}

const render = () => {
  chart.value.render();
}

defineExpose({initChart, chart, render})

</script>
引用
滚动
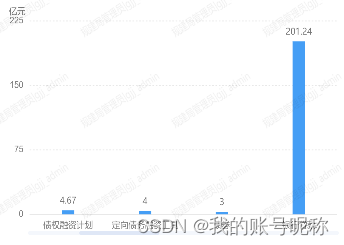
  <InitBarChart ref="financingWayChart" chartId="financingWayChart" intervalPositionX="name"
                intervalPositionY="value" :colorArray="['#459EF5FF']" :group="false" :height="260" unit="万元" :isShowText="true"
                :isScrollBar="true" />
const queryChart = (originalData: any) => {
let chartData: any = []
originalData.forEach((item: any) => {
chartData.push({
value: Number(item.indexValue),
name: item.itemName,
const: 'const',
})
})
debtChart.value.initChart(chartData, labelNumber.value)
}对比
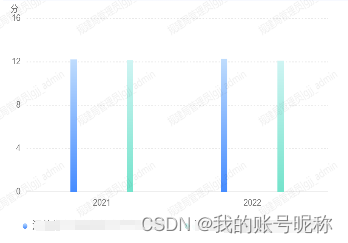
<InitBarChart ref="otherChart" chartId="otherChart"
                      intervalPositionX="sdate"
                      intervalPositionY="payAmt"
                      unit="分"
                      color="itemName"
                      :colorArray="['l(90) 0:#BFDCFDFF 1:#458BFFFF','l(90) 0:#CFF4F3FF 1:#73E3CBFF']"
                      :intervalSize="8"
                      :height="260"
        />
堆叠对比
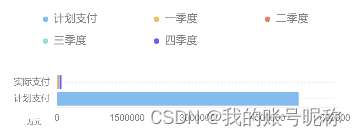
    <InitBarChart
                  ref="jdzfChart" chartId="jdzfChart"
                  intervalPositionX="payType"
                  intervalPositionY="payAmt"
                  :height="150"
                  unit="单位:万元"
                  legendPosition="top"
                  color="itemName"
                  adjustType="stack"
                  :transposed="true"
                  :colorArray="['#7357F6FF', '#459EF5FF', '#78D86CFF', '#97DFD8FF', '#F0BD58FF',]"
    />
if (res.data) {
res.data.forEach((item: any) => {
chartData.push({
itemName: item.itemName.includes('完成投资') ? item.date : '计划支付',
payAmt: item.payAmt,
payType: item.itemName.includes('完成投资') ? '实际支付' : '计划支付',、
})
})
}


 794
794


 被折叠的 条评论
为什么被折叠?
被折叠的 条评论
为什么被折叠?
 到【灌水乐园】发言


