


先说一下这次对ECharts二次封装总结的一些东西吧,感觉这是重点!
二次封装及使用的矛盾痛点:
- 一般封装只会暴露出一些常用的属性,最常见的如图表的颜色、数据;
- 封装人员也不会考虑把所有情况都封装起来,因为这样没有意义,如图表上的文字大小。如果考虑的面面具到,那不如不封装,直接用Echarts的属性得了;
- 但使用过程中,除了颜色数据有不同的需求外,确实会根据实际情况和设计稿做出调整,如图表的具体位置,图例的位置,文字的样式等等
解决思路及办法:
这里以图表的位置举例,在Echarts中的属性为gird
1、我们在封装过程中,对grid设置一个默认的值,如:
let gridDefault: EChartOption.Grid = {
	left: 88,
	right: 196,
	bottom: 50,
	top: 110,
};
2、同时暴露出一个grid属性,该属性继承Echarts的grid属性
const Component = ({gird}:{grid?: EChartOption.Grid;})=>{
	return ()
}
3、合并属性
使用时若没有传递grid参数,则使用默认值,若有,则使用传递过来的值进行替换。
但
简单的属性还好,可以直接覆盖进行替换,如gird的left、right等。可以使用Object的assign属性进行替换。
但Echarts的属性往往是很深的一些属性,使用时传参如果没写的很深很全,使用Object.assign()就会导致很深的默认属性被毙掉
既然二次开发组件,使用人员肯定也不想每个属性我都要在传一遍,我只传我需要改变默认的值即可,要不然就和重写一个Echarts没区别了
针对这种情况,找到了loadsh的一个merge方法,他不像assign一样,相同属性就替换掉,不会管你这个属性的值相同还是不相同,merge他会递归遍历对象的每个层级,相同的属性会覆盖,不同的就会合并
通过这种方法,在封装组件时对抛出的继承自Echarts的属性,和组件的默认属性进行一次merge。得到合并后的全新的值即可。grid = merge(gridDefault, grid);
结论:
若要实现更高的组件自由度,则更多的抛出继承Echarts的属性,在代码中merge默认值即可。这样开发人员使用时也不用考虑组件都需要什么属性,只需要考虑自己需要什么属性
说了这么多废话,开始贴代码了⬇️⬇️⬇️
先说说这次二次封装暴露出的功能
- 柱状图负值可以自定义颜色
- 多柱子多折线设置
- 三个好看立体柱子
- 折线的symbol
- MarkLine标记线是柱子的还是折线的
- MarkPoint标记点展示最大最小值
示例图
上代码
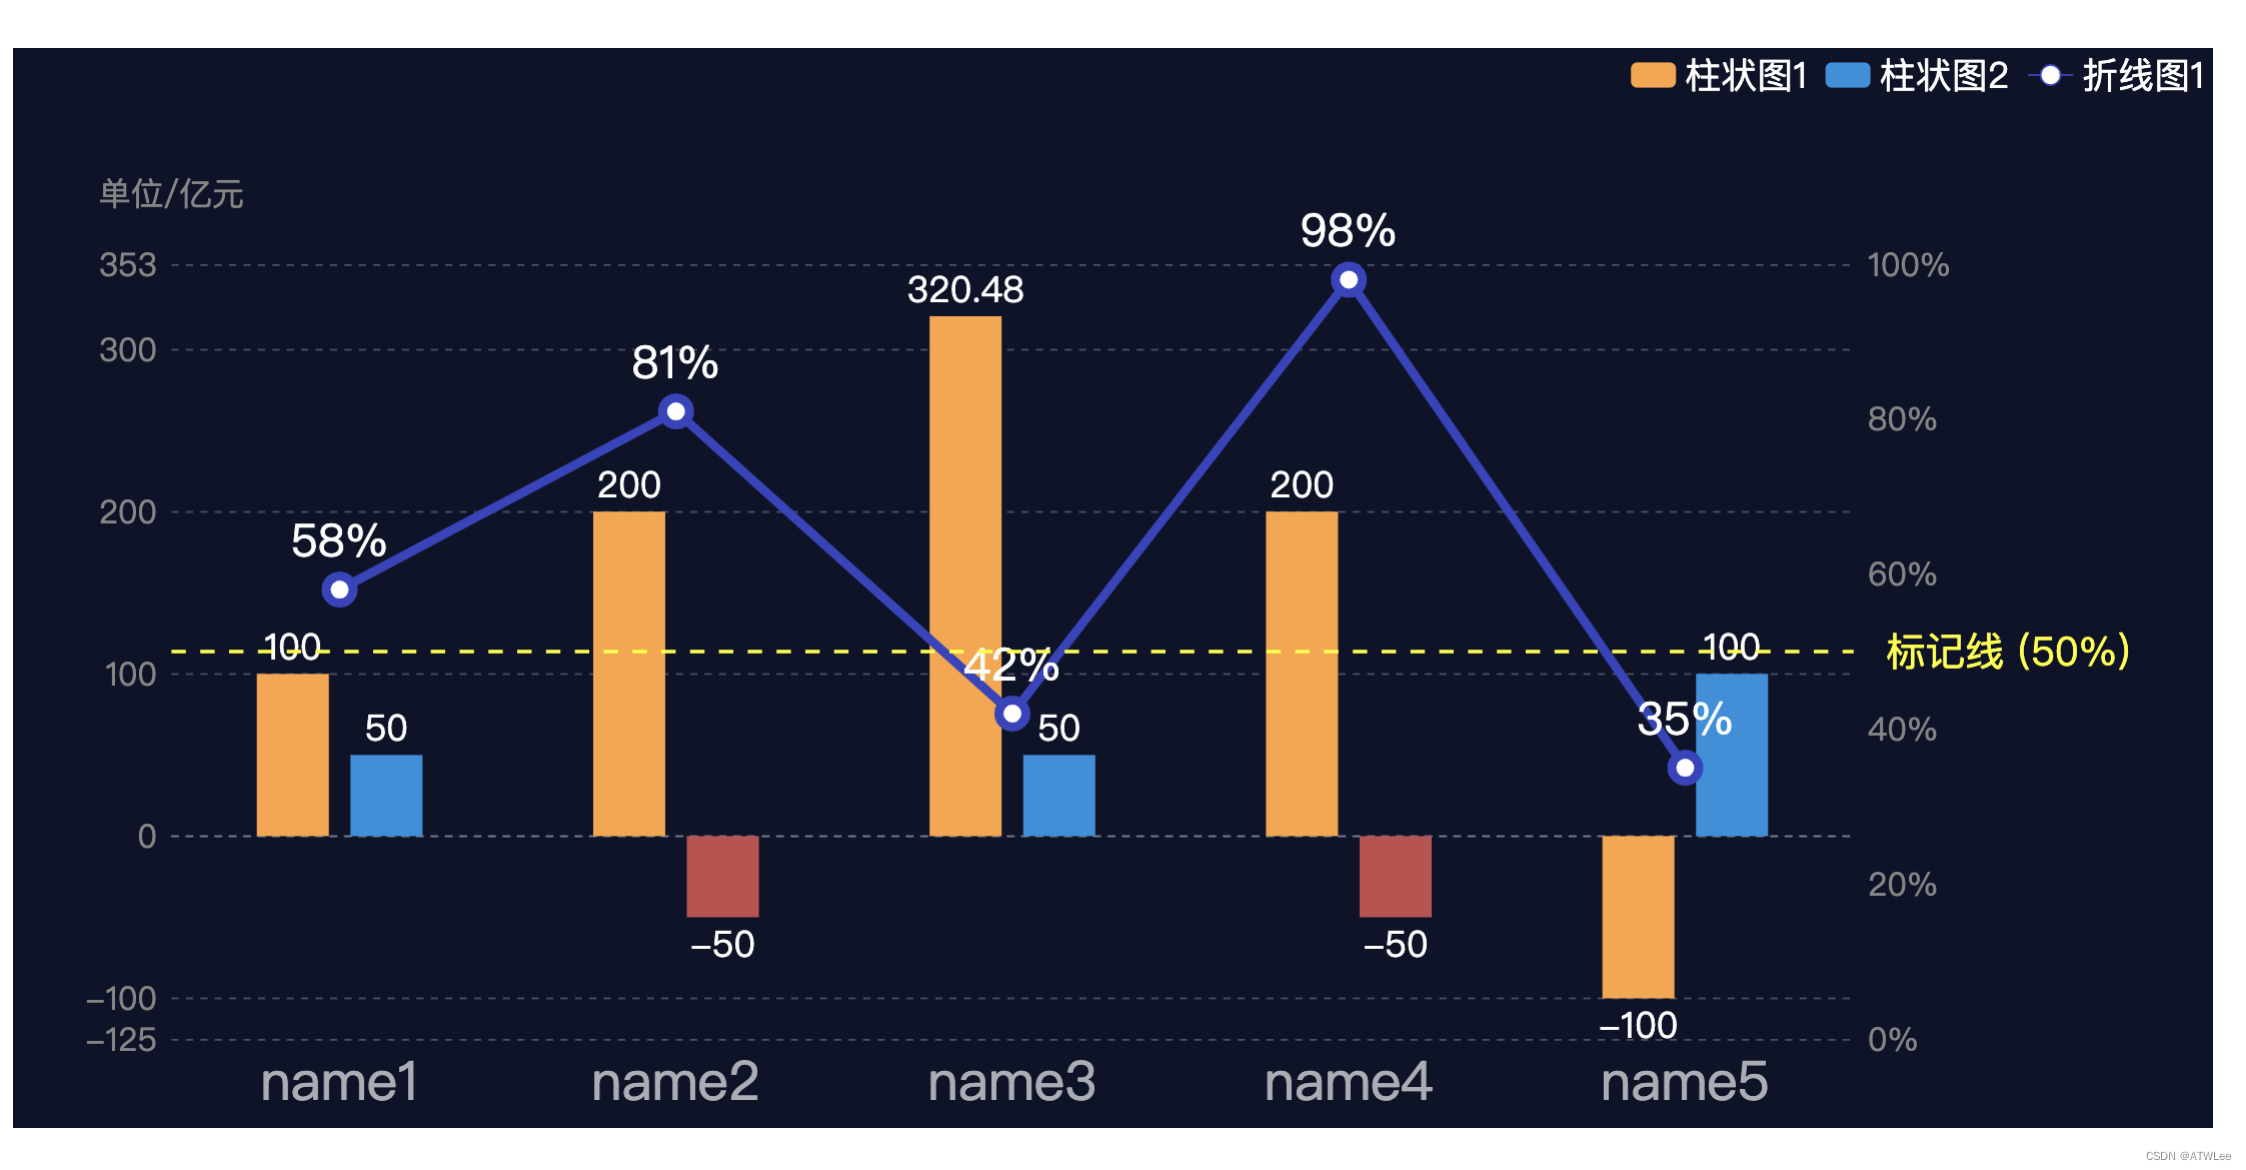
第一个(参数都有写,见封装的类型属性说明)
使用
import React from "react";
import { MultiBarAndLineCharts } from "封装的组件路径";

const Index: React.FC<{}> = () => {
  let xAxisData = ["name1", "name2", "name3", "name4", "name5"];
  let barDataS = [
    [100, 200, 320.48, 200, -100],
    [50, -50, 50, -50, 100],
  ];
  let lineDataS = [[58, 81, 42, 98, 35]];
  let nameS = ["柱状图1", "柱状图2", "折线图1"];
  let yAxisNames = ["单位/亿元", ""];
  let color = ["rgb(254,163,61)", "rgb(17,145,222)", "rgb(54,68,192)"];
  let barNegativeNumberColor = ["rgb(254,163,61)", "rgb(196,76,78)"];
  return (
    <div
      style={{ width: "100%", height: "600px", background: "rgba(13,19,41)" }}
    >
      <MultiBarAndLineCharts
        xAxisData={xAxisData}
        barDataS={barDataS}
        lineDataS={lineDataS}
        nameS={nameS}
        color={color}
        barWidth={40}
        barNegativeNumberColor={barNegativeNumberColor}
        yAxisNames={yAxisNames}
      />
    </div>
  );
};
export default Index;
封装
import React from "react";
import ReactEcharts from "echarts-for-react";
import { EChartOption } from "echarts";
import { merge } from "lodash";

const MultiBarAndLineCharts = ({
  grid,
  legend,
  tooltip,
  xAxis,
  yAxisNames = ["", ""],
  yAxis,
  xAxisData,
  barDataS,
  lineDataS,
  nameS,
  lineSymbol,
  barWidth = "auto",
  barNegativeNumberColor,
  borderWidth = 5,
  color,
  showLabel = [true, true],
  barLabel,
  lineLabel,
  customMarkLine = {
    show: true,
    type: "line",
    title: "标记线",
    width: 2,
    color: "yellow",
    value: 50,
  },
  markLine,
  smooth = false,
}: {
  /**
   * @description 直角坐标系内绘图网格,继承EChart.Grid
   */
  grid?: EChartOption.Grid;
  /**
   * @description 图例组件,继承EChart.Legend
   */
  legend?: EChartOption.Legend;
  /**
   * @description 提示框组件,继承EChart.Tooltip
   */
  tooltip?: EChartOption.Tooltip;
  /**
   * @description 直角坐标系 grid 中的 x 轴,继承EChart.XAxis
   */
  xAxis?: EChartOption.XAxis;
  /**
   * @description 两个y轴的名字
   */
  yAxisNames?: string[];
  /**
   * @description 直角坐标系 grid 中的 y 轴,继承EChart.YAxis。
   */
  yAxis?: EChartOption.YAxis[];
  /**
   * @description x轴数据
   */
  xAxisData: string[];
  /**
   * @description 柱状图数据,二维数组,每个item是一组柱状图数据
   */
  barDataS: number[][];
  /**
   * @description 折线图数据,二维数组,每个item是一组折线图数据
   */
  lineDataS: number[][];
  /**
   * @description 柱状图和折线图的名字,这个参数是为了和legend对应起来
   */
  nameS: string[];
  /**
   * @description 折线图的Symbol,需要是图片时使用,url为图片地址、size为大小
   */
  lineSymbol?: { url: string; size: number }[];
  /**
   * @description 柱状图每个柱子宽度
   */
  barWidth?: number | string;
  /**
   * @description 当柱状图有负数,且需要单独设置颜色时使用。注意:若要使用,则每个柱子都要设置,即该属性长度等于barDataS属性长度
   */
  barNegativeNumberColor?: string[];
  /**
   * @description 折线图item点的边框宽度
   */
  borderWidth?: number;
  /**
   * @description 该图表的系列颜色
   */
  color: string[];
  /**
   * @description 是否显示Label,是个数组,第一个参数控制柱状图label,第二个控制折线图label
   */
  showLabel?: boolean[];
  /**
   * @description 柱状图label,继承EChart.SeriesBar的Label,若有额外需求,参考EChart文档进行设置。因为没有对应的EChart的Label类型,所以给个any,自定义的时候要参考文档哦
   */
  barLabel?: any;
  /**
   * @description 折线图label,继承EChart.SeriesLine的Label,若有额外需求,参考EChart文档进行设置。因为没有对应的EChart的Label类型,所以给个any,自定义的时候要参考文档哦
   */
  lineLabel?: any;
  /**
   * @description 自定义MarkLine样式,包括:是否显示、属于bar还是line、文本、宽度、颜色、值
   */
  customMarkLine?: {
    show: boolean;
    type: "bar" | "line";
    title: string;
    width: number;
    color: string;
    value: number;
  };
  /**
   * @description MarkLine,因为没有对应的EChart的MarkLine类型,所以给个any,自定义的时候要参考文档哦
   */
  markLine?: any;
  /**
   * @description 折线图是否是平滑曲线
   */
  smooth?: boolean;
}) => {
  let allSeries: EChartOption.Series[] = [];
  // 各种参数判断,有问题缺失抛出错误信息
  (function logErr() {
    // 判断参数必填项
    if (!(xAxisData && barDataS && lineDataS && nameS && color))
      throw new SyntaxError("缺少必填的参数");
    // 判断每个系列的bar是不是都传进来一个负值的颜色,如果不是,抛出个错误
    if (
      barNegativeNumberColor &&
      barNegativeNumberColor.length !== barDataS.length
    )
      throw new SyntaxError(
        "barNegativeNumberColor属性的长度必须和barDataS的长度一致"
      );
    // 如果color长度不等于bar和line的长度和,抛出个警告
    if (color.length !== barDataS.length + lineDataS.length)
      console.warn("属性color的长度建议等于bar+line的长度");
    // name和数据的长度得一样,要不然没legend
    if (nameS.length !== barDataS.length + lineDataS.length)
      console.warn("属性nameS长度需要等于bar+line的长度");
  })();

  // merge默认参数和传递的参数
  (function mergeParams() {
    let gridDefault: EChartOption.Grid = {
      left: 88,
      right: 200,
      bottom: 50,
      top: 120,
    };
    let legendDefault: EChartOption.Legend = {
      show: true,
      textStyle: {
        color: "rgba(255, 255, 255, 1)",
        fontSize: 20,
        fontFamily: "pingFangMedium",
      },
      right: 0,
    };
    let tooltipDefault: EChartOption.Tooltip = {
      show: true,
      trigger: "axis",
    };
    let xAxisDefault: EChartOption.XAxis = {
      show: true,
      type: "category",
      axisLabel: {
        fontSize: 30,
        color: "rgba(255, 255, 255, 0.65)",
        fontFamily: "pingFangMedium",
        padding: 0,
        interval: 0,
      },
      axisLine: {
        show: true,
        lineStyle: {
          type: "dashed",
          color: "rgba(208, 225, 245, 0.3)",
        },
      },
      axisTick: {
        show: false,
      },
    };
    let yAxisDefault: EChartOption.YAxis[] = [
      {
        show: true,
        type: "value",
        splitNumber: 5,
        name: yAxisNames[0],
        nameTextStyle: {
          color: "rgba(133, 133, 133, 1)",
          fontSize: 18,
          fontFamily: "pingFangMedium",
          padding: [0, 0, 15, 0],
        },
        axisLabel: {
          show: true,
          fontSize: 18,
          color: "rgba(133, 133, 133, 1)",
          formatter: (value: any) => {
            return Math.ceil(value).toLocaleString("en-us");
          },
        },
        axisLine: {
          show: false,
        },
        splitLine: {
          lineStyle: {
            type: "dashed",
            color: "rgba(208, 225, 245, 0.3)",
          },
        },
        axisTick: {
          show: false,
        },
        max: (value: any) => {
          return value.max + value.max / 10;
        },
        min: (value: any) => {
          if (value.min < 0) return value.min + value.min / 4;
          else return 0;
        },
      },
      {
        type: "value",
        name: yAxisNames[1],
        show: true,
        splitLine: { show: false },
        axisLine: { show: false },
        axisTick: { show: false },
        axisLabel: {
          show: true,
          fontSize: 18,
          color: "rgba(133, 133, 133, 1)",
          formatter: (params: any) => {
            return `${params}%`;
          },
        },
      },
    ];
    let barLabelDefault = {
      show: showLabel[0],
      color: "rgba(255, 255, 255, 1)",
      fontSize: 20,
      position: "top",
    };
    let lineLabelDefault = {
      show: showLabel[1],
      color: "rgba(255, 255, 255, 1)",
      fontSize: 25,
      formatter: function (params: any) {
        return params.value + "%";
      },
    };
    let markLineDefault = {
      symbol: ["none", "none"],
      silent: true,
      lineStyle: {
        type: "dashed",
        width: customMarkLine.width,
        color: customMarkLine.color,
      },
      label: {
        show: true,
        fontSize: 22,
        position: "right",
        padding: [0, 0, 0, 18],
        formatter: function (params: any) {
          return `${customMarkLine.title} (${params.value}${
            customMarkLine.type === "line" ? "%" : ""
          })`;
        },
      },
      data: [
        {
          yAxis: customMarkLine.value,
        },
      ],
    };
    grid = merge(gridDefault, grid);
    tooltip = merge(tooltipDefault, tooltip);
    legend = merge(legendDefault, legend);
    xAxis = merge(xAxisDefault, xAxis);
    yAxis = merge(yAxisDefault, yAxis);
    barLabel = merge(barLabelDefault, barLabel);
    lineLabel = merge(lineLabelDefault, lineLabel);
    markLine = merge(markLineDefault, markLine);
  })();

  // 柱状图基本配置
  let barSeriesBasicConfig: EChartOption.SeriesBar = {
    type: "bar",
    barWidth: barWidth,
    label: barLabel,
  };
  // 折线图图基本配置
  let lineSeriesBasicConfig: EChartOption.SeriesLine = {
    type: "line",
    yAxisIndex: 1,
    lineStyle: {
      width: 5,
    },
    symbolSize: 15,
    label: lineLabel,
    smooth,
  };

  // 处理柱状图数据
  barDataS.forEach((item, index) => {
    let data: {
      value: number;
      itemStyle?: { color: string };
      label?: { position: string };
    }[] = [];
    // 添加颜色
    item.forEach((i) => {
      data.push({
        value: i,
        itemStyle: {
          color:
            barNegativeNumberColor && i < 0
              ? barNegativeNumberColor[index]
              : color[index],
        },
        label: {
          position: i < 0 ? "bottom" : "top",
        },
      });
    });
    allSeries.push({
      ...barSeriesBasicConfig,
      data,
      name: nameS[index],
      markLine:
        customMarkLine.show && customMarkLine.type === "bar" ? markLine : "",
    });
  });
  // 处理折线图数据
  lineDataS.forEach((item, index) => {
    if (lineSymbol && lineSymbol.length - 1 >= index) {
      allSeries.push({
        ...lineSeriesBasicConfig,
        data: item,
        name: nameS[index + barDataS.length],
        itemStyle: {
          borderWidth,
        },
        symbol: lineSymbol[index].url,
        symbolSize: lineSymbol[index].size,
        markLine:
          customMarkLine.show && customMarkLine.type === "line" ? markLine : "",
      });
    } else {
      allSeries.push({
        ...lineSeriesBasicConfig,
        data: item,
        name: nameS[index + barDataS.length],
        itemStyle: {
          borderWidth,
        },
        markLine:
          customMarkLine.show && customMarkLine.type === "line" ? markLine : "",
      });
    }
  });

  const option: EChartOption = {
    grid,
    legend,
    tooltip,
    xAxis: {
      ...xAxis,
      data: xAxisData,
    },
    yAxis,
    series: allSeries,
    color,
  };

  return (
    <ReactEcharts
      option={option}
      style={{ height: "100%", width: "100%" }}
      notMerge={true}
    />
  );
};

export default MultiBarAndLineCharts;
FAQ
1、第二个y轴把百分号写死了,如果不想用百分比的折线图,自己改下代码加个属性控制一下即可,下边那个就抛出了,可以参考
2、负值的柱状图的label可能会与x轴重复,虽然动态设置了最小值,但不能保证完美解决
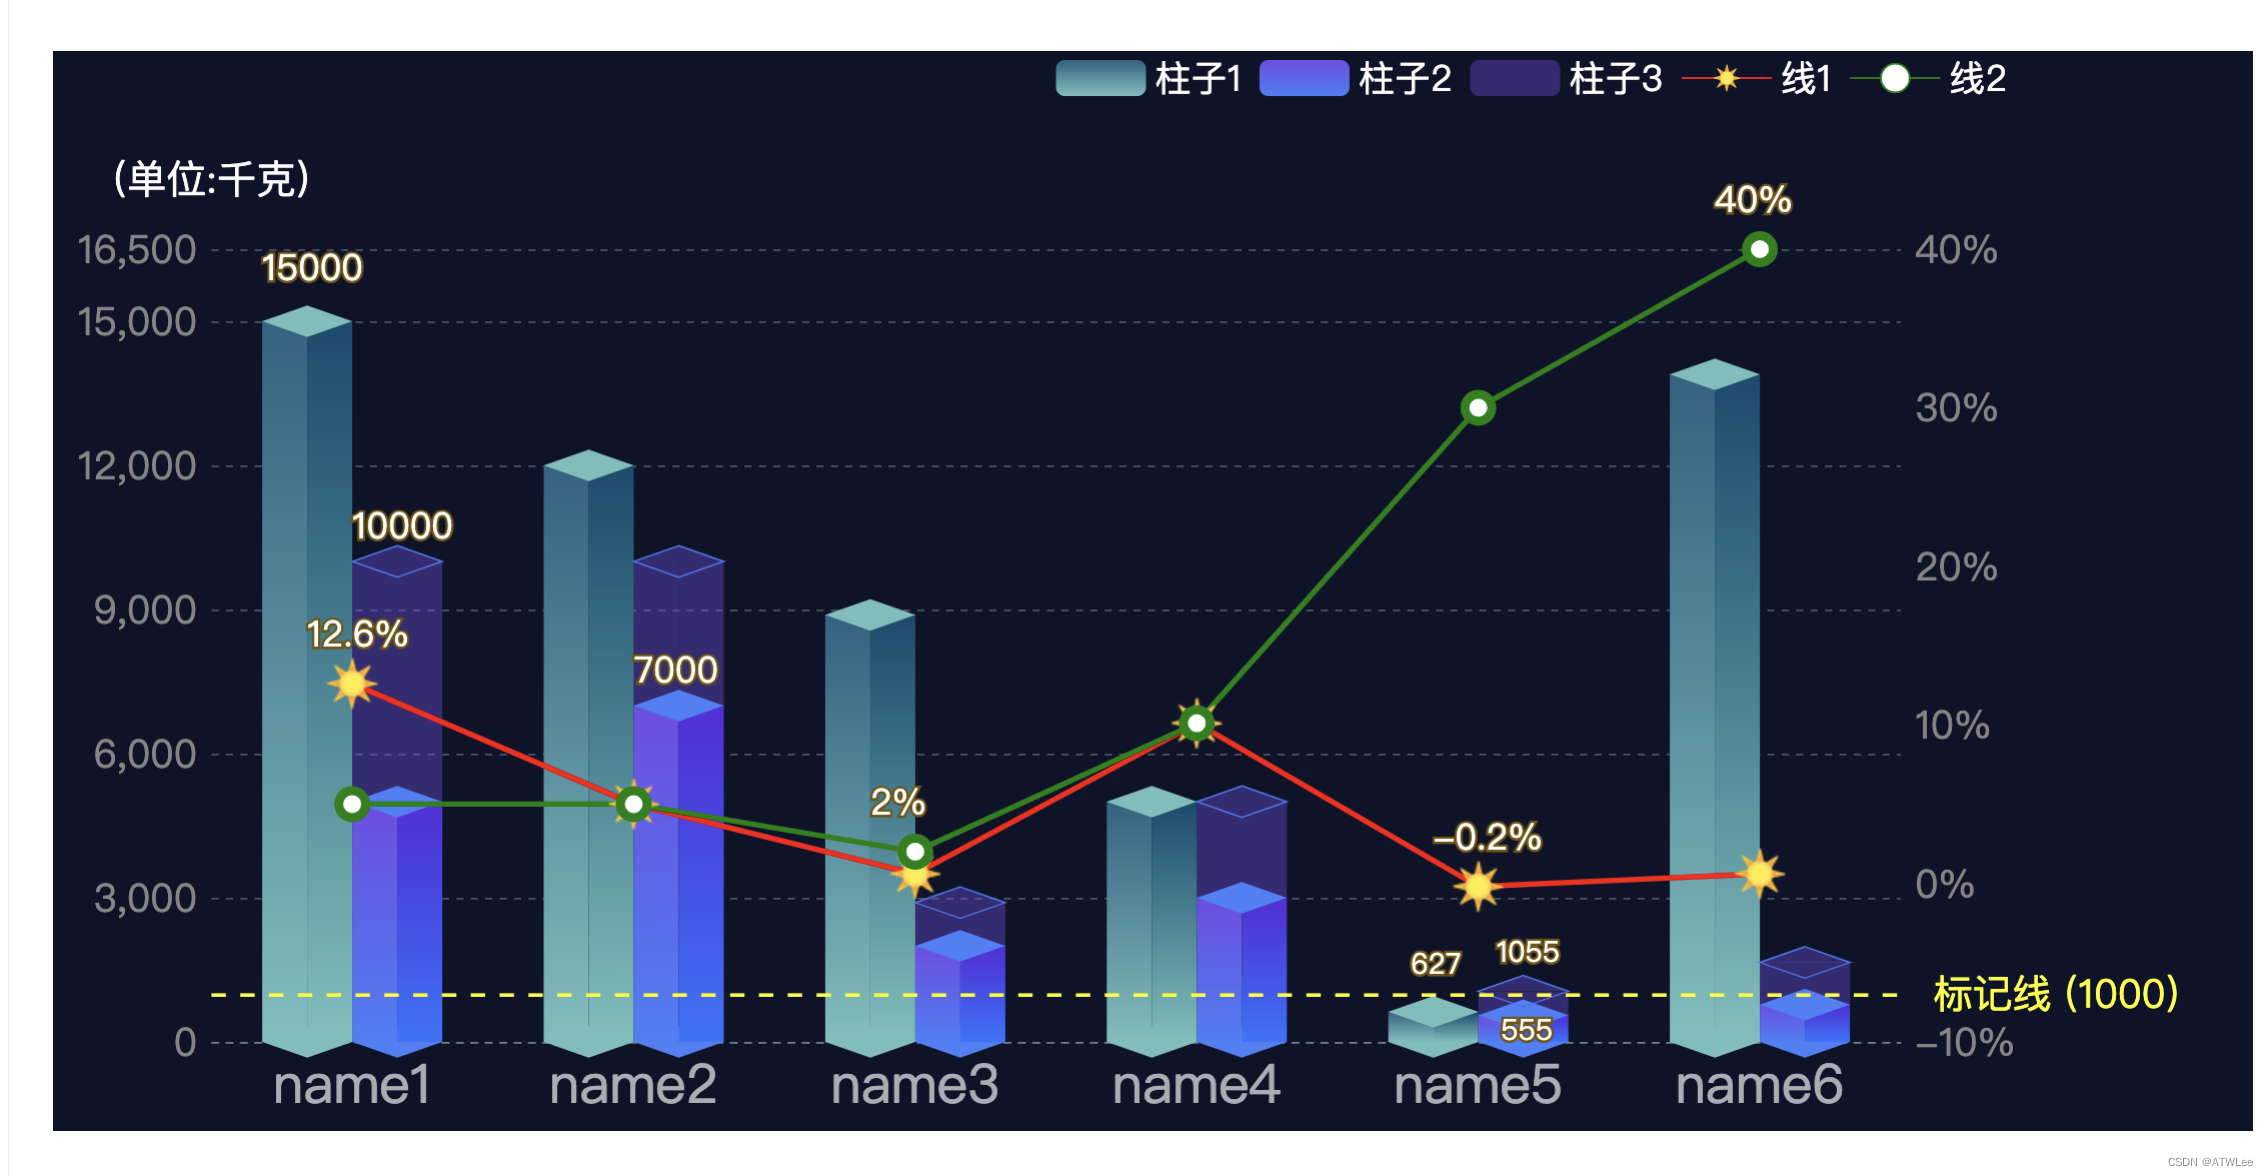
第二个(参数都有写,见封装的类型说明)
使用
import React from "react";
import { Three3dBarAndLineCharts } from "封装的组件路径";

const Index: React.FC<{}> = () => {
  let xAxisData = [
    "name1",
    "name2",
    "name3",
    "name4",
    "name5",
    "name6",
  ];
  let barDataS = [
    [15000, 12000, 8888, 5000, 627, 13895],
    [5000, 7000, 2000, 3000, 555, 777],
    [5000, 3000, 900, 2000, 500, 877],
  ];
  let lineDataS = [
    [12.6, 5.0, 0.6, 10.1, -0.2, 0.6],
    [5, 5.0, 2, 10.1, 30, 40],
  ];
  let nameS = [
    "柱子1",
    "柱子2",
    "柱子3",
    "线1",
    "线2",
  ];
  let yAxisNames = ["(单位:千克)", ""];
  let symbolSun ="data:image/png;base64,iVBORw0KGgoAAAANSUhEUgAAACAAAAAgCAYAAABzenr0AAAAAXNSR0IArs4c6QAAAAlwSFlzAAALEwAACxMBAJqcGAAAAVlpVFh0WE1MOmNvbS5hZG9iZS54bXAAAAAAADx4OnhtcG1ldGEgeG1sbnM6eD0iYWRvYmU6bnM6bWV0YS8iIHg6eG1wdGs9IlhNUCBDb3JlIDUuNC4wIj4KICAgPHJkZjpSREYgeG1sbnM6cmRmPSJodHRwOi8vd3d3LnczLm9yZy8xOTk5LzAyLzIyLXJkZi1zeW50YXgtbnMjIj4KICAgICAgPHJkZjpEZXNjcmlwdGlvbiByZGY6YWJvdXQ9IiIKICAgICAgICAgICAgeG1sbnM6dGlmZj0iaHR0cDovL25zLmFkb2JlLmNvbS90aWZmLzEuMC8iPgogICAgICAgICA8dGlmZjpPcmllbnRhdGlvbj4xPC90aWZmOk9yaWVudGF0aW9uPgogICAgICA8L3JkZjpEZXNjcmlwdGlvbj4KICAgPC9yZGY6UkRGPgo8L3g6eG1wbWV0YT4KTMInWQAABwNJREFUWAmtV1tsFFUY/s6Z2d22zLYlZakUCRVaQcqlWIiCiS1gTEB9UAO+GR9En3iQGI0xJiSiRB98MjEq8cEQTSBeHhQM0V7whtEGDWC90BYitxahtNtu25058/v/ZzvLbilawJNM5+yZ89+//1LgJhYRNLW1uDfBAvpGiIk2O5auvfFxqIH3ZJ8/u06GN6Z9+wVl5SjcD1IbZa/UPkPyYl2uR4dreoD2bnbYxTlBBRytkHXtAREphP5KuH4lddx9h70yxX05t7yYXwGb6W8nx1jibpl2rFlGBxcG9M18okOrn7Bnk/BAO/4bI0UeEE1zjBp3UmvjOxJXJdaKN/ZiIu4tOZrAb4aTdZAZArKmWeiiJZ6jt5tiagdCS9+6cgO1Ne6Mvhe+ixTIfyDVhipnK9p+P0Edqx9RW/YZtQVGmOLChRxNNlyPsTEgPQKMB3dbEHa0h1awYmQ83enTd2vmUtvKd1Glv2RkzBb+kZGRrKtjzG60Wguhd/lJZBingbcfWWe72vjT75bJDrhYtvA0hrurETDr5HyF2Knb1MM4ab//xIoOqueA0edRnkkinTyJdYvqLFDZO4zUPFCvVoDjJq4T7TE61IWh4x5KqxX5KVKkX8WZ/t2ov2cb3MHt4dhIyOxIJxJOOF6xRx/99BksXLoecWcXytILMNBDqKpnGZWPquYfPxY8iXGR9fK+SgFrgcRPXPjVqhehL+3EmZ5RGJQi1QBU8TPThQnOQzm+5UXGIcetUeEAfP13VwzpI+w1jGJWdSliNfvVhiMPiOsllJag4M/UGHiqM6dlBb2OTLKHHV6KkvogrJ4XhBWniWK/Gp1MQyf93FOeUXKmKk/FzJxbQtKLjFXYT4USupy8fQVir2ynVEBiZMG0qtOHMS/AW4Gwrk7BG3C1F0B5nqNKE0CME4MfVRLPnXkBKe+ipvoFhNQywOhdghvLi0F8ReyVXV4BKTBRbbe5f64zR/DHsdZw1hJfeWlHl/GNRJzDxrd5m192z78TMaVnKELZoINZS4BzQ7vtnZljSnha/pPCbkuxzXcupYwI5tIeCpGc0Yp9tWHZQy/rmYhRfNgg4bHJBYLzGkxsRJF4XKlE2jBOHNSv3kY7Tj6vthzPFl61BrYwqFlmEQhtSVXmLiksxLmtRgYXI1ULU61JJ4eVKmG3/5sCVgpbMT6OMJ2E08/29Xf3w6v4FnHdCjfWgXu/O8Z5mLdCkeRs2khHe1DqOtQwbHWTAnM5S2HNmhALYo5KjkPFrMMKjZl6HxhWIAb0BqE+/73GrBRQUsKYiBu4JX8ycI6wtw+i5ef3NZpsrKVSHYCP37jwGDgeE1SA0S/xtl5SU2fs1ApEp0qTLVRjgyycDSsLHMSwmFltZMStR3uLLg6BdLhDa5dC6ryU2pHBe1BVO9tUcwfitJt2CLJZUHoG6T7Op75u0IyK31TCPcwFqgPk/KCaD3dFOuZBCO7xvCT/j048b3I3c7F2+WuOW7qdgkucFYlcQ4qop3yzTX7WaKfOCccye3Ts1Etq0+a/BHCF1yPgF3tAUkR6OrtGmo6gl94qqcXKh3rDyrOkPa58URoWcov2Mo6M+0QjrqKB+b7++oMa9Sz+ZkM0mie6aAtnGUvhmxaI+TogPOSQedgWioGSHFLn3v4kLh4HRspNmOGv41k+55siLFp2z6xYeJjhljFcbmxJlr4ga06TbevSByz/glQq4BJx46/c+237PbBqEYKxX3HpmKZEnQnr65X20hqJYaNcLoFOLiJk2LuBbyg7Q0OEn+hm0P3honxFD6rdxYorKpeIoi4YSSvyQHQIbM5t4+YNxLj/OxhVOOE4585qGpjnq+wSx6Q9CtNxTjd5klB+g6Mv36r0+b9cZFi44WYkHdG2ZWb3TtOUOXyVAlKlpGvJIAJ3eBMyfYS5C0qRZGtC85j+4sOasDe9xznPYezhhO/2Q6eP2fSOvYHOjtuQ1a9Q1VKynVDaMc8E0tptdxUsTFpFIYjcZKcbnoaQTNdiqCwNlL4G7oziSqGnT1ALf34vhk4R5zU3qYV9ONp9K88RtouShE68JwaU8dFw5W617shWa9ykeaBIn2hcsvPgL00k45QdTCZuSVcTRNs+8fnyLvooQfR5iujAnR9bxfY2xOVOxFS8SK3Le0l48VyYu1M8HRe5JD8wKPTjYnifaK3Wfn/GChYQ8ZAi6WRzWgqLV5YrsVLnZaVSoXU1g9gOIDwFySiGi+Zdrnzr7J3r+SMuszlcQCRn8lNGcTuSy2jOI7o9mxjZo+vR3ej3tN+ifRSOyUTS0+VMOid93cCubeiy/6TImS0QxRSCq2vxKr45zV+FQnjWH6D2xg+E9EatLcLAdHTgtGGD80D6jM0+aOl4wJgO/f96R2aJKCQ3yvgftRhdFMOpd6oAAAAASUVORK5CYII=";
  let lineSymbol = [{ url: `image://${symbolSun}`, size: 30 }];
  let colors = {
    barA: {
      leftColor: ["rgba(33, 99, 131, 1)", "rgba(113, 191, 188, 1)"],
      rightColor: ["rgba(0, 75, 111, 1)", "rgba(113, 191, 188, 1)"],
    },
    barB: {
      leftColor: ["rgba(114, 77, 230, 1)", "rgba(68, 128, 248, 1)"],
      rightColor: ["rgba(87, 45, 219, 1)", "rgba(47, 116, 254, 1)"],
    },
    barC: {
      leftColor: ["rgba(114, 77, 230, 0.4)", "rgba(114, 77, 230, 0.4)"],
      rightColor: ["rgba(114, 77, 230, 0.4)", "rgba(114, 77, 230, 0.4)"],
      topBorderColor: "rgba(67, 119, 235, 1)",
    },
    lines: ["red", "green"],
  };
   return (
    <div
      style={{ width: "100%", height: "600px", background: "rgba(13,19,41)" }}
    >
      <Three3dBarAndLineCharts
        xAxisData={xAxisData}
        barDataS={barDataS}
        lineDataS={lineDataS}
        nameS={nameS}
        barWidth={25}
        yAxisNames={yAxisNames}
        lineSymbol={lineSymbol}
        colors={colors}
      />
    </div>
  );
};
export default Index;
封装
import React from "react";
import ReactEcharts from "echarts-for-react";
import { EChartOption } from "echarts";
import { merge } from "lodash";
const Three3dBarAndLineCharts = ({
grid,
legend,
xAxis,
yAxisNames = ["", ""],
yAxis,
xAxisData,
barDataS,
lineDataS,
nameS,
showLabel = [true, false, true],
lineLabel,
lineSymbol,
barWidth = 23,
borderWidth = 5,
lineWidth = 3,
customMarkLine = {
show: true,
type: "bar",
title: "标记线",
width: 2,
color: "yellow",
value: 1000,
},
markLine,
smooth = false,
colors,
lineType = true,
}: {
/**
* @description 直角坐标系内绘图网格,继承EChart.Grid
*/
grid?: EChartOption.Grid;
/**
* @description 图例组件,继承EChart.Legend。注意注意,因为柱子很多,不能关掉。所以selectedMode别传true
*/
legend?: EChartOption.Legend;
/**
* @description 直角坐标系 grid 中的 x 轴,继承EChart.XAxis
*/
xAxis?: EChartOption.XAxis;
/**
* @description 两个y轴的名字
*/
yAxisNames?: string[];
/**
* @description 直角坐标系 grid 中的 y 轴,继承EChart.YAxis。
*/
yAxis?: EChartOption.YAxis[];
/**
* @description x轴数据
*/
xAxisData: string[];
/**
* @description 柱状图数据,二维数组,每个item是一组柱状图数据
*/
barDataS: number[][];
/**
* @description 折线图类型,true为百分比形式,false为数值
*/
lineType?: boolean;
/**
* @description 折线图数据,二维数组,每个item是一组折线图数据
*/
lineDataS: number[][];
/**
* @description 柱状图和折线图的名字,这个参数是为了和legend对应起来
*/
nameS: string[];
/**
* @description 展示的label形式,分别代表:bar的最大最小值、line的值、line的最大最小值
*/
showLabel?: boolean[];
/**
* @description 折线图label,继承EChart.SeriesLine的Label,若有额外需求,参考EChart文档进行设置。因为没有对应的EChart的Label类型,所以给个any,自定义的时候要参考文档哦
*/
lineLabel?: any;
/**
* @description 折线图的Symbol,需要是图片时使用,url为图片地址、size为大小
*/
lineSymbol?: { url: string; size: number }[];
/**
* @description 柱状图每个柱子宽度
*/
barWidth?: number;
/**
* @description 折线图item点的边框宽度
*/
borderWidth?: number;
/**
* @description 折线图线宽
*/
lineWidth?: number;
/**
* @description 自定义MarkLine样式,包括:是否显示、属于bar还是line、文本、宽度、颜色、值
*/
customMarkLine?: {
show: boolean;
type: "bar" | "line";
title: string;
width: number;
color: string;
value: number;
};
/**
* @description MarkLine
*/
markLine?: any;
/**
* @description 折线图是否是平滑曲线
*/
smooth?: boolean;
/**
* @description 三个柱状图的颜色,每个数组填两个,自上向下的渐变。c柱多了一个字符串是边框的颜色.lines是折线图颜色
*/
colors: {
barA: { leftColor: string[]; rightColor: string[] };
barB: { leftColor: string[]; rightColor: string[] };
barC: { leftColor: string[]; rightColor: string[]; topBorderColor: string };
lines: string[];
};
}) => {
// 各种参数判断,有问题缺失抛出错误信息
(function logErr() {
// 判断参数必填项
if (!(xAxisData && barDataS && lineDataS && nameS))
throw new SyntaxError("缺少必填的参数");
// name和数据的长度得一样,要不然没legend
if (nameS.length !== barDataS.length + lineDataS.length)
console.warn("属性nameS长度需要等于bar+line的长度");
})();
// merge默认参数和传递的参数
(function mergeParams() {
let gridDefault: EChartOption.Grid = {
left: 88,
right: 196,
bottom: 50,
top: 110,
};
let legendDefault: EChartOption.Legend = {
show: true,
right: 132,
selectedMode: false,
itemHeight: 20,
itemWidth: 50,
textStyle: {
color: "rgba(255, 255, 255, 1)",
fontSize: 20,
fontFamily: "pingFangMedium",
},
};
let xAxisDefault: EChartOption.XAxis = {
show: true,
type: "category",
axisLabel: {
color: "rgba(255, 255, 255, 0.65)",
fontSize: 30,
fontFamily: "pingFangMedium",
interval: 0,
},
axisLine: {
show: true,
lineStyle: {
type: "dashed",
color: "rgba(208, 225, 245, 0.3)",
},
},
axisTick: {
show: false,
},
};
let yAxisDefault: EChartOption.YAxis[] = [
{
show: true,
type: "value",
splitNumber: 5,
name: yAxisNames[0],
nameTextStyle: {
color: "rgba(255, 255, 255, 1)",
fontSize: 22,
lineHeight: 48,
},
axisLabel: {
color: "rgba(133, 133, 133, 1)",
fontSize: 21.6,
},
axisLine: {
show: false,
},
splitLine: {
show: true,
lineStyle: {
type: "dashed",
color: "rgba(208, 225, 245, 0.3)",
},
},
axisTick: {
show: false,
},
max: (value: any) => {
return value.max + value.max / 10;
},
min: (value: any) => {
if (value.min < 0) return value.min + value.min / 4;
else return 0;
},
},
{
type: "value",
name: yAxisNames[1],
show: true,
splitLine: { show: false },
axisLine: { show: false },
axisTick: { show: false },
axisLabel: {
show: true,
fontSize: 21.6,
color: "rgba(133, 133, 133, 1)",
formatter: (params: any) => {
return `${params}${lineType ? "%" : ""}`;
},
},
},
];
let markLineDefault = {
symbol: ["none", "none"],
silent: true,
lineStyle: {
type: "dashed",
width: customMarkLine.width,
color: customMarkLine.color,
},
label: {
show: true,
fontSize: 22,
position: "right",
padding: [0, 0, 0, 18],
formatter: function (params: any) {
return `${customMarkLine.title} (${params.value}${
customMarkLine.type === "line" ? "%" : ""
})`;
},
},
data: [
{
yAxis: customMarkLine.value,
},
],
};
let colorsDefault = {
barA: {
leftColor: ["rgba(33, 99, 131, 1)", "rgba(113, 191, 188, 1)"],
rightColor: ["rgba(0, 75, 111, 1)", "rgba(113, 191, 188, 1)"],
},
barB: {
leftColor: ["rgba(114, 77, 230, 1)", "rgba(68, 128, 248, 1)"],
rightColor: ["rgba(87, 45, 219, 1)", "rgba(47, 116, 254, 1)"],
},
barC: {
leftColor: ["rgba(114, 77, 230, 0.4)", "rgba(114, 77, 230, 0.4)"],
rightColor: ["rgba(114, 77, 230, 0.4)", "rgba(114, 77, 230, 0.4)"],
topBorderColor: "rgba(67, 119, 235, 1)",
},
};
let lineLabelDefault = {
show: showLabel[1],
color: "rgba(255, 255, 255, 1)",
fontSize: 25,
formatter: function (params: any) {
return params.value + `${lineType ? "%" : ""}`;
},
};
grid = merge(gridDefault, grid);
legend = merge(legendDefault, legend);
xAxis = merge(xAxisDefault, xAxis);
yAxis = merge(yAxisDefault, yAxis);
markLine = merge(markLineDefault, markLine);
colors = merge(colorsDefault, colors);
lineLabel = merge(lineLabelDefault, lineLabel);
})();
// 结构三个数组
let [incomeData, data2, data3] = barDataS;
// 计算堆叠的两个柱子的高度,C柱的markPoint要用
const sumData = (data2: number[], data3: number[]) => {
let arr: number[] = [];
data2.forEach((value: number, index: number) => {
arr[index] = value + data3[index];
});
return arr;
};
let dataSum = sumData(data2, data3);
// 折线图基本配置
// 折线图图基本配置
let lineSeriesBasicConfig: EChartOption.SeriesLine = {
type: "line",
yAxisIndex: 1,
label: lineLabel,
symbolSize: 15,
markPoint: {
symbol: "circle",
symbolSize: showLabel[2] ? 50 : 0,
itemStyle: {
color: "rgba(10, 18, 48, 0)",
},
data: [
{
type: "max",
name: "最大值",
label: {
show: true,
fontSize: 20,
color: "rgba(255, 255, 255, 1)",
position: ["0", "-25%"],
textBorderColor: "rgba(116, 83, 4, 1)",
textBorderWidth: 3,
formatter: function (params: any) {
return params.value + `${lineType ? "%" : ""}`;
},
},
},
{
type: "min",
name: "最小值",
label: {
show: true,
fontSize: 20,
color: "rgba(255, 255, 255, 1)",
position: ["0", "-25%"],
textBorderColor: "rgba(116, 83, 4, 1)",
textBorderWidth: 3,
formatter: function (params: any) {
return params.value + `${lineType ? "%" : ""}`;
},
},
},
] as any,
},
smooth,
z: 9,
};
// 处理折线图数据
let allSeriesLine: EChartOption.SeriesLine[] = [];
lineDataS.forEach((item, index) => {
if (lineSymbol && lineSymbol.length - 1 >= index) {
allSeriesLine.push({
...lineSeriesBasicConfig,
data: item,
name: nameS[index + barDataS.length],
itemStyle: {
borderWidth,
color: colors.lines[index],
},
lineStyle: {
width: lineWidth,
color: colors.lines[index],
},
symbol: lineSymbol[index].url,
symbolSize: lineSymbol[index].size,
markLine:
customMarkLine.show && customMarkLine.type === "line" ? markLine : "",
});
} else {
allSeriesLine.push({
...lineSeriesBasicConfig,
data: item,
name: nameS[index + barDataS.length],
itemStyle: {
borderWidth,
color: colors.lines[index],
},
lineStyle: {
width: lineWidth,
color: colors.lines[index],
},
markLine:
customMarkLine.show && customMarkLine.type === "line" ? markLine : "",
});
}
});
const option: EChartOption = {
grid,
legend,
xAxis: {
...xAxis,
data: xAxisData,
},
yAxis,
series: [
// barA
{
type: "bar",
name: nameS[0],
barWidth,
itemStyle: {
color: {
type: "linear",
global:false,
x: 0,
x2: 0,
y: 0,
y2: 1,
colorStops: [
{ offset: 0, color: colors.barA.leftColor[0] },
{ offset: 1, color: colors.barA.leftColor[1] },
],
},
},
data: incomeData,
z: 2,
},
{
type: "bar",
name: nameS[0],
barWidth,
itemStyle: {
color: {
type: "linear",
x: 0,
x2: 0,
y: 0,
y2: 1,
colorStops: [
{ offset: 0, color: colors.barA.rightColor[0] },
{ offset: 1, color: colors.barA.rightColor[1] },
],
} as EChartOption.Color,
},
data: incomeData,
z: 2,
},
{
type: "pictorialBar",
name: nameS[0],
symbol: "diamond",
symbolPosition: "end",
symbolOffset: ["-50%", "-50%"],
symbolSize: [barWidth * 2, barWidth * 0.7],
symbolRotate: 0,
itemStyle: {
color: colors.barA.leftColor[1],
},
markPoint: {
symbol: "circle",
symbolSize: showLabel[0] ? 50 : 0,
itemStyle: {
color: "rgba(10, 18, 48, 0)",
},
data: [
{
type: "max",
name: "最大值",
label: {
show: true,
fontSize: 20,
color: "rgba(255, 255, 255, 1)",
position: ["-50%", "-30%"],
textBorderColor: "rgba(116, 83, 4, 1)",
textBorderWidth: 3,
},
},
{
type: "min",
name: "最小值",
label: {
show: true,
fontSize: 16,
color: "rgba(255, 255, 255, 1)",
position: ["-25%", "-20%"],
textBorderColor: "rgba(116, 83, 4, 1)",
textBorderWidth: 3,
},
},
],
},
data: incomeData,
z: 3,
},
{
type: "pictorialBar",
name: nameS[0],
symbol: "diamond",
symbolPosition: "start",
symbolOffset: ["-50%", "50%"],
symbolSize: [barWidth * 2, barWidth * 0.7],
symbolRotate: 0,
itemStyle: {
color: colors.barA.leftColor[1],
},
data: incomeData,
z: 1,
},
// BarB,
{
type: "bar",
name: nameS[1],
stack: "left",
barWidth,
itemStyle: {
color: {
type: "linear",
x: 0,
x2: 0,
y: 0,
y2: 1,
colorStops: [
{ offset: 0, color: colors.barB.leftColor[0] },
{ offset: 1, color: colors.barB.leftColor[1] },
],
} as EChartOption.Color,
},
data: data2,
z: 2,
},
{
type: "bar",
name: nameS[1],
stack: "right",
barWidth,
itemStyle: {
color: {
type: "linear",
x: 0,
x2: 0,
y: 0,
y2: 1,
colorStops: [
{ offset: 0, color: colors.barB.rightColor[0] },
{ offset: 1, color: colors.barB.rightColor[1] },
],
} as EChartOption.Color,
},
data: data2,
z: 2,
},
{
type: "pictorialBar",
name: nameS[1],
symbol: "diamond",
symbolPosition: "end",
symbolOffset: ["50%", "-50%"],
symbolSize: [barWidth * 2, barWidth * 0.7],
symbolRotate: 0,
itemStyle: {
color: colors.barB.leftColor[1],
},
markPoint: {
symbol: "circle",
symbolSize: showLabel[0] ? 50 : 0,
itemStyle: {
color: "RGBA(10, 18, 48, 0)",
},
data: [
{
type: "max",
name: "最大值",
label: {
show: true,
fontSize: 20,
color: "rgba(255, 255, 255, 1)",
position: ["50%", "-10%"],
textBorderColor: "rgba(116, 83, 4, 1)",
textBorderWidth: 3,
},
},
{
type: "min",
name: "最小值",
label: {
show: true,
fontSize: 16,
color: "rgba(255, 255, 255, 1)",
position: ["75%", "50%"],
textBorderColor: "rgba(116, 83, 4, 1)",
textBorderWidth: 3,
},
},
],
},
data: data2,
z: 3,
},
{
type: "pictorialBar",
name: nameS[1],
symbol: "diamond",
symbolPosition: "start",
symbolOffset: ["50%", "50%"],
symbolSize: [barWidth * 2, barWidth * 0.7],
symbolRotate: 0,
itemStyle: {
color: colors.barB.leftColor[1],
},
data: data2,
z: 1,
},
// BarC,
{
type: "bar",
name: nameS[2],
stack: "left",
itemStyle: {
color: {
type: "linear",
x: 0,
x2: 0,
y: 0,
y2: 1,
colorStops: [
{ offset: 0, color: colors.barC.leftColor[0] },
{ offset: 1, color: colors.barC.leftColor[1] },
],
} as EChartOption.Color,
},
data: data3,
z: 2,
},
{
type: "bar",
name: nameS[2],
stack: "right",
barGap: "0",
itemStyle: {
color: {
type: "linear",
x: 0,
x2: 0,
y: 0,
y2: 1,
colorStops: [
{ offset: 0, color: colors.barC.rightColor[0] },
{ offset: 1, color: colors.barC.rightColor[1] },
],
} as EChartOption.Color,
},
data: data3,
z: 2,
},
{
type: "pictorialBar",
name: nameS[2],
symbol: "diamond",
symbolPosition: "end",
symbolOffset: ["50%", "-50%"],
symbolSize: [barWidth * 2, barWidth * 0.7],
symbolRotate: 0,
itemStyle: {
color: {
type: "linear",
x: 0,
x2: 0,
y: 0,
y2: 1,
colorStops: [
{ offset: 0, color: colors.barC.rightColor[1] },
{ offset: 0.5, color: colors.barC.rightColor[1] },
{ offset: 0.5, color: "transparent" },
{ offset: 1, color: "transparent" },
],
} as EChartOption.Color,
borderColor: colors.barC.topBorderColor,
},
markPoint: {
symbol: "circle",
symbolSize: showLabel[0] ? 50 : 0,
itemStyle: {
color: "RGBA(10, 18, 48, 0)",
},
data: [
{
type: "max",
name: "最大值",
label: {
show: true,
fontSize: 20,
color: "rgba(255, 255, 255, 1)",
position: ["50%", "-10%"],
textBorderColor: "rgba(116, 83, 4, 1)",
textBorderWidth: 3,
},
},
{
type: "min",
name: "最小值",
label: {
show: true,
fontSize: 16,
color: "rgba(255, 255, 255, 1)",
position: ["70%", "-10%"],
textBorderColor: "rgba(116, 83, 4, 1)",
textBorderWidth: 3,
},
},
],
},
markLine:
customMarkLine.show && customMarkLine.type === "bar" ? markLine : "",
data: dataSum,
z: 3,
},
// lines
...allSeriesLine,
],
tooltip: {
show: true,
trigger: "item",
},
};
return (
<ReactEcharts
option={option}
style={{ height: "100%", width: "100%" }}
notMerge={true}
/>
);
};
export default Three3dBarAndLineCharts;
FAQ
1、不要控制legend开关图表,封装的不好,会导致图表位置错乱
2、tooltip也有点问题,酌情使用


 3282
3282


 被折叠的 条评论
为什么被折叠?
被折叠的 条评论
为什么被折叠?
 到【灌水乐园】发言


