


近期在做Echarts图表时,想到使用拖拽方式 来改变图表的排序,做一个简单的笔记记录
使用的Html 做的效果
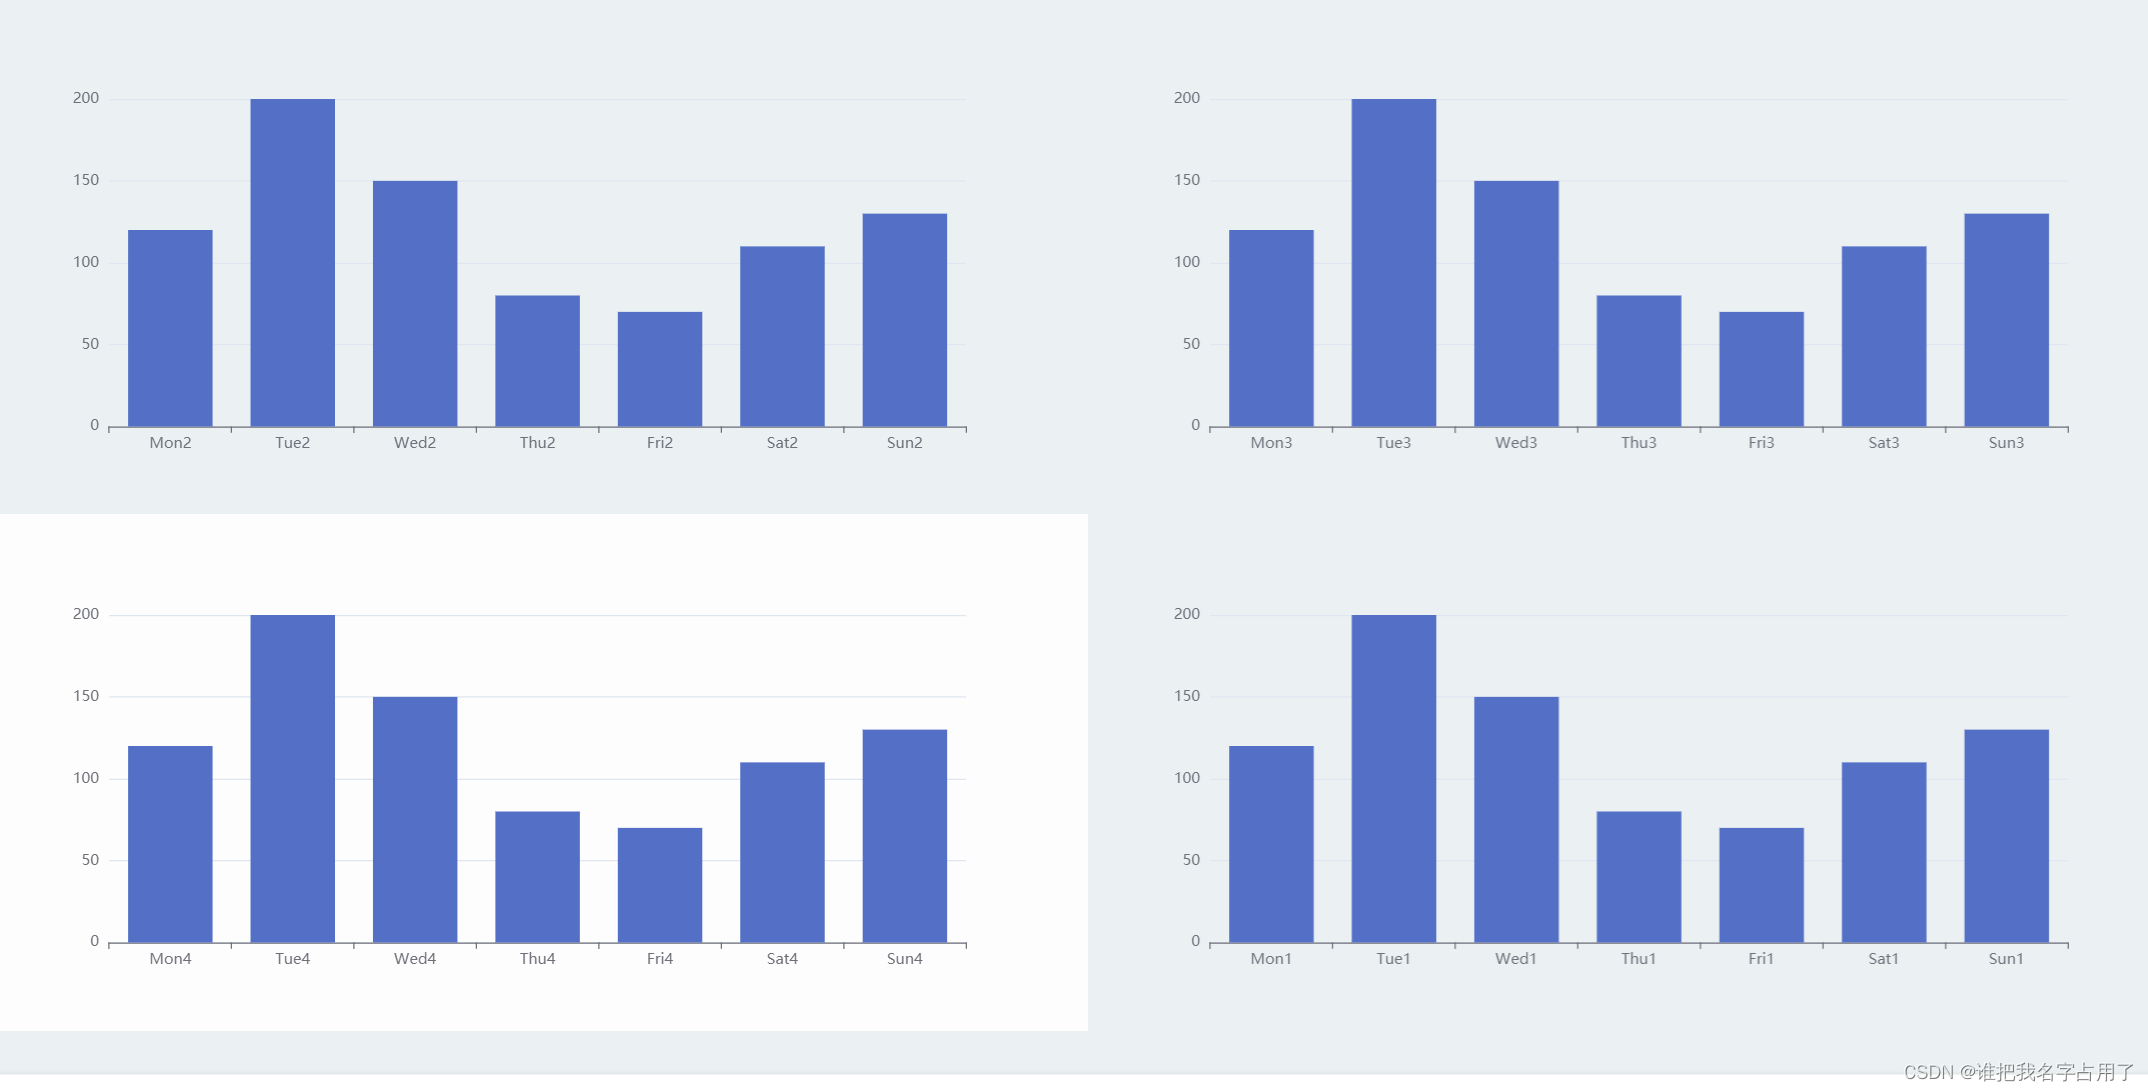
可以进行一个随意拖拽
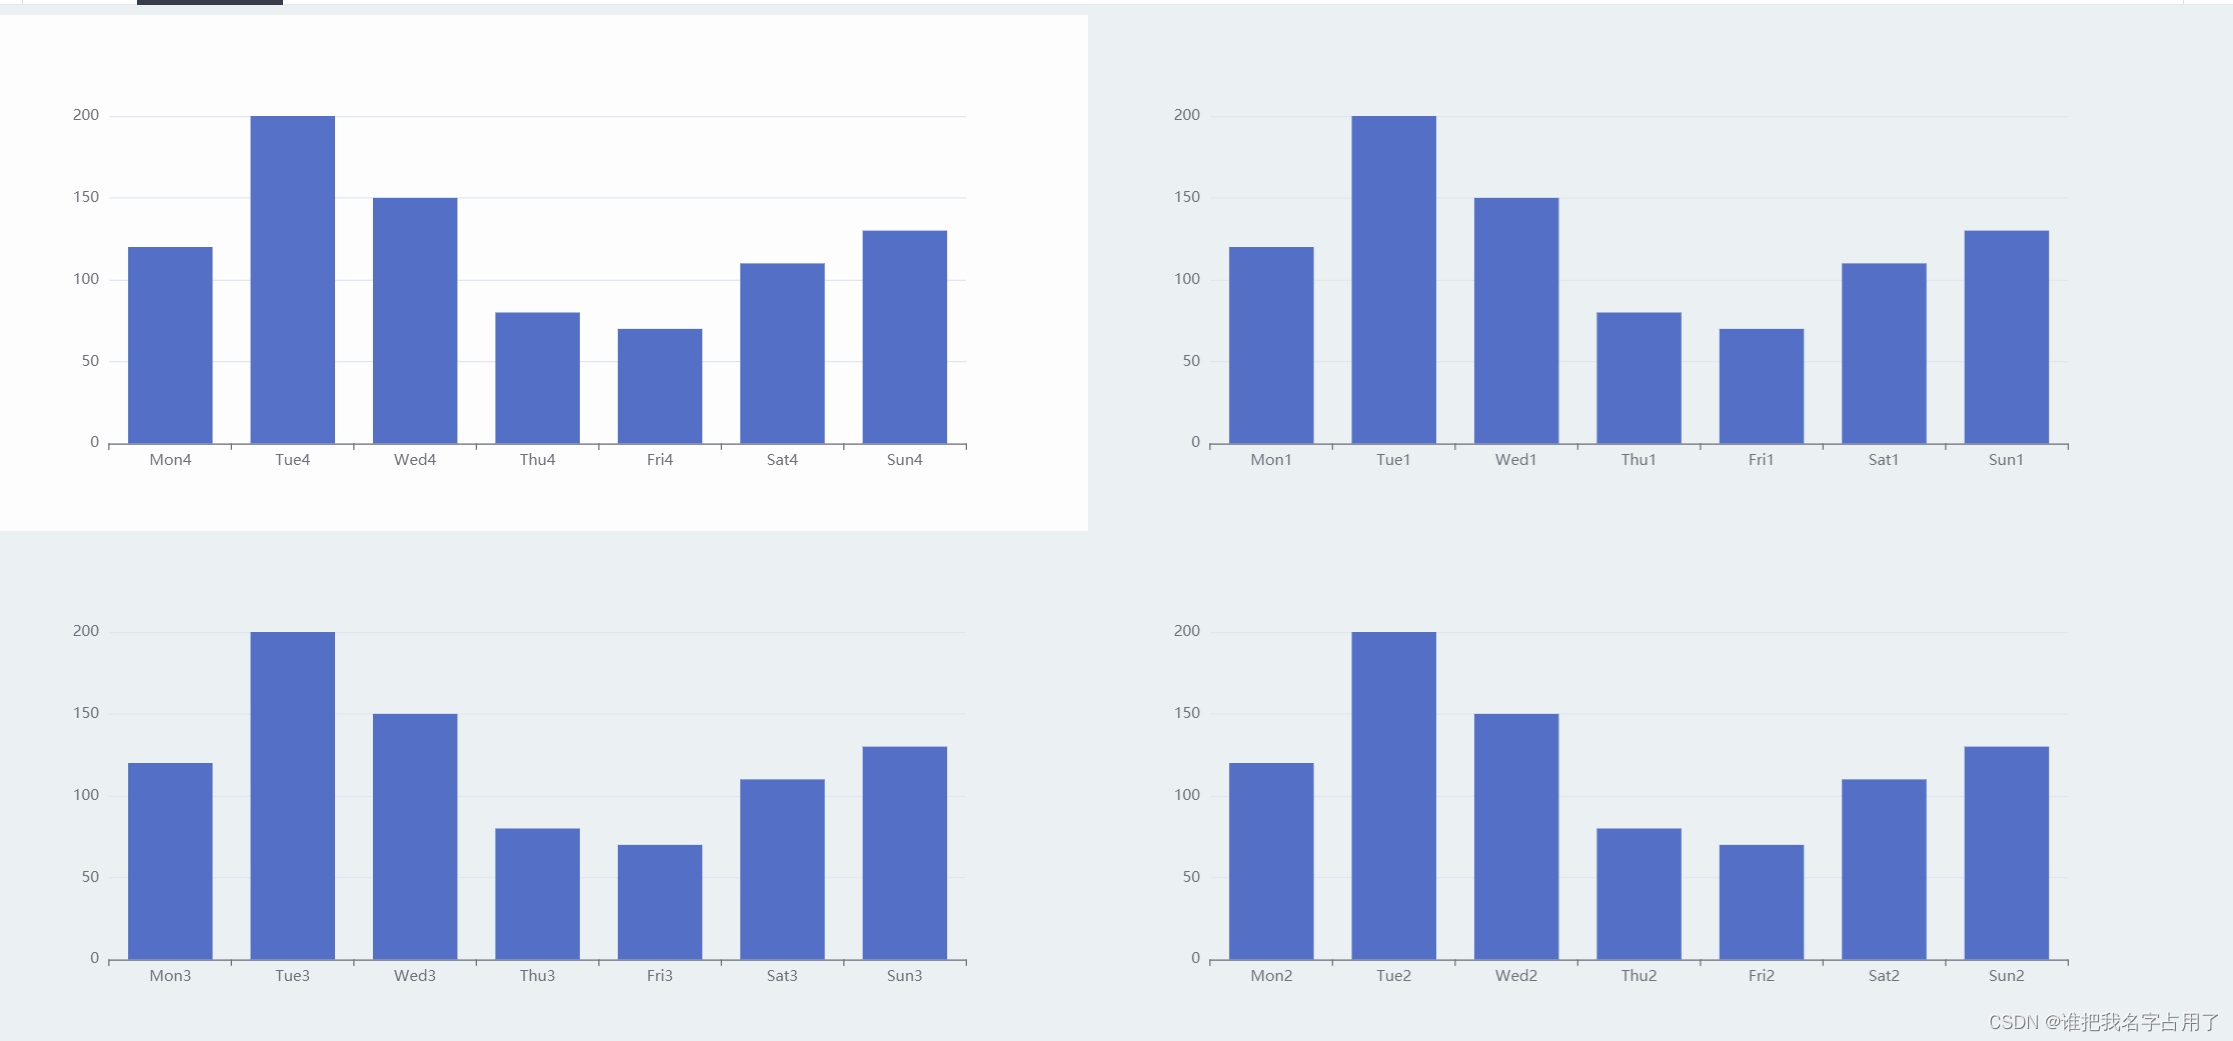
使用Flex布局来改变排序方式
 html, body, #app {
            height: 99%;
            width: 99%;
        }
        .el-row {
            height: 100%;
            width: 100%;
        }

            .el-row > .el-col{
                height: 100%;
            }
            .charts_div {
                height: 95%;
                width: 100%;
            }

        .charts_div1 {
            height: 5%;
            width: 100%;
        }

            .charts_div1:hover {
                cursor: move;
            }

        .el-col:hover {
            background-color: #fdfdfd;
        }

        .charts_div:hover {
            background-color: #fdfdfd;
        }
        .draggable_div {
            display: flex;
            flex-flow: row wrap;
        }
        .el-col {
            height: 49%;
        }
        .draggable_div, .transition_span {
            width: 100%;
            height: 100%;
        }
        /*定义拖拽样式*/
        .ghostClass {
            background-color: blue !important;
        }

        .chosenClass {
            background-color: red !important;
            opacity: 1 !important;
        }

        .dragClass {
            background-color: blueviolet !important;
            opacity: 1 !important;
            box-shadow: none !important;
            outline: none !important;
            background-image: none !important;
        }

            .item:hover {
                background-color: #fdfdfd;
                cursor: move;

            }

            .item + .item {
                border-top: none;
            }
Html代码
<div id="app">
        <template>
            <el-row :gutter="24">
                <draggable v-model="elcols" class="draggable_div" group="site" animation="300" dragClass="dragClass" ghostClass="ghostClass" chosenClass="chosenClass" v-on:start="onStart" v-on:end="onEnd">
                    <el-col :span="12" class="item" v-for="item in elcols" :key="item.id">
                        <div class="charts_div1"></div>
                        <div :id="item.id" class="charts_div"></div>
                    </el-col>
                </draggable>
            </el-row>
        </template>
    </div>
js片段
Vue.component('vuedraggable', window.vuedraggable.name)
    new Vue({
        el: "#app",
        components: {
            vuedraggable,
        },
        data() {//数据源
            return {
                drag: false,
                _echarts: null,
                elcols: [{ id: "chart1" }, { id: "chart2" }, { id: "chart3" }, { id: "chart4" }, { id: "chart5" }],
            }
        },
        created() {//页面加载前 1
            this._echarts = echarts;//初始化报表
        },
        mounted() {//页面加载后 3
            this.QueryEcharts();//加载报表
        },
        computed: {//监听事件 2

        },
        watch: {//全局监听属性改变时触发 4

        },
        methods: {//事件集合
            QueryEcharts() {//加载报表
                this.Echart1();
                this.Echart2();
                this.Echart3();
                this.Echart4();
                this.Echart5();
            },
            Echart1() {//加载第一个报表
                var option = {
                    xAxis: {
                        type: 'category',
                        data: ['Mon1', 'Tue1', 'Wed1', 'Thu1', 'Fri1', 'Sat1', 'Sun1']
                    },
                    yAxis: {
                        type: 'value'
                    },
                    series: [
                        {
                            data: [120, 200, 150, 80, 70, 110, 130],
                            type: 'bar'
                        }
                    ]
                };
                this._echarts.init(document.getElementById('chart1')).setOption(option);
            },
            Echart2() {
                var option = {
                    xAxis: {
                        type: 'category',
                        data: ['Mon2', 'Tue2', 'Wed2', 'Thu2', 'Fri2', 'Sat2', 'Sun2']
                    },
                    yAxis: {
                        type: 'value'
                    },
                    series: [
                        {
                            data: [120, 200, 150, 80, 70, 110, 130],
                            type: 'bar'
                        }
                    ]
                };
                this._echarts.init(document.getElementById('chart2')).setOption(option);
            },
            Echart3() {
                var option = {
                    xAxis: {
                        type: 'category',
                        data: ['Mon3', 'Tue3', 'Wed3', 'Thu3', 'Fri3', 'Sat3', 'Sun3']
                    },
                    yAxis: {
                        type: 'value'
                    },
                    series: [
                        {
                            data: [120, 200, 150, 80, 70, 110, 130],
                            type: 'bar'
                        }
                    ]
                };
                this._echarts.init(document.getElementById('chart3')).setOption(option);
            },
            Echart4() {
                var option = {
                    xAxis: {
                        type: 'category',
                        data: ['Mon4', 'Tue4', 'Wed4', 'Thu4', 'Fri4', 'Sat4', 'Sun4']
                    },
                    yAxis: {
                        type: 'value'
                    },
                    series: [
                        {
                            data: [120, 200, 150, 80, 70, 110, 130],
                            type: 'bar'
                        }
                    ]
                };
                this._echarts.init(document.getElementById('chart4')).setOption(option);
            },
            Echart5() {
                var option = {
                    xAxis: {
                        type: 'category',
                        data: ['Mon5', 'Tue5', 'Wed5', 'Thu5', 'Fri5', 'Sat5', 'Sun5']
                    },
                    yAxis: {
                        type: 'value'
                    },
                    series: [
                        {
                            data: [120, 200, 150, 80, 70, 110, 130],
                            type: 'bar'
                        }
                    ]
                };
                this._echarts.init(document.getElementById('chart5')).setOption(option);
            },
            onStart(e) {
                this.drag = true;
            },
            onEnd(e) {
                this.drag = false;
            },
        }
    })
需要使用的js和css
element UI可以到官网
lar Vue UI frameworkElement - The world's most popular Vue UI frameworklar Vue UI framework
<link href="~/css/element.css" rel="stylesheet" />
<script src="~/js/element.js"></script>
Ecaherts 官网下载
<script src="~/js/echarts.js"></script>
Vue使用的是v2.6.14
<script src="~/js/vue.js"></script>
拖拽使用的是 vue.draggable 插件
vue.draggable两列或多列之间相互拖动 - itxst.com
<script src="~/js/Sortable.min.js"></script>
<script src="~/js/vuedraggable.umd.min.js"></script>
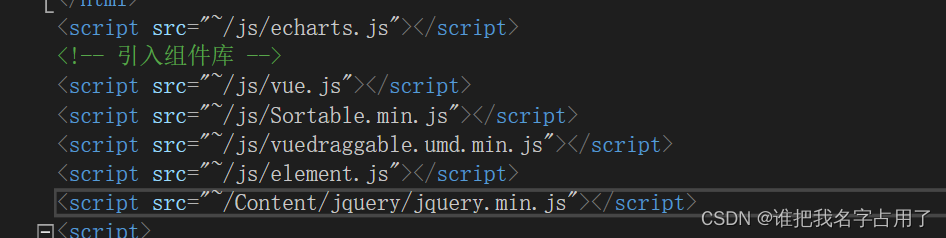
下面在贴一个整体的代码
<!DOCTYPE html>

<html>
<head>
    <meta name="viewport" content="width=device-width" />
    <!-- 引入样式 -->
    <link href="~/css/element.css" rel="stylesheet" />
    <title>报表统计</title>
    <meta name="viewport" content="width=device-width, initial-scale=1.0, maximum-scale=1.0, minimum-scale=1.0, user-scalable=no, minimal-ui">
    <style>
        html, body, #app {
            height: 99%;
            width: 99%;
        }
        .el-row {
            height: 100%;
            width: 100%;
        }

            .el-row > .el-col{
                height: 100%;
            }
            .charts_div {
                height: 95%;
                width: 100%;
            }

        .charts_div1 {
            height: 5%;
            width: 100%;
        }

            .charts_div1:hover {
                cursor: move;
            }

        .el-col:hover {
            background-color: #fdfdfd;
        }

        /*.el-row .el-col:first-child {
            border-right: 1px solid #ffffff;
        }

        .el-row:first-child > .el-col {
            border-bottom: 1px solid #ffffff;
        }*/

        .charts_div:hover {
            background-color: #fdfdfd;
        }
        .draggable_div {
            display: flex;
            flex-flow: row wrap;
        }
        .el-col {
            height: 49%;
        }
        .draggable_div, .transition_span {
            width: 100%;
            height: 100%;
        }
        /*定义拖拽样式*/
        .ghostClass {
            background-color: blue !important;
        }

        .chosenClass {
            background-color: red !important;
            opacity: 1 !important;
        }

        .dragClass {
            background-color: blueviolet !important;
            opacity: 1 !important;
            box-shadow: none !important;
            outline: none !important;
            background-image: none !important;
        }

            .item:hover {
                background-color: #fdfdfd;
                cursor: move;

            }

            .item + .item {
                border-top: none;
            }

    </style>
</head>
<body>
    <div id="app">
        <template>
            <el-row :gutter="24">
                <draggable v-model="elcols" class="draggable_div" group="site" animation="300" dragClass="dragClass" ghostClass="ghostClass" chosenClass="chosenClass" v-on:start="onStart" v-on:end="onEnd">
                    <el-col :span="12" class="item" v-for="item in elcols" :key="item.id">
                        <div class="charts_div1"></div>
                        <div :id="item.id" class="charts_div"></div>
                    </el-col>
                </draggable>
            </el-row>
        </template>
    </div>
</body>
</html>
<script src="~/js/echarts.js"></script>
<!-- 引入组件库 -->
<script src="~/js/vue.js"></script>
<script src="~/js/Sortable.min.js"></script>
<script src="~/js/vuedraggable.umd.min.js"></script>
<script src="~/js/element.js"></script>
<script src="~/Content/jquery/jquery.min.js"></script>
<script>
    Vue.component('vuedraggable', window.vuedraggable.name)
    new Vue({
        el: "#app",
        components: {
            vuedraggable,
        },
        data() {//数据源
            return {
                drag: false,
                _echarts: null,
                elcols: [{ id: "chart1" }, { id: "chart2" }, { id: "chart3" }, { id: "chart4" }, { id: "chart5" }],
            }
        },
        created() {//页面加载前 1
            this._echarts = echarts;//初始化报表
        },
        mounted() {//页面加载后 3
            this.QueryEcharts();//加载报表
        },
        computed: {//监听事件 2

        },
        watch: {//全局监听属性改变时触发 4

        },
        methods: {//事件集合
            QueryEcharts() {//加载报表
                this.Echart1();
                this.Echart2();
                this.Echart3();
                this.Echart4();
                this.Echart5();
            },
            Echart1() {//加载第一个报表
                var option = {
                    xAxis: {
                        type: 'category',
                        data: ['Mon1', 'Tue1', 'Wed1', 'Thu1', 'Fri1', 'Sat1', 'Sun1']
                    },
                    yAxis: {
                        type: 'value'
                    },
                    series: [
                        {
                            data: [120, 200, 150, 80, 70, 110, 130],
                            type: 'bar'
                        }
                    ]
                };
                this._echarts.init(document.getElementById('chart1')).setOption(option);
            },
            Echart2() {
                var option = {
                    xAxis: {
                        type: 'category',
                        data: ['Mon2', 'Tue2', 'Wed2', 'Thu2', 'Fri2', 'Sat2', 'Sun2']
                    },
                    yAxis: {
                        type: 'value'
                    },
                    series: [
                        {
                            data: [120, 200, 150, 80, 70, 110, 130],
                            type: 'bar'
                        }
                    ]
                };
                this._echarts.init(document.getElementById('chart2')).setOption(option);
            },
            Echart3() {
                var option = {
                    xAxis: {
                        type: 'category',
                        data: ['Mon3', 'Tue3', 'Wed3', 'Thu3', 'Fri3', 'Sat3', 'Sun3']
                    },
                    yAxis: {
                        type: 'value'
                    },
                    series: [
                        {
                            data: [120, 200, 150, 80, 70, 110, 130],
                            type: 'bar'
                        }
                    ]
                };
                this._echarts.init(document.getElementById('chart3')).setOption(option);
            },
            Echart4() {
                var option = {
                    xAxis: {
                        type: 'category',
                        data: ['Mon4', 'Tue4', 'Wed4', 'Thu4', 'Fri4', 'Sat4', 'Sun4']
                    },
                    yAxis: {
                        type: 'value'
                    },
                    series: [
                        {
                            data: [120, 200, 150, 80, 70, 110, 130],
                            type: 'bar'
                        }
                    ]
                };
                this._echarts.init(document.getElementById('chart4')).setOption(option);
            },
            Echart5() {
                var option = {
                    xAxis: {
                        type: 'category',
                        data: ['Mon5', 'Tue5', 'Wed5', 'Thu5', 'Fri5', 'Sat5', 'Sun5']
                    },
                    yAxis: {
                        type: 'value'
                    },
                    series: [
                        {
                            data: [120, 200, 150, 80, 70, 110, 130],
                            type: 'bar'
                        }
                    ]
                };
                this._echarts.init(document.getElementById('chart5')).setOption(option);
            },
            onStart(e) {
                this.drag = true;
            },
            onEnd(e) {
                this.drag = false;
            },
        }
    })
</script>
只为了做一个简单的笔记 防止以后忘记 写的不好之处勿喷


 121
121


 被折叠的 条评论
为什么被折叠?
被折叠的 条评论
为什么被折叠?
 到【灌水乐园】发言


