


目录
3、配置systemd服务 用systemctl来管理prometheus
一、什么是Prometheus?
Prometheus是由SoundCloud开发的开源监控报警系统和时序列数据库(TSDB)
二、特点
- 强大的多维度数据模型
- 时间序列数据通过metric和标签labels 键值对来区分
- 所有的metrics都可以设置任意的多维标签
- 强大的查询语句
- 易于管理
- prometheus server 是一个单独的二进制文件,可以直接在本地工作,不依赖于分布式存储
- 高效的存储
- 可以采用 push gata way的方式把时间序列数据推送至Prometheus server端
- 可以通过服务发现或者静态配置去获取监控的 targets
- 有多重可视化图形界面,一般和grafana配合使用
三、prometheus 的生态组件:
- prometheus server:用于收集和存储 时间序列数据。由3部分组成:
- Retrieval :负责在活跃的target主机上抓取监控指标数据
- storage:存储,主要是吧采集到的数据存储到磁盘
- promql:是prometheus 提供的查询语模块
- Client Library: 客户端库
- Push gateway:各个目标主机可上报数据到pushgateway,然后prometheus server统一从pushgateway拉取数据。
- exporters:收集监控样本数据,并以标准格式向P 提供
- alertmanager:从 Prometheus server 端接收到 alerts 后,会进行去重,分组,并路由到相应的接收方,发出报警,常见的接收方式有:电子邮件,微信,钉钉, slack等。
- grafana:监控仪表盘,可视化监控数据
四、Prometheus架构图
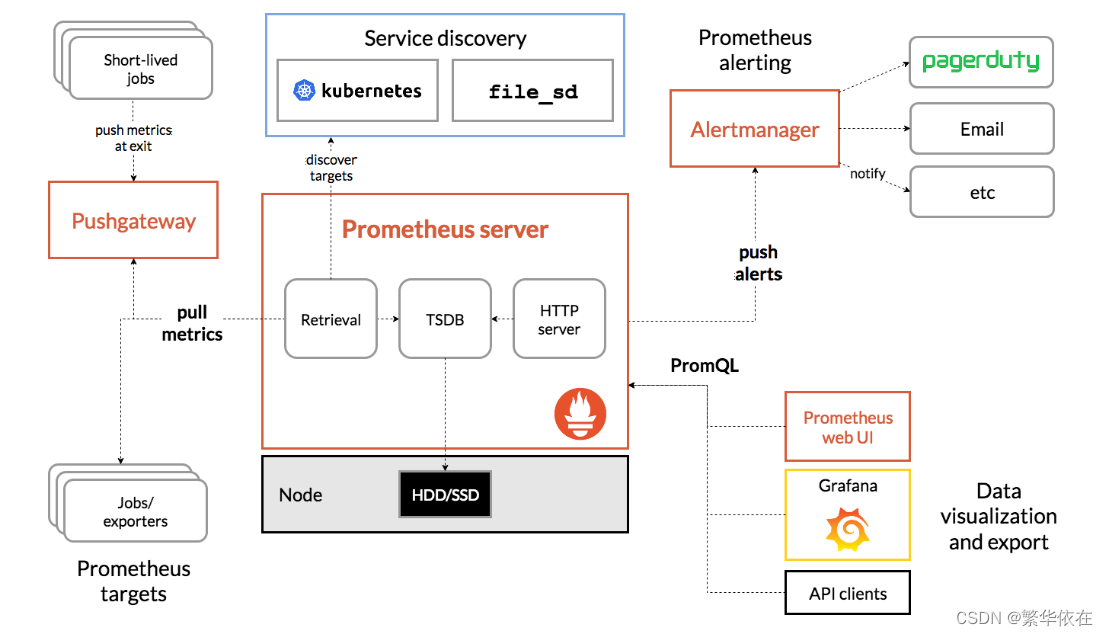
五、prometheus 的工作模式
- Retrieval是负责定时去暴露的目标页面上去抓取采样指标数据。
- Storage 是负责将采样数据写入指定的时序数据库存储。
- PromQL 是Prometheus提供的查询语言模块。可以和一些webui比如grfana集成。
- Jobs / Exporters:Prometheus 可以从 Jobs 或 Exporters 中拉取监控数据。Exporter 以 Web API 的形式对外暴露数据采集接口。
- Prometheus Server:Prometheus 还可以从其他的 Prometheus Server 中拉取数据。
- Pushgateway:对于一些以临时性 Job 运行的组件,Prometheus 可能还没有来得及从中 pull 监控数据的情况下,这些 Job 已经结束了,Job 运行时可以在运行时将监控数据推送到 Pushgateway 中,Prometheus 从 Pushgateway 中拉取数据,防止监控数据丢失。
- Service discovery:是指 Prometheus 可以动态的发现一些服务,拉取数据进行监控,如从DNS,Kubernetes,Consul 中发现, file_sd 是静态配置的文件。
- AlertManager:是一个独立于 Prometheus 的外部组件,用于监控系统的告警,通过配置文件可以配置一些告警规则,Prometheus 会把告警推送到 AlertManager。
六、Prometheus 的工作流程
- Prometheus 以Prometheus server 为核心,用于收集和存储时间序列数据。 Prometheus Server 从监控目标中通过 pull 方式拉取指标数据,或通过 pushgateway 把采集的数据拉取到 Prometheus server 中。
- Prometheus server 把采集到的监控指标数据通过 TSDB 存储到本地 HDD/SSD 中。
- Prometheus 采集的监控指标数据按时间序列存储,通过配置报警规则,把触发的告警通知发送到 Alertmanager。
- Alertmanager 通过配置报警接收方,发送报警到邮件、钉钉或者企业微信等。
- Prometheus 自带的 Web UI 界面提供 PromQL 查询语言,可查询监控数据。
- Grafana 可接入 Prometheus 数据源,把监控数据以图形化形式展示出。
七、部署Prometheus
下载安装包
官网:https://prometheus.io/
[root@rabbitmq_2 prometheus]# wget https://github.com/prometheus/prometheus/releases/download/v2.45.1/prometheus-2.45.1.linux-amd64.tar.gz
解压:
[root@rabbitmq_2 prometheus]# tar -xvf prometheus-2.45.1.linux-amd64.tar.gz
移动到opt/
[root@rabbitmq_2 prometheus]# mv prometheus-2.45.1.linux-amd64 /opt/prometheus/prometheus
创建prometheus 用户
[root@rabbitmq_2 prometheus]# useradd -M -s /usr/sbin/nologin prometheus
[root@rabbitmq_2 prometheus]# id prometheus
uid=1001(prometheus) gid=1001(prometheus) 组=1001(prometheus)
给这个目录授权
[root@rabbitmq_2 prometheus]# chown prometheus:prometheus -R /opt/prometheus
1、prometheus配置文件介绍
# my global config
global:
  scrape_interval: 15s # Set the scrape interval to every 15 seconds. Default is every 1 minute.
  evaluation_interval: 15s # Evaluate rules every 15 seconds. The default is every 1 minute.
  # scrape_timeout is set to the global default (10s).

# Alertmanager configuration
alerting:
  alertmanagers:
    - static_configs:
        - targets:
          - localhost:9093

# Load rules once and periodically evaluate them according to the global 'evaluation_interval'.
rule_files:
  - "alert.yml"
  # - "first_rules.yml"
  # - "second_rules.yml"

# A scrape configuration containing exactly one endpoint to scrape:
# 抓取配置列表
scrape_configs:
  # The job name is added as a label `job=<job_name>` to any timeseries scraped from this config.
  - job_name: "prometheus"

    # metrics_path defaults to '/metrics'
    # scheme defaults to 'http'.

    static_configs:
      - targets: ["localhost:9090"]
  # node_exporter配置
  - job_name: "node_exporter"
    scrape_interval: 15s
    static_configs:
    - targets: ["localhost:9100"]
      labels:
        instance: Prometheus服务器

    - targets: ["192.168.134.132:9100"]
      labels:
        instance: test主服务器
2、配置文件详解
# 配置文件解释
global:
  scrape_interval:15s //每次数据采集的时间间隔,默认为1分钟
  scrape_timeout:采集请求超时时间,默认为10秒
  evaluation_interval:执行rules的频率,默认为1分钟
  scrape_configs:主要用于配置被采集数据节点操作,每一个采集配置主要由以下几个参数
    job_name:全局唯一名称
    scrape_interval:默认等于global内设置的参数,设置后可以覆盖global中的值
    scrape_timeout:默认等于global内设置的参数
metrics_path:从targets获取meitric的HTTP资源路径,默认是/metrics
honor_labels:Prometheus如何处理标签之间的冲突。若设置为True,则通过保留变迁来解决冲突;若设置为false,则通过重命名;
scheme:用于请求的协议方式,默认是http
params:数据采集访问时HTTP URL设定的参数
relabel_configs:采集数据重置标签配置
metric_relabel_configs:重置标签配置
sample_limit:对每个被已知样本数量的每次采集进行限制,如果超过限制,该数据将被视为失
败。默认值为0,表示无限制

全局配置 global
global: 用于设置全局配置项,这些配置项会应用于所有的抓取配置和路由规则
    scrape_interval: 定义 Prometheus 服务器定期抓取指标的时间间隔,默认为 1 分钟(1m)
    evaluation_interval: 定义 Prometheus 服务器执行规则评估的时间间隔,默认为 1 分钟(1m)
    external_labels: 定义 Prometheus 实例应用于所有接收的指标的标签列表。这些标签可用于识别不同的 Prometheus 实例,或标识集群、环境等信息
    scrape_configs:主要用于配置被采集数据节点操作,每一个采集配置主要由以下几个参数
        job_name:全局唯一名称
        scrape_interval:默认等于global内设置的参数,设置后可以覆盖global中的值
        scrape_timeout:默认等于global内设置的参数
告警通知 alerting
alerting: 触发告警后通知方式
    alertmanagers: 定义了告警管理器的地址,触发告警后会委托给管理器处理。在上面的例子中,告警管理器的地址是 localhost:9093,并且这个地址是静态配置的,也就是说 Prometheus 不会动态地发现新的告警管理器
规则文件加载 rule_files
rule_files: 加载告警规则文件列表
    在这个示例中,定义了 Prometheus 加载的规则文件列表,包括了一个名为 memory_usage.rules 的告警规则文件和一个名为 disk_usage.rules 的记录规则文件
根据正则表达式加载规则文件,如 /opt/bitnami/prometheus/rules/*rule.yml 是以 /etc/prometheus/rules/ 目录下的所有以 rules 结尾的文件都将作为规则文件进行加载

scrape_configs:抓取目标的指标
    scrape_config: 定义数据抓取目标的配置
    job_name: 用于定义要抓取的目标的名称,可以是单个目标或者多个目标。这些目标可以是HTTP、HTTPS、DNS、SNMP、JMX等协议。Prometheus会使用这个名称进行区分,当一个目标被成功抓取时,Prometheus会给它一个时间戳并存储相应的指标。在查询时,可以使用job_name来选择要查询的指标源
    metrics_path: 用于指定指标数据的路径,上面的例子中的 JVM 是从 /actuator/prometheus 路径获取对应的指标。如果没有可以去掉或者注释掉 #metrics_path: '/actuator/prometheus'
    static_configs: 是一种配置方式,用于定义一组静态的目标列表
    targets: 用于定义需要抓取指标的目标的列表。它指定了要监控的目标的IP地址和端口号,让Prometheus定期去访问这些地址,抓取相应的指标数据
    labels: 可以为每个job_name和target添加一些labels,以便更好地描述和区分指标数据,可以通过这些labels来查询和过滤指标数据,并在报警规则中使用这些labels来进行更加精准的报警。在上述例子的 JVM 则是用于标识各类环境或分组。
注意 : labels 如果要使用中文,必须确认文件格式是否为 UTF-8,可以的话尽量使用 vscode 查看一下,不然可能会导致 Prometheus 启动失败
3、配置systemd服务 用systemctl来管理prometheus
vim  /usr/lib/systemd/system/prometheus.service
[Unit]
Description=Prometheus Server
Documentation=https://prometheus.io
After=network.target

[Service]
Type=simple
User=prometheus
Group=prometheus
Restart=on-failure
ExecStart=/opt/prometheus/prometheus/prometheus \
--config.file=/opt/prometheus/prometheus/prometheus.yml \
--storage.tsdb.path=/opt/prometheus/prometheus/data/ \
--storage.tsdb.retention=60d \
--web.enable-lifecycle

[Install]
WantedBy=multi-user.target

配置完之后 启动
[root@rabbitmq_2 system]# systemctl start prometheus.service

[root@rabbitmq_2 system]# systemctl status prometheus.service
● prometheus.service - Prometheus Server
   Loaded: loaded (/usr/lib/systemd/system/prometheus.service; disabled; vendor preset: disabled)
   Active: active (running) since 三 2023-11-22 16:41:35 CST; 4s ago
查看web界面是否正常
http://192.168.153.129:9090/
监控指标:
http://192.168.153.129:9090/metrics
都正常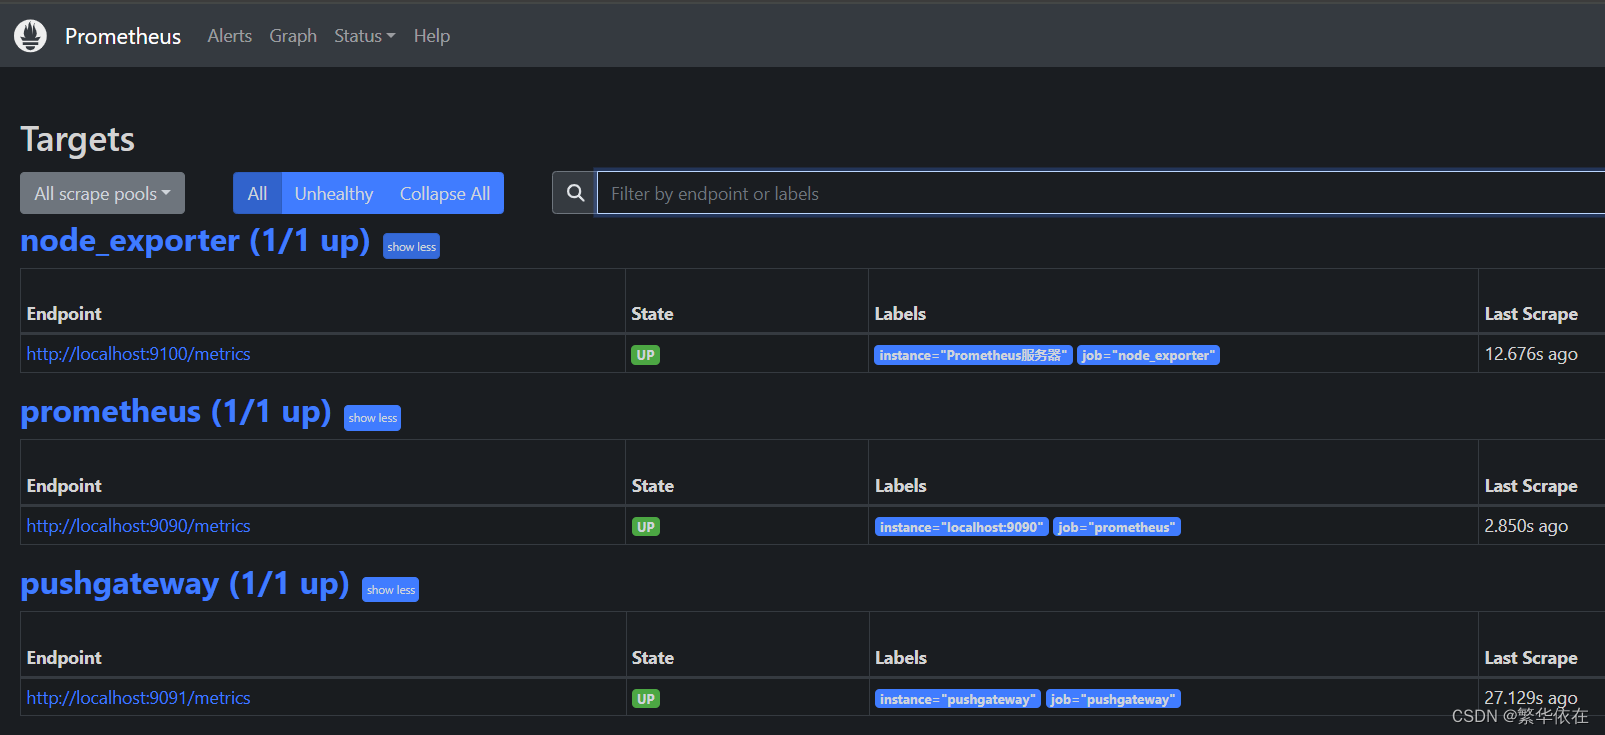


 2510
2510

 被折叠的 条评论
为什么被折叠?
被折叠的 条评论
为什么被折叠?
 到【灌水乐园】发言


