


import numpy as np
from sklearn.svm import SVR
import matplotlib.pyplot as plt
%# % matplotlib inline(再jupyter中实现可加上)
#自定义样本点rand,并且生成sin值
x = np.random.rand(40,1)*5
X_train = np.sort(x,axis = 0)
print(“X_train:%s”%X_train)
y_train = np.sin(X_train)
print(“y_train:%s”%y_train)
y_train[::5]+= np.random.randn(8,1)
print(“y_train:%s”%y_train)
plt.scatter(X_train,y_train)
plt.ylim(-2.5,2.5)
svr_linear = SVR(kernel=‘linear’)
svr_rbf = SVR(kernel=‘rbf’)#默认设置
svr_poly = SVR(kernel=‘poly’)
#数据的预测
%# x_test= np.arange(0,5,0.01).reshape((-1,1))
x_test= np.arange(0,5,0.01)[:,np.newaxis]
%# print(“X_train.shape:%s”%X_train.shape[1])
%# print(“y_train.shape:%s”%y_train.shape[1])
print(“x_test.shape:%s”%x_test.shape[0])
linear_y_ = svr_linear.fit(X_train,y_train).predict(x_test)
rbf_y_ = svr_rbf.fit(X_train,y_train).predict(x_test)
poly_y = svr_poly.fit(X_train,y_train).predict(x_test)
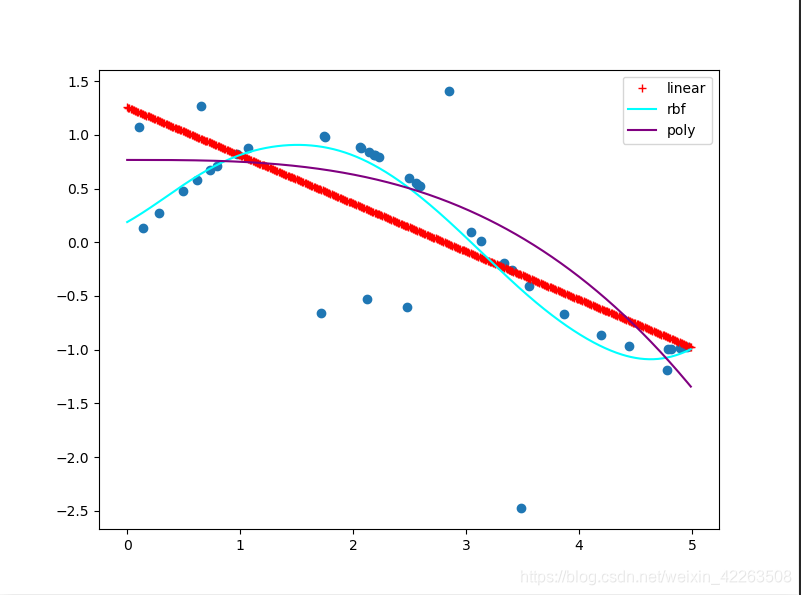
#绘制图形,观察三种支持向量机内核不同
plt.figure(figsize=(8,6))
plt.scatter(X_train,y_train)
plt.plot(x_test,linear_y_, ‘r+’,label=“linear”)
plt.plot(x_test,rbf_y_,‘cyan’,label = ‘rbf’)
plt.plot(x_test,poly_y,‘purple’,label=‘poly’)
plt.legend()
plt.show()
注:线性的linear可以画出分割线,但是高维的就没法画出分割面,所以一般SVM预测都是可以画出预测的线,分割线无法画出。那如何才能知道哪个核函数最好,这就需要测试之后才能知道。哪个测试出来的准确率高就用哪个


 616
616


 被折叠的 条评论
为什么被折叠?
被折叠的 条评论
为什么被折叠?
 到【灌水乐园】发言


