


1.导入第三方依赖
<link rel="stylesheet" href="https://lib.baomitu.com/ol3/4.6.5/ol.css">
<script src="https://lib.baomitu.com/ol3/4.6.5/ol.js"></script>
2.初始化地图
初始化地图new ol.Map({})
参数target:制定初始化的地图设置到html页面上的哪一个DOM元素上
参数layers:
通过这个参数的名字我可以推断一个map可以设置多个layer,图层是构成openlayers的基本单位,地图是由多个layer组成的,这种设计类似于Photoshop里面的图层,多个图层是可以叠加的,在最上面的会覆盖下面的
参数view:视图是设置地图的显示范围,包括中心点,放大级别,坐标
EPSG:4326是一个在 GIS(地理信息系统)中使用的坐标参考系(Coordinate Reference System)代码。它表示一个地理坐标系,即使用经纬度来表示地理位置。
EPSG代码是由 European Petroleum Survey Group 分配的,它是一个用于统一管理坐标参考系的代码。4326代码是在 WGS 84(世界大地测量系统)椭球体模型的基础上定义的。
EPSG:4326 常被用于在网络上传输地理位置信息,如在 Web 地图服务和地理位置 API 等。
EPSG:4326 的经纬度范围是:经度范围在 -180° 到 180° 之间,纬度范围在 -90° 到 90° 之间
<!DOCTYPE html>
<html lang="en">
  <head>
    <meta charset="UTF-8">
    <meta http-equiv="X-UA-Compatible" content="IE=edge">
    <meta name="viewport" content="width=device-width, initial-scale=1.0">
    <title>Document</title>
    <!-- 1.引入第三方库 -->
    <link rel="stylesheet" href="https://lib.baomitu.com/ol3/4.6.5/ol.css">
    <script src="https://lib.baomitu.com/ol3/4.6.5/ol.js"></script>
    <style>
      *{margin:0;padding:0}
      #map{
        width:100vw;
        height: 100vh;
      }
    </style>
  </head>

  <body>
    <!-- 2、设置地图的挂载点 -->
    <div id="map">
    </div>
    <script>
    // 3.初始化一个高德地图层
      const gaode = new ol.layer.Tile({
        title: "高德地图",
        source: new ol.source.XYZ({
          url: 'http://wprd0{1-4}.is.autonavi.com/appmaptile?lang=zh_cn&size=1&style=7&x={x}&y={y}&z={z}',
          wrapX: false
        })
      });
      //4.初始化openlayer地图
      const map = new ol.Map({
        // 将初始化的地图设置到id为map的DOM元素上
        target: "map",
        //设置图层
        layers: [
          gaode
        ],
        view:new ol.View({
          center:[114.30,30.50],
          //设置地图放大级别
          zoom:12,
          projection:'EPSG:4326'
        })
      })
    </script>
  </body>
</html>
总结
一个openlayer的地图,主要由layer和view组成。layer可以有多个,view只能设置一个。
3.地图控件
        /* 视图跳转控件 */
        const ZoomToExtent = new ol.control.ZoomToExtent({
            extent: [110, 30, 160, 30],
        })
        map.addControl(ZoomToExtent)
        /* 放大缩小控件 */
        const zoomslider = new ol.control.ZoomSlider();
        map.addControl(zoomslider)
        //全屏控件
        const fullScreen = new ol.control.FullScreen();
        map.addControl(fullScreen)
4.绘制矢量图形
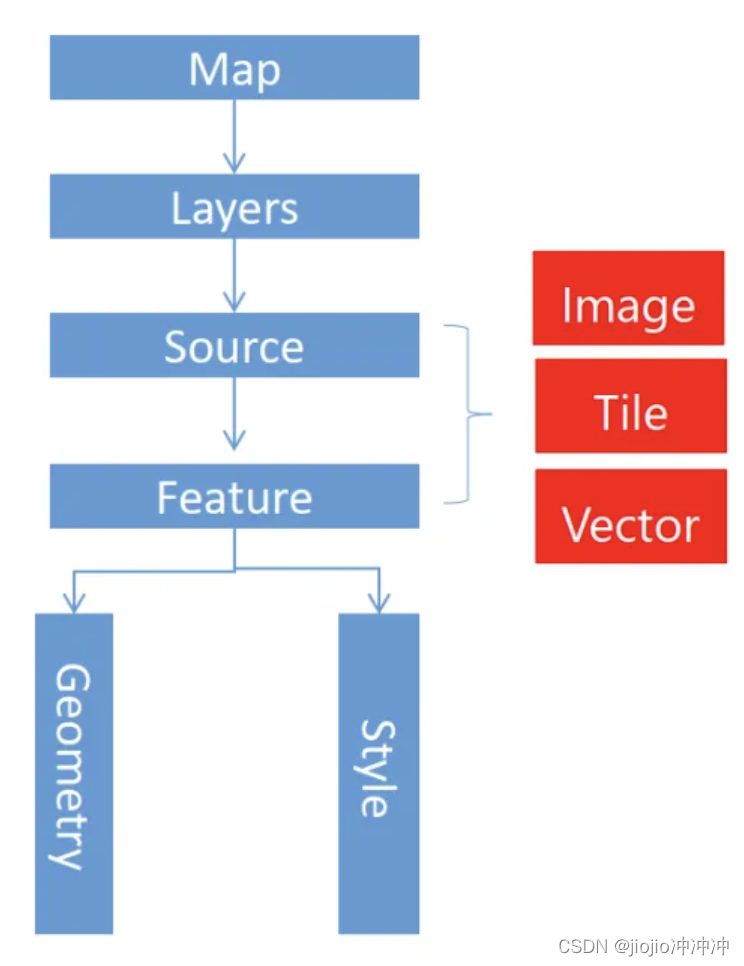
1、通过几何信息和样式信息构建要素
2、将要素添加到矢量数据源
3、将矢量数据源添加到矢量图层
4、将矢量图层添加到地图容器
        /* 1、构建要素 */
        var point = new ol.Feature({
            geometry: new ol.geom.Point([114.30, 30.50])
        })
        let style = new ol.style.Style({
            // image属性设置点要素的样式
            image: new ol.style.Circle({
                //radius设置点的半径 单位degree
                radius: 10,
                fill: new ol.style.Fill({
                    color: "#ff2d51"
                }),
                //描边
                stroke: new ol.style.Stroke({
                    color: "#333",
                    width: 2
                })
            })
        })
        point.setStyle(style);
        /* 2、将要素添加到矢量数据源 */
        const source = new ol.source.Vector({
            features: [point]
        })
        /* 3、将矢量数据源添加到矢量图层 */
        const layer = new ol.layer.Vector({
            source
        })
        /* 4、将矢量图层添加到地图容器 */
        map.addLayer(layer)
5.加载GeoJSON数据
geojson数据是矢量数据,是包含地理信息的json数据,格式是以key:value的形式存在的。后缀以geojson结尾
5.1设置点要素
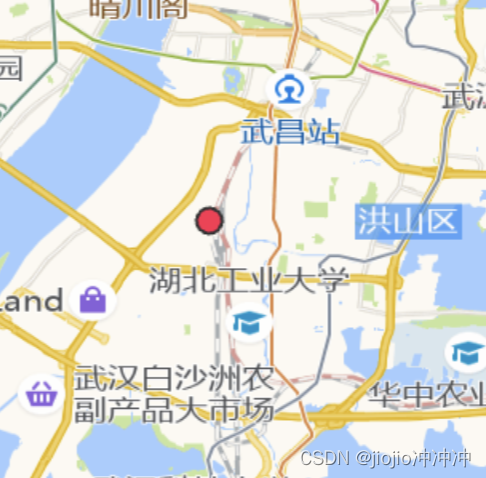
      //1.创建geojson数据
       var data = {
            type: "FeatureCollection",
            features: [
                {
                    type: "Feature",
                    geometry: {
                        type: "Point",
                        coordinates: [114.30, 30.50]
                    }
                }
            ]
        }
        var source = new ol.source.Vector({
            /* 2.将geojson数据设置给实例数据源 */
            features: new ol.format.GeoJSON().readFeatures(data)
        })
        var layer = new ol.layer.Vector({
            source
        })
        map.addLayer(layer);
        const style = new ol.style.Style({
            image: new ol.style.Circle({
                radius: 8,
                fill: new ol.style.Fill({
                    color: "#ff2d51"
                }),
                stroke: new ol.style.Stroke({
                    color: '#333',
                    width: 2
                })
            }),

        })
        layer.setStyle(style);
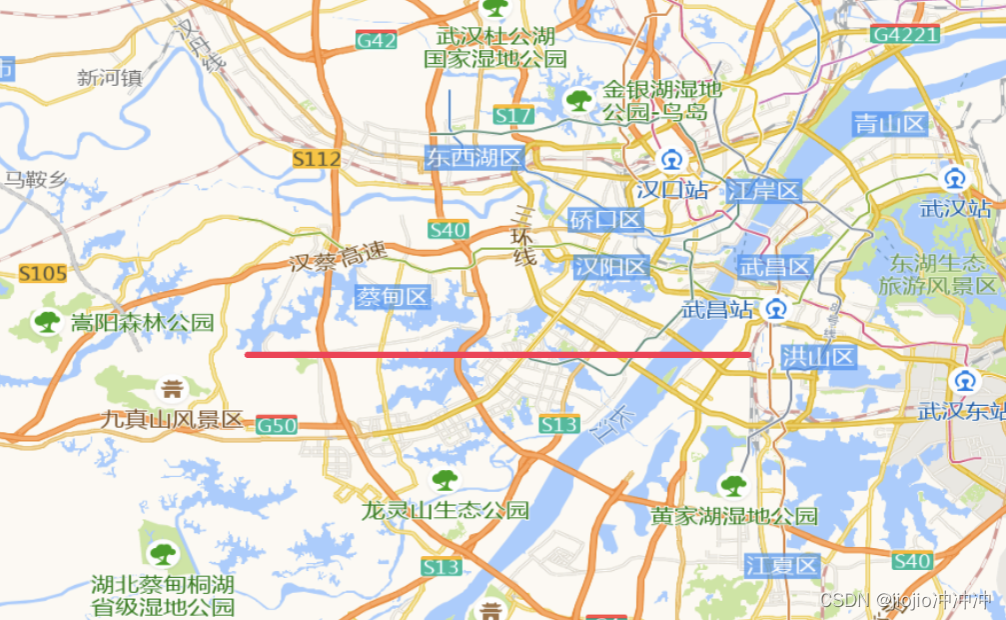
5.2设置线
        var data = {
            type: "FeatureCollection",
            features: [
                // {
                //       type: "Feature",
                //       geometry: {
                //             type: "Point",
                //             coordinates: [114.30, 30.50]
                //       }
                // },
                {
                    type: "Feature",
                    geometry: {
                        type: "LineString",
                        coordinates: [[114.30, 30.50], [114, 30.50]]
                    }
                }
            ]
        }
        var source = new ol.source.Vector({
            /* 2.将geojson数据设置给实例数据源 */
            features: new ol.format.GeoJSON().readFeatures(data)
        })
        var layer = new ol.layer.Vector({
            source
        })
        map.addLayer(layer);
        //设置样式
        const style = new ol.style.Style({
            //边线颜色
            stroke: new ol.style.Stroke({
                color: '#ff2d51',
                width: 4
            })

        })
        layer.setStyle(style);
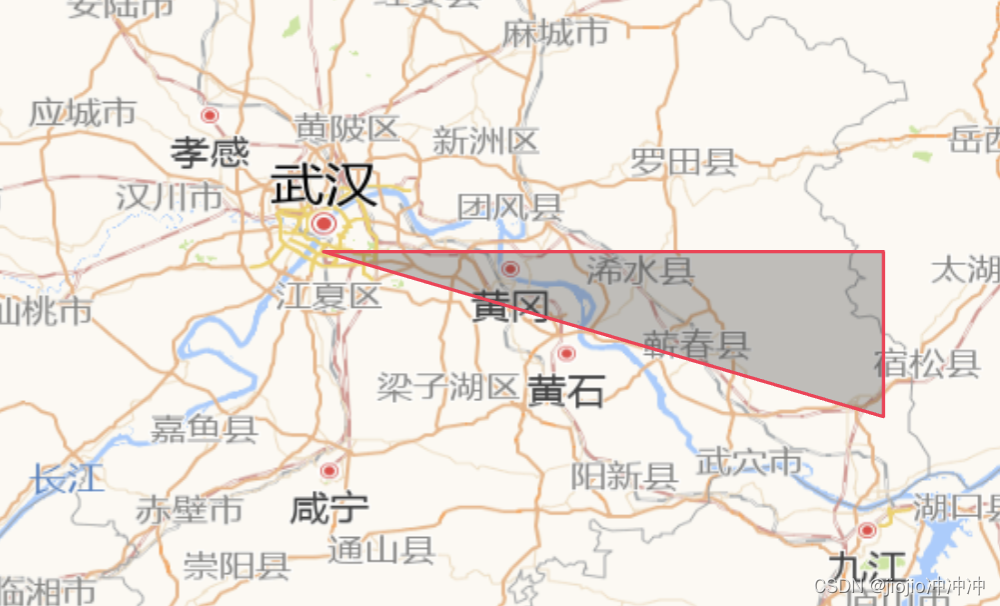
5.3设置Polygon区
       var data = {
            type: "FeatureCollection",
            features: [
                {
                    type: "Feature",
                    geometry: {
                        type: "Polygon",
                        coordinates: [[[114.30, 30.50], [116, 30.50], [116, 30]]]
                    }
                }
            ]
        }
        var source = new ol.source.Vector({
            /* 将geojson数据设置给实例数据源 */
            features: new ol.format.GeoJSON().readFeatures(data)
        })
        var layer = new ol.layer.Vector({
            source
        })
        map.addLayer(layer);
        //设置样式
        const style = new ol.style.Style({
            //边线颜色
            stroke: new ol.style.Stroke({
                color: '#ff2d51',
                width: 2
            }),
            //设置填充色
            fill: new ol.style.Fill({
                color: "rgba(50, 50, 50, 0.3)"
            })

        })
        layer.setStyle(style);
5.4加载本地geojson文件的数据
新建data/map.geojson文件
{
    "type": "FeatureCollection",
    "features": [
        {
            "type": "Feature",
            "geometry": {
                "type": "Point",
                "coordinates": [114.30, 30.50]
            }
        }
    ]
}
//index.html
       const source = new ol.source.Vector({
            url: './data/map.geojson',
            format: new ol.format.GeoJSON()
        })
        const layer = new ol.layer.Vector({
            source
        })
        map.addLayer(layer)
        const style = new ol.style.Style({
            image: new ol.style.Circle({
                radius: 8,
                fill: new ol.style.Fill({
                    color: '#ff2d51'
                }),
                stroke: new ol.style.Stroke({
                    color: '#333',
                    width: 2
                })
            })
        })
        layer.setStyle(style)
5.5加载网络数据
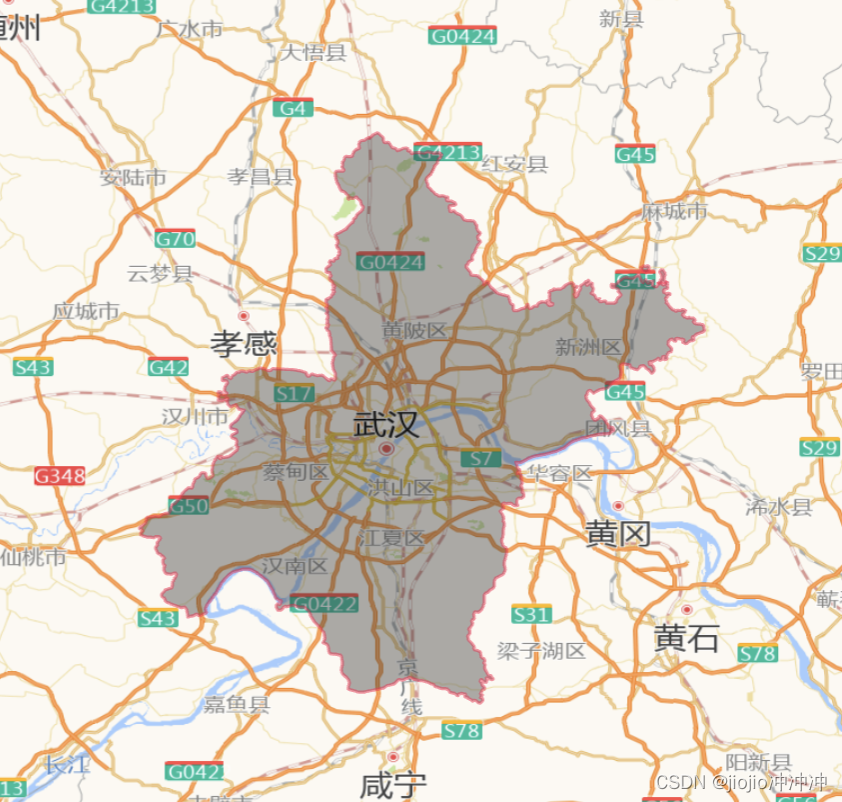
       const source = new ol.source.Vector({
            url: 'https://geo.datav.aliyun.com/areas_v3/bound/geojson?code=420100',
            format: new ol.format.GeoJSON()
        })
        const layer = new ol.layer.Vector({
            source
        })
        map.addLayer(layer)
        const style = new ol.style.Style({
            //填充色
            fill: new ol.style.Fill({
                color: 'rgba(50,50,50,0.4)'
            }),
            //边线颜色
            stroke: new ol.style.Stroke({
                color: '#ff2d5180',
                width: 2
            })
        })
        layer.setStyle(style)
6.地图事件及漫游
6.1地图上设置点
//...初始化地图map
var source = new ol.source.Vector({});
var layer = new ol.layer.Vector({source})
map.addLayer(layer);
map.on("click", (evt) => {
      var position = evt.coordinate;
      var point = new ol.Feature({
            geometry: new ol.geom.Point(position)
      })
      source.addFeature(point)
})
6.2漫游
     map.on("click", (evt) => {
            var position = evt.coordinate;
            map.getView().animate({
                center: position,
                zoom: 10,
                duration: 2000,
            })
        })
6.3复位地图
 .btn {
            position: fixed;
            z-index: 100;
            top: 30px;
            right: 50px;
  }

 <button class="btn">复位地图</button>
 var btn = document.querySelector('.btn')
        btn.onclick = function () {
            map.getView().animate({
                center: [114.30, 30.50],
                zoom: 6,
                duration: 3000
            })
        }
7.canvas绘制
canvas元素的webGL API用于绘制硬件加速的2D和3D图形
7.1绘制矩形
<!-- 1、设置canvas元素-->
<canvas id="canvas" width="200" height="200"></canvas>
<script>
/*2、获取canvas */
const canvas = document.getElementById("canvas");
/*3、getContext()返回一个对象,对象包含绘制图形的方法和属性 */
const ctx = canvas.getcontext("2d");
/*4、执行绘制fillRect(x,y,width,height) x,y*/
ctx.fillRect(10,10,100,208);
ctx.fillStyle="#333"
</script>
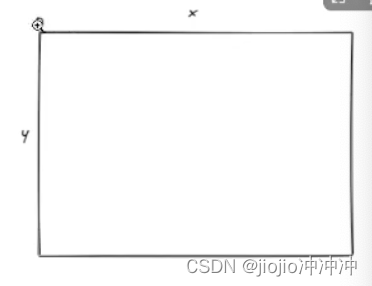
7.2 canvas中的坐标
canvas是一个二维网格
canvas 的左上角坐标为(0,0)
上面的 filRect 方法拥有参数 (0,0,100,100)
意思是:在左上角开始(0,0)的位置,绘制100*100的图形
7.3路径
//设置canvas
<canvas id="canvas" width="200" height="200"></canvas>
<script>
/*2、获取canvas元素 */
const canvas = document.getElementById("canvas");
/*3、获取上下文 */
const ctx = canvas.getContext("2d")!
/*4、moveTo设置起点坐标 */
ctx.moveTo(18,18);
/*5、设置终点坐标 lineTd*/
ctx.lineTo(100,100);
/*6、执行绘制*/
ctx.strokeStyle ="#ff2d51";
ctx.stroke();
</script>
7.4绘制圆
<canvas id="canvas" width="200" height="200"></canvas>
<script>
/*获取canvas画布 */
const canvas = document.getElementById("canvas" )
/*getContext获取绘制对象 */
const ctx = canvas.getContext("2d")!ctx.beginPath();
/* arc(x,y,radius,startAngle,endAngle) */
ctx.beginPath();
ctx.arc(50,50,50,0,Math.PI * 2);
ctx.closePath();
ctx.fillStyle="#333";
ctx.fil1();
ctx.strokeStyle = "#ff2d51";
ctx.stroke();
</script>
7.4绘制多个圆
<!DOCTYPE html>
    <html lang="en">
    <head>
        <meta charset="UTF-8">
        <meta http-equiv="x-UA-Compatible" content="IE=edge">
        <meta name="viewport" content="width=device-width, initial-scale=1.0">
        <title>Document</title>
    </head>
    <body>
        <canvas id="canvas" width="400" height="400"></canvas>
        <script>
            /*100 50*/
            const canvas = document.getElementById("canvas");
            const ctx = canvas.getContext("2d");
            /*第一个圆 */
            ctx.beginPath();
            ctx.arc(200, 200, 100, 0, Math.PI * 2);
            ctx.closePath();
            ctx.fillStyle = "#ff2d51";
            ctx.fill()
            /*第二个圆 */
            ctx.beginPath();
            ctx.arc(200, 200, 50, 0, Math.PI * 2);
            ctx.closePath();
            ctx.fillStyle = "#333";
            ctx.fill()
        </script>
    </body>
    </html>
7.5绘制动画圆
<!DOCTYPE html>
    <html lang="en">
    <head>
        <meta charset="UTF-8">
        <meta http-equiv="X-UA-Compatible" content="IE=edge">
        <meta name="viewport" content="width=device-width, initial-scale=1.0">
        <title>Document</title>
    </head>

    <body>
        <canvas id="canvas" width="200" height="200"></canvas>
        <script>
            //center = [100,100];radius =50;var radius = 50;
            var radius = 50;//半径
            var increase = true;//是否放大
            //radius<50 true radius>100 false true++ false--
            /*获取画布 */
            const canvas = document.getElementById("canvas");
            const ctx = canvas.getContext("2d");
            function draw() {
               //清楚给定矩形内的形状
                ctx.clearRect(0,0,canvas.width,canvas.height)
                ctx.beginPath();
                ctx.arc(100, 100, radius, 0, Math.PI * 2);
                ctx.closePath();
                ctx.fillStyle = "#6528e0";
                ctx.fill();
                if (radius > 100) {
                    increase = false;
                } else if (radius < 50) {
                    increase = true;
                }
                if (increase) {
                    radius++
                } else {
                    radius--
                }
            }
            setInterval(draw, 20)
            draw()
        </script>
    </body>
    </html>
7.6多圈动画
<!DOCTYPE html>
    <html lang="en">
    <head>
        <meta charset="UTF-8">
        <meta http-equiv="X-UA-Compatible" content="IE=edge">
        <meta name="viewport" content="width=device-width, initial-scale=1.0">
        <title>Document</title>
    </head>

    <body>
        <canvas id="canvas" width="200" height="200"></canvas>
        <script>
            //center = [100,100];radius =50;var radius = 50;
            var radius = 100;//半径
            var increase = true;//是否放大
            //radius<50 true radius>100 false true++ false--
            /*获取画布 */
            const canvas = document.getElementById("canvas");
            const ctx = canvas.getContext("2d");
            function draw() {
                //清楚给定矩形内的形状
                ctx.clearRect(0,0,canvas.width,canvas.height)
                //设置第一个圆
                ctx.beginPath();
                ctx.arc(100, 100, radius, 0, Math.PI * 2);
                ctx.closePath();
                ctx.fillStyle = "#ff2d51";
                ctx.fill();
                //设置第二个圆
                ctx.beginPath();
                ctx.arc(100, 100, 50, 0, Math.PI * 2);
                ctx.closePath();
                ctx.fillStyle = "#0088ff";
                ctx.fill();
                if (radius > 100) {
                    increase = false;
                } else if (radius < 50) {
                    increase = true;
                }
                if (increase) {
                    radius++
                } else {
                    radius--
                }
            }
            setInterval(draw, 20)
            draw()
        </script>
    </body>
    </html>


 1094
1094

 被折叠的 条评论
为什么被折叠?
被折叠的 条评论
为什么被折叠?
 到【灌水乐园】发言


