


一、Time Surfaces(时间曲面)
用来描述一个事件周围的局部时空模式
原文:“the concept of time surface is introduced to describe local spatio-temporal patterns around an event”
时间表面的公式化表示:

ρ是空间邻域半径
具体的时间表面是一个分段函数:
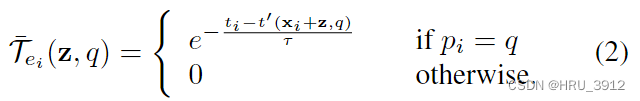
看图
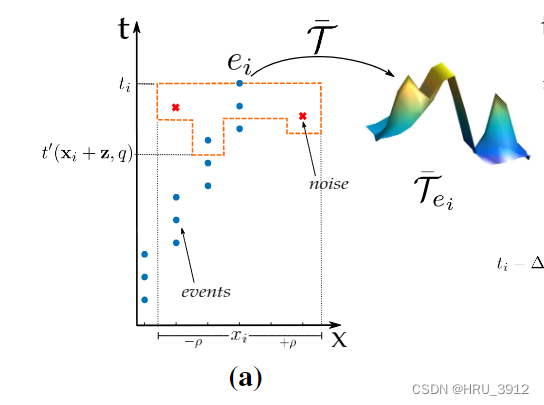
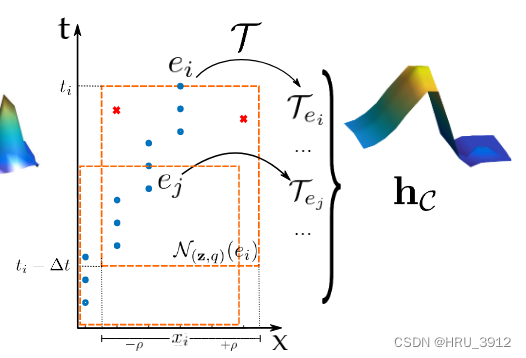
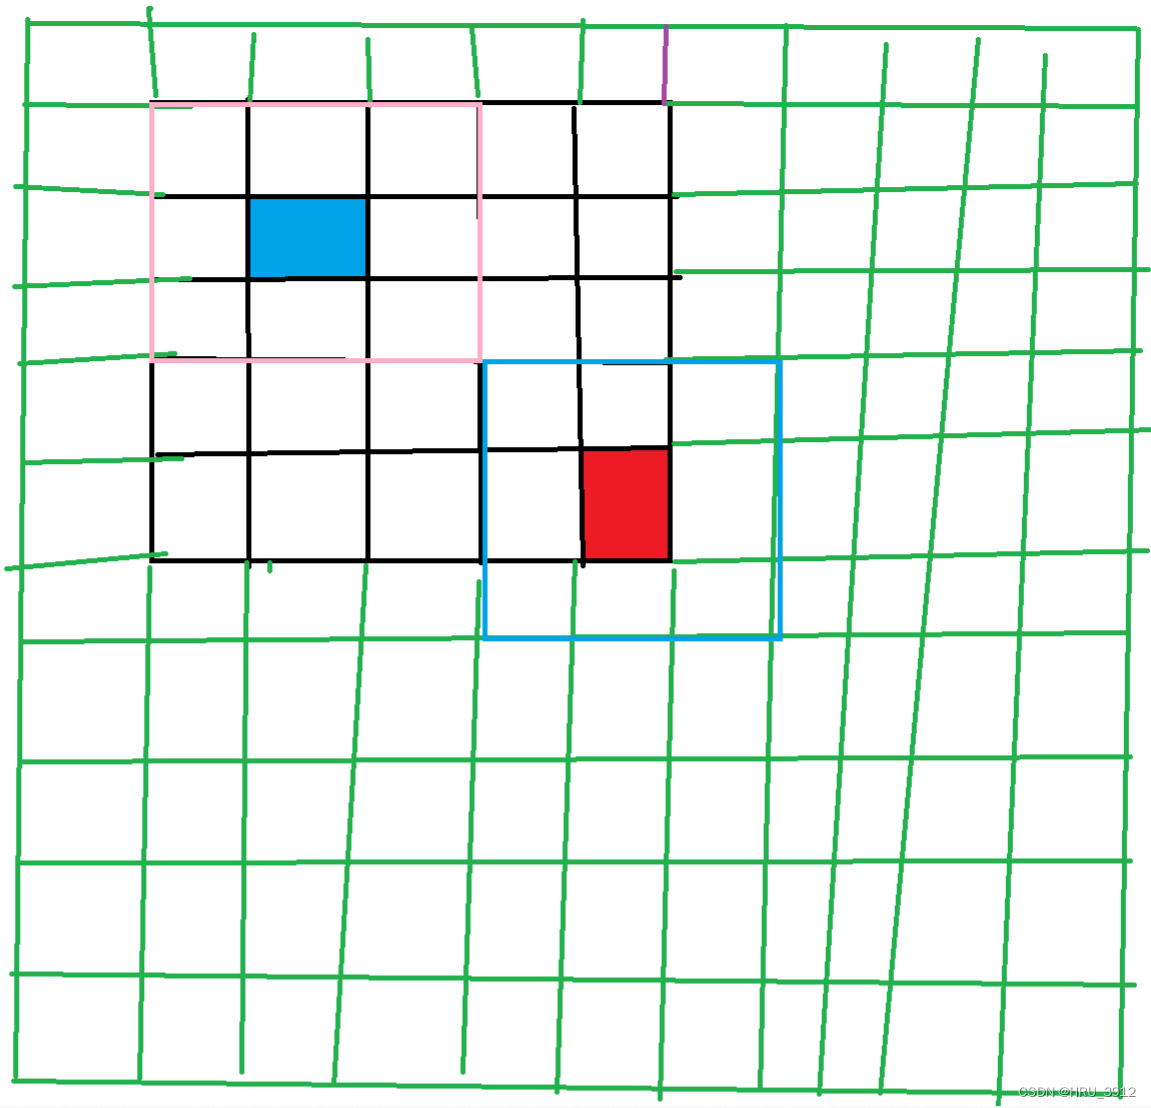
比如下图中xi=(0,0),我一开始疑惑为什么二维坐标在一个坐标轴上表示,实际上是将左右的二维坐标穷举在一维坐标轴上了。
假设ρ=2,那么所有的[−ρ, ρ]2包括:(-2,-2) (-2,-1) (-2,0) (-2,1) (-2,2) (-1,-2) (-1,-1) (-1,0) (-1,1) (-1,2) (0,-2) (0,-1) (0,0) (0,1) (0,2) (1,-2) (1,-1) (1,0) (1,1) (1,2) (2,-2) (2,-1) (2,0) (2,1) (2,2)总共25个。
如果说把这25个二维坐标包括xi映射为某个整数,那么就投影在一维上了。
从这么多[−ρ, ρ]2选取和原始事件数据极性相同的坐标,获得和它时间差距最大的事件的t,代入公式(2)。如下图所示,橙色框框框住的就是在划定的ei的空间邻域内核ei极性相同的事件。τ是一个衰减因子,一个常数。对每个事件ei计算(2)的函数值,画图就形成了三维曲面图。
注意,整个坐标轴是它的邻域,橙色框只是从邻域中选取的符合要求的点,比如这节中的要求是极性相同。
为什么设计这么个时间表面?
考虑了事件周围的时间和空间信息。
论文说:这样噪声的分量就会很大(不是很理解),我的理解是噪声和所有和它极性相同的事件的函数值是一样的了,橙色框部分,因为最小的t选的都是一样的。
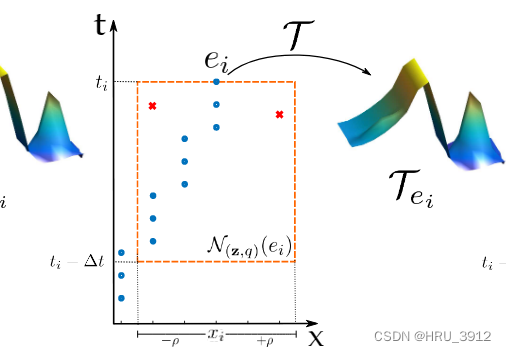
二、局部记忆时间曲面
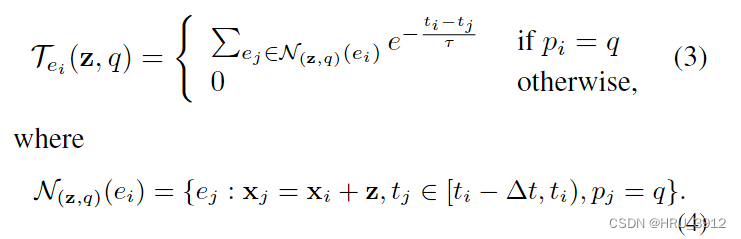
这次不选极性相同的了,橙色框中可能包含不相同的极性,但是,计算时,它的做法仍然是选取框中和ei极性相同的事件对应的t进行函数值的计算,不相同的极性不计入函数值的计算内。如果▲t框住的范围包含所有极性相同的事件,那么节二和节一的区别就在于一个取t的最小值,一个取所有t的值求和。
三、平均时间曲面直方图
3.1
3.2局部记忆平均单元
这块相当于二,但是在取邻域时,范围做了限制
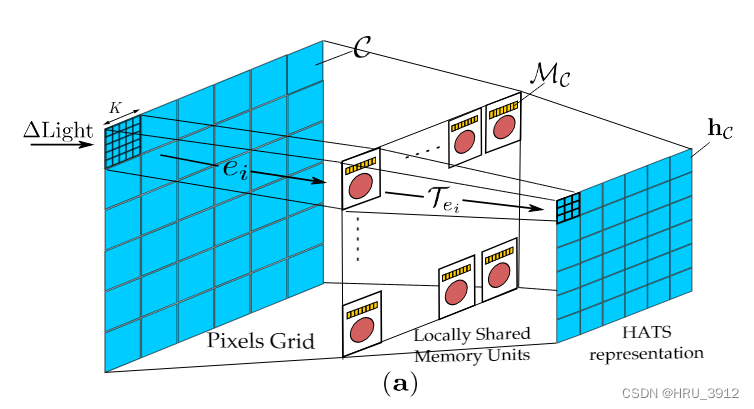
假设事件序列记录的事件是0~5s,如上图所示,将像素空间分为L个块,每块的像素个数是K*K。在这段时间内记录到的事件总个数假设是1000个,注意,总体来看,每个像素位置发生的事件个数都是不一的。事件序列按照时间排序,时间相同的按照坐标排序(先x后y)。
- 然后我们来看一个cell(块),统计发生在这个块内所有坐标的事件,比如说可能总共有20个,按照时间先后排,按照公式(3)计算每个事件τei。重点来了,由于它是按照时间排序计算的,比如说在这个块内有t=0的事件,它计算的(3)只会等于1或者0,因为t不可能是负数,只能选到t也是等于0的,要么就没得选。
- 看图,当前事件只会考虑之前事件,并且由于算法第6行的做法,当前事件只会考虑当前块内的“之前事件”,这就是和二的不同了,二的橙色框是从邻域内所有点框选的,现在,它选不到邻域内所有点,只会考虑在框内的(当ρ不是那么小的时候),然后框时间范围。下图加以理解:
我们看红色像素,假设ρ=K=5,它的邻域包好整个绿色框住的部分,但是它只会考虑黑色框中的部分。
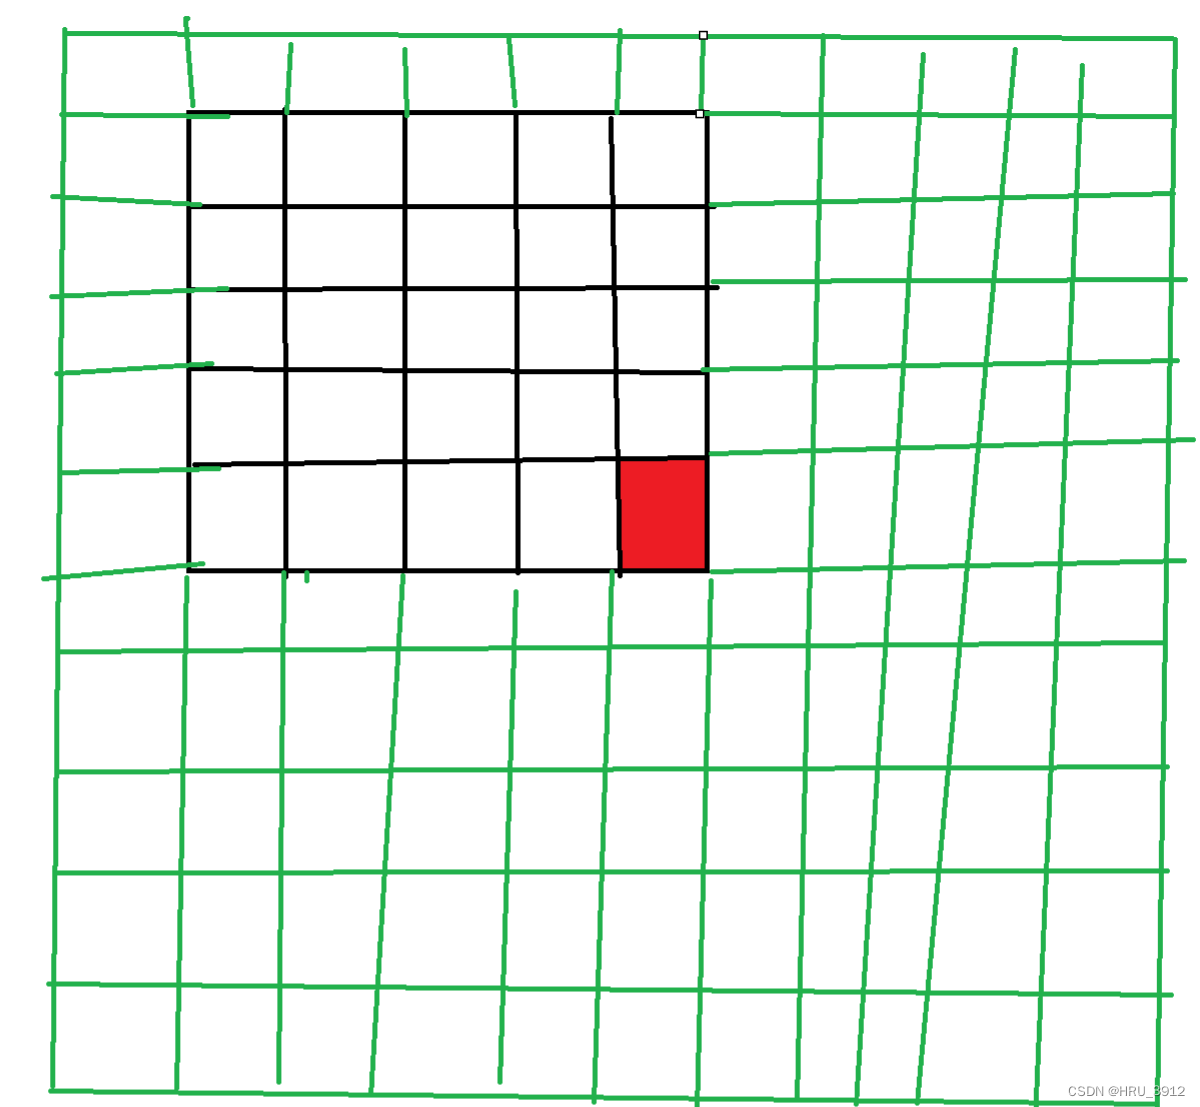
- 除此之外,还应该注意到每个像素位置的事件可能不止一个,虽然位置相同,候选的邻域的像素位置相同,但是由于时间不同,真正用于计算的有效事件是不一样的。
- 但是邻域的范围对块中每个像素来说都是一样的K*K,因为ρ比较大,如果ρ较小,比如说是1,那么如下图所示,蓝色像素和红色像素的邻域包含的是不同的像素。
- 最后,以cell为单位,计算的一个块内的所有事件的(3),然后累加取平均,也就是一个块最终只会得出一个代表值,随L个块进行这样的计算,得出L个值,然后concat起来,拼成一个向量,这个向量中的每个元素值相当于三维坐标中的z值,块内每个二维坐标的z值都相同,所以画出图就是三维直方图,这就是名字中直方图的由来。可以看下图,它的变化是平的。

--------------------------------------------------------code部分--------------------------------------------------------
一、数据集
用的是tomic包中,datasets模块下的MNIST函数
FILTER_TIME=1e4
ds_tr, ds_ts = tonic.datasets.NMNIST(save_to="./data_tr", transform=Denoise(filter_time=FILTER_TIME), train=True), tonic.datasets.NMNIST(save_to="./data_ts", transform=Denoise(filter_time=FILTER_TIME), train=False)
这个Denoise函数也是tonic包中国的内置函数,从原始事件序列中过滤出一些事件。
规则是这样的:对某个事件,如果在空间1像素的邻域内并且filter_time的时间邻域内没有事件记录,那么就判定这个事件是孤立的,要舍弃。
def denoise_numpy(events, filter_time=10000):
    """Drops events that are 'not sufficiently connected to other events in the recording.' In
    practise that means that an event is dropped if no other event occured within a spatial
    neighbourhood of 1 pixel and a temporal neighbourhood of filter_time time units. Useful to
    filter noisy recordings where events occur isolated in time.

    Parameters:
        events: ndarray of shape [num_events, num_event_channels]
        filter_time: maximum temporal distance to next event, otherwise dropped.
                    Lower values will mean higher constraints, therefore less events.

    Returns:
        filtered set of events.
    """

    assert "x" and "y" and "t" in events.dtype.names

    events_copy = np.zeros_like(events)
    copy_index = 0
    width = int(events["x"].max()) + 1
    height = int(events["y"].max()) + 1
    timestamp_memory = np.zeros((width, height)) + filter_time

    for event in events:
        x = int(event["x"])
        y = int(event["y"])
        t = event["t"]
        timestamp_memory[x, y] = t + filter_time
        if (
            (x > 0 and timestamp_memory[x - 1, y] > t)
            or (x < width - 1 and timestamp_memory[x + 1, y] > t)
            or (y > 0 and timestamp_memory[x, y - 1] > t)
            or (y < height - 1 and timestamp_memory[x, y + 1] > t)
        ):
            events_copy[copy_index] = event
            copy_index += 1

    return events_copy[:copy_index]
为什么判断条件是大于t,我不是很理解
N-mnist数据集的一个属性ds_tr.sensor_size,结果是(34,34,2)
我们还可以看看数据集的其他属性,以便更了解这个数据集
print('数据集中事件序列的总数是:',len(ds_tr))
print('第一个事件序列:',ds_tr[0])
print('第二个事件序列:',ds_tr[1])
可以看到,直接用[]整数索引得出的就是一个一个序列数据,每个序列包含(x,y,t,p)四列数据
数据集中事件序列的总数是: 60000
第一个事件序列: (array([(10, 30, 937, 1)],
      dtype=[('x', '<i4'), ('y', '<i4'), ('t', '<i4'), ('p', '<i4')]), 0)
第二个事件序列: (array([(7, 22, 2463, 0)],
      dtype=[('x', '<i4'), ('y', '<i4'), ('t', '<i4'), ('p', '<i4')]), 0)
看下时间戳的情况:
max_t=-100000
min_t=100000
mean_t=0
sum=0
for event in ds_tr:
    if len(event[0]) !=0:
        if event[0][0][2]>max_t:
            max_t=event[0][0][2]
        if event[0][0][2]<min_t:
            min_t=event[0][0][2]
        sum+=event[0][0][2]
mean_t=sum/60000.
print('max_t:',max_t)
print('min_t:',min_t)
print('mean_t:',mean_t)
max_t: 9910
min_t: 0
mean_t: 1161.7906166666667
可以看到*ds_tr[0]解析出来的情况
print(*ds_tr[0])
[(10, 30, 937, 1)] 0
二、事件序列数据编码
HATS_wrapper = lambda events, label: (hats_encoder.get_histogram(events), label)
hist_shape = HATS_wrapper(*ds_tr[0])[0].shape

hats_encoder = HATS(sensor_size=ds_tr.sensor_size, cell_size=cell_size, surface_size=surface_size, tw=temporal_window, tau=tau)
    def __init__(self, sensor_size, tau, tw, cell_size, surface_size):
        self._w, self._h, self._npols = sensor_size #_w=34,_h=34,_npols=2
        self._tau, self._tw = np.array(tau, dtype=np.float32), np.array(tw, dtype=np.float32)#_tau=1e11 _tw=1e5
        self._cdim, self._sdim = cell_size, surface_size#_cdim=5 _sdim=5
        # Radius of the time surface.
        self._rho = surface_size//2#_rho=2
        # Number of cell along the horizontal and vertical axes, respectively.
        self._hgrid, self._wgrid = ceil(self._h/self._cdim), ceil(self._w/self._cdim)#_hgrid=6 _wgrid=6
        # Total number of cells.
        self._ncells = self._hgrid*self._wgrid#_ncells=36
        # Local memories to which the events are mapped.
        self._gen_locmems = lambda: [[[] for p in range(self._npols)] for c in range(self._ncells)]#[[], []]*36个
        # Mapping matrix used to obtain the index of the cell to which an event belongs, given its coordinates.
        self._px_to_cell = np.array([[(y//self._cdim)*self._wgrid + x//self._cdim for x in range(self._w)] for y in range(self._h)], dtype=np.int32)
_px_to_cell是这么个东西,形状是(34,34)
这个东西看起来就是个二维矩阵,但是它蕴含了块位置信息,相当于一个索引表,给我像素的坐标,就能根据这张表知道它所在块的编号。
[[ 0  0  0  0  0  1  1  1  1  1  2  2  2  2  2  3  3  3  3  3  4  4  4  4
   4  5  5  5  5  5  6  6  6  6]
 [ 0  0  0  0  0  1  1  1  1  1  2  2  2  2  2  3  3  3  3  3  4  4  4  4
   4  5  5  5  5  5  6  6  6  6]
 [ 0  0  0  0  0  1  1  1  1  1  2  2  2  2  2  3  3  3  3  3  4  4  4  4
   4  5  5  5  5  5  6  6  6  6]
 [ 0  0  0  0  0  1  1  1  1  1  2  2  2  2  2  3  3  3  3  3  4  4  4  4
   4  5  5  5  5  5  6  6  6  6]
 [ 0  0  0  0  0  1  1  1  1  1  2  2  2  2  2  3  3  3  3  3  4  4  4  4
   4  5  5  5  5  5  6  6  6  6]
 [ 6  6  6  6  6  7  7  7  7  7  8  8  8  8  8  9  9  9  9  9 10 10 10 10
  10 11 11 11 11 11 12 12 12 12]
 [ 6  6  6  6  6  7  7  7  7  7  8  8  8  8  8  9  9  9  9  9 10 10 10 10
  10 11 11 11 11 11 12 12 12 12]
 [ 6  6  6  6  6  7  7  7  7  7  8  8  8  8  8  9  9  9  9  9 10 10 10 10
  10 11 11 11 11 11 12 12 12 12]
 [ 6  6  6  6  6  7  7  7  7  7  8  8  8  8  8  9  9  9  9  9 10 10 10 10
  10 11 11 11 11 11 12 12 12 12]
 [ 6  6  6  6  6  7  7  7  7  7  8  8  8  8  8  9  9  9  9  9 10 10 10 10
  10 11 11 11 11 11 12 12 12 12]
 [12 12 12 12 12 13 13 13 13 13 14 14 14 14 14 15 15 15 15 15 16 16 16 16
  16 17 17 17 17 17 18 18 18 18]
 [12 12 12 12 12 13 13 13 13 13 14 14 14 14 14 15 15 15 15 15 16 16 16 16
  16 17 17 17 17 17 18 18 18 18]
 [12 12 12 12 12 13 13 13 13 13 14 14 14 14 14 15 15 15 15 15 16 16 16 16
  16 17 17 17 17 17 18 18 18 18]
 [12 12 12 12 12 13 13 13 13 13 14 14 14 14 14 15 15 15 15 15 16 16 16 16
  16 17 17 17 17 17 18 18 18 18]
 [12 12 12 12 12 13 13 13 13 13 14 14 14 14 14 15 15 15 15 15 16 16 16 16
  16 17 17 17 17 17 18 18 18 18]
 [18 18 18 18 18 19 19 19 19 19 20 20 20 20 20 21 21 21 21 21 22 22 22 22
  22 23 23 23 23 23 24 24 24 24]
 [18 18 18 18 18 19 19 19 19 19 20 20 20 20 20 21 21 21 21 21 22 22 22 22
  22 23 23 23 23 23 24 24 24 24]
 [18 18 18 18 18 19 19 19 19 19 20 20 20 20 20 21 21 21 21 21 22 22 22 22
  22 23 23 23 23 23 24 24 24 24]
 [18 18 18 18 18 19 19 19 19 19 20 20 20 20 20 21 21 21 21 21 22 22 22 22
  22 23 23 23 23 23 24 24 24 24]
 [18 18 18 18 18 19 19 19 19 19 20 20 20 20 20 21 21 21 21 21 22 22 22 22
  22 23 23 23 23 23 24 24 24 24]
 [24 24 24 24 24 25 25 25 25 25 26 26 26 26 26 27 27 27 27 27 28 28 28 28
  28 29 29 29 29 29 30 30 30 30]
 [24 24 24 24 24 25 25 25 25 25 26 26 26 26 26 27 27 27 27 27 28 28 28 28
  28 29 29 29 29 29 30 30 30 30]
 [24 24 24 24 24 25 25 25 25 25 26 26 26 26 26 27 27 27 27 27 28 28 28 28
  28 29 29 29 29 29 30 30 30 30]
 [24 24 24 24 24 25 25 25 25 25 26 26 26 26 26 27 27 27 27 27 28 28 28 28
  28 29 29 29 29 29 30 30 30 30]
 [24 24 24 24 24 25 25 25 25 25 26 26 26 26 26 27 27 27 27 27 28 28 28 28
  28 29 29 29 29 29 30 30 30 30]
 [30 30 30 30 30 31 31 31 31 31 32 32 32 32 32 33 33 33 33 33 34 34 34 34
  34 35 35 35 35 35 36 36 36 36]
 [30 30 30 30 30 31 31 31 31 31 32 32 32 32 32 33 33 33 33 33 34 34 34 34
  34 35 35 35 35 35 36 36 36 36]
 [30 30 30 30 30 31 31 31 31 31 32 32 32 32 32 33 33 33 33 33 34 34 34 34
  34 35 35 35 35 35 36 36 36 36]
 [30 30 30 30 30 31 31 31 31 31 32 32 32 32 32 33 33 33 33 33 34 34 34 34
  34 35 35 35 35 35 36 36 36 36]
 [30 30 30 30 30 31 31 31 31 31 32 32 32 32 32 33 33 33 33 33 34 34 34 34
  34 35 35 35 35 35 36 36 36 36]
 [36 36 36 36 36 37 37 37 37 37 38 38 38 38 38 39 39 39 39 39 40 40 40 40
  40 41 41 41 41 41 42 42 42 42]
 [36 36 36 36 36 37 37 37 37 37 38 38 38 38 38 39 39 39 39 39 40 40 40 40
  40 41 41 41 41 41 42 42 42 42]
 [36 36 36 36 36 37 37 37 37 37 38 38 38 38 38 39 39 39 39 39 40 40 40 40
  40 41 41 41 41 41 42 42 42 42]
 [36 36 36 36 36 37 37 37 37 37 38 38 38 38 38 39 39 39 39 39 40 40 40 40
  40 41 41 41 41 41 42 42 42 42]]
    def get_histogram(self, events):
        # Organizing the events in cells which are, then, saved as NumPy arrays.
        locmems = self._map_to_locmems(events)
        hist = np.zeros((self._ncells, self._npols, self._sdim, self._sdim), dtype=np.float32)#hist = np.zeros((36, 2,
        5, 5), dtype=np.float32)这么理解,每个框的大小是5*5,一个事件分成了6*6=36个块,一个事件有两个通道
        # Now we have fun: we cycle on the local memories and generate the histogram corresponding to each of them.
        for c in range(self._ncells):#36
            for p in range(self._npols):#2
                hist[c,p,:,:] = np.sum(
                    np.stack(
                        [self._get_ts(locmems[c][p][i], locmems[c][p][:i]) for i in range(len(locmems[c][p]))]
                        if locmems[c][p].size>0
                        else
                        np.zeros((self._sdim, self._sdim), dtype=np.float32)#np.zeros(5,5)
                    ),
                    axis=0
                )/max(1, locmems[c][p].size)
        return hist
     def _map_to_locmems(self, events):
        locmems = self._gen_locmems()#[[], []]*36个
        # Mapping events to local memories.
        for event in events:
            locmems[self._px_to_cell[int(event['y']), int(event['x'])]][max(0, int(event['p']))].append(event)
        # Converting the lists in structured NumPy arrays.
        locmems = [[np.stack(locmems[c][p]) if locmems[c][p] else np.empty((0,)) for p in range(self._npols)] for c in
        range(self._ncells)]#更新有些array可能已经不是空的了,就是事件
        return locmems
这里的locmems就是初始化中的匿名函数,但是由于这个函数没有定义参数,所以是变量还是函数都无所谓。
self._px_to_cell[int(event[‘y’]), int(event[‘x’])]这步就是获得所在块的编号,locmems[self._px_to_cell[int(event[‘y’]), int(event[‘x’])]]这个就是根据编号获得相应的一个[[], []],将事件极性为1的放入第二个框,极性为-1的放入第一个框。
现在我们想象来了一个事件,(7,3,10,1)根据像素坐标(7,3)经过映射表映射它来自第二(编号为1)个块,这里还要说明下,块的排序是按照竖着来的,于是更新locmems变成[[],[]] [[(7,3,10,1)],[]] [[],[]] [[],[]]…[[],[]]
三、生成直方图
    def _get_ts(self, event, locmem):
        t_i, t_j = event['t'].astype(np.float32), locmem['t'].astype(np.float32)
        # Starting time stamp, calculated subtracting the time window from the event timestamp.
        t_start = max(0, t_i-self._tw)
        # Relative coordinates in the time surfaces.
        ts_x, ts_y = locmem['x'] - event['x'], locmem['y'] - event['y']
        # Including only the events in the neighbourhood and in the time window.
        mask = np.asarray((np.abs(ts_x)<=self._rho) & (np.abs(ts_y)<=self._rho) & (t_j>=t_start)).nonzero()[0]
        # For each event in the local memory that belongs to the spatial and temporal windows and for the current
        event, a time surface is generated.
        locmem_ts = np.zeros((1+len(mask), self._sdim, self._sdim), dtype=np.float32)
        if len(mask)>0:
            locmem_ts[np.arange(len(mask)), ts_y[mask]+self._rho, ts_x[mask]+self._rho] = np.exp(-(t_i-
            t_j[mask])/self._tau)
        # Adding the current event time surface.
        locmem_ts[-1, self._rho, self._rho] += 1
        # The accumulated time surfaces are returned.
        return np.sum(locmem_ts, axis=0)
题外话:我发现一个神奇的地方,上面如果不转成np.array而是用list的话,虽然二者的表现方式都是:[(10, 30, 937, 1), (7, 22, 2463, 0)],但是arry可以用加载数据上的标签访问,比如t,array的情况下会返回[937,2463],list会报错。
参数event, locmem分别如下:
索引c和p分别定位块号和极性
locmems[c][p][i], locmems[c][p][:i]


 280
280

 被折叠的 条评论
为什么被折叠?
被折叠的 条评论
为什么被折叠?
 到【灌水乐园】发言


