option = {
title: {
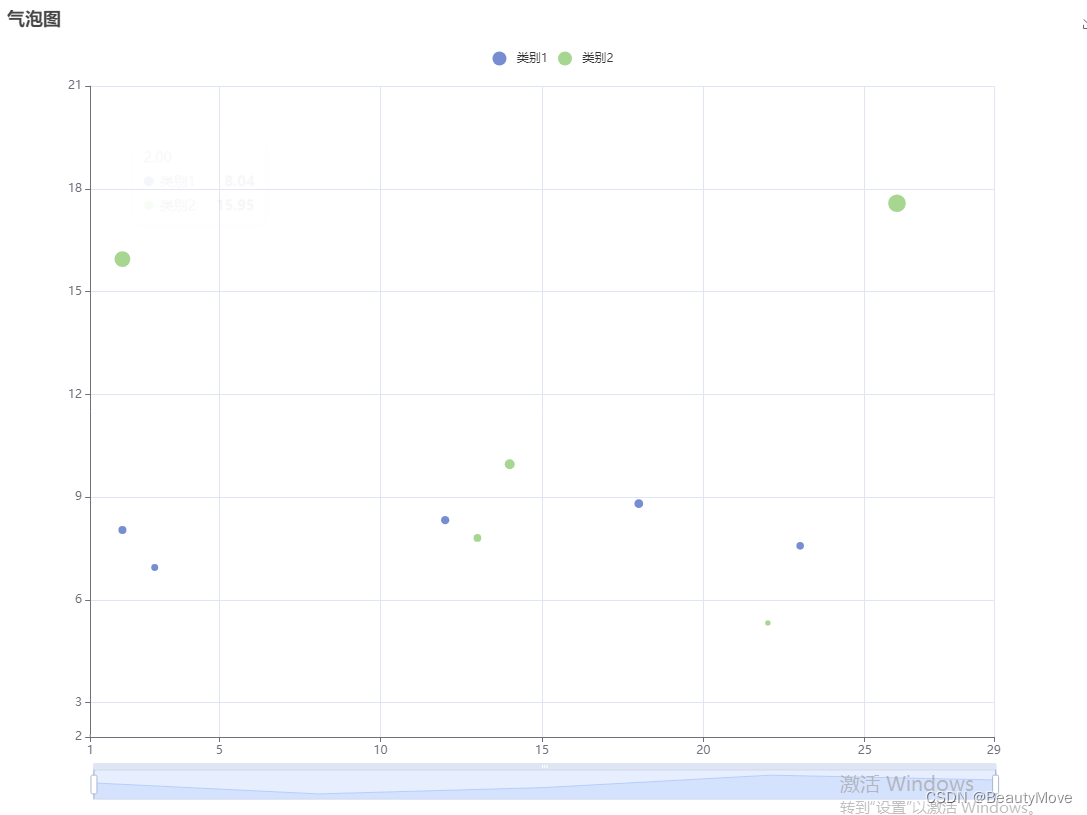
text: '气泡图'
},
legend: {
type: 'scroll',
top: '5%',
left: 'center'
},
grid: {
left: '8%',
top: '10%'
},
toolbox: {
feature: {
saveAsImage: { show: true }
}
},
tooltip: {
trigger: 'axis',
axisPointer: {
type: 'cross'
}
},
dataZoom: [
{
id: 'dataZoomX',
type: 'slider',
XAxisIndex: [0],
filterMode: 'empty'
}
],
xAxis: {
min: function (value) {
if(value.min >3){
return Math.floor(value.min-3);
}else {
return Math.floor(value.min);
}
},
max: function (value) {
return Math.ceil(value.max+3);
}},
yAxis: {
min: function (value) {
if(value.min >3){
return Math.floor(value.min-3);
}else {
return Math.floor(value.min);
}
},
max: function (value) {
return Math.ceil(value.max+3);
}
},
series: [
{
name: '类别1',
data: [
[2.0, 8.04, 10],
[3.0, 6.95, 20],
[23.0, 7.58, 30],
[18.0, 8.81, 15],
[12.0, 8.33, 16]
],
symbolSize: function (data) {
return data[1];
},
type: 'scatter'
},
{
name: '类别2',
data: [
[1.0, 2.04],
[2.0, 15.95],
[26.0, 17.58],
[13.0, 7.81],
[22.0, 5.33],
[14.0, 9.96]
],
symbolSize: function (data) {
return data[1];
},
type: 'scatter'
}
]
}


 1万+
1万+


 被折叠的 条评论
为什么被折叠?
被折叠的 条评论
为什么被折叠?
 到【灌水乐园】发言


