效果图:
代码如下:
option = {
title: {
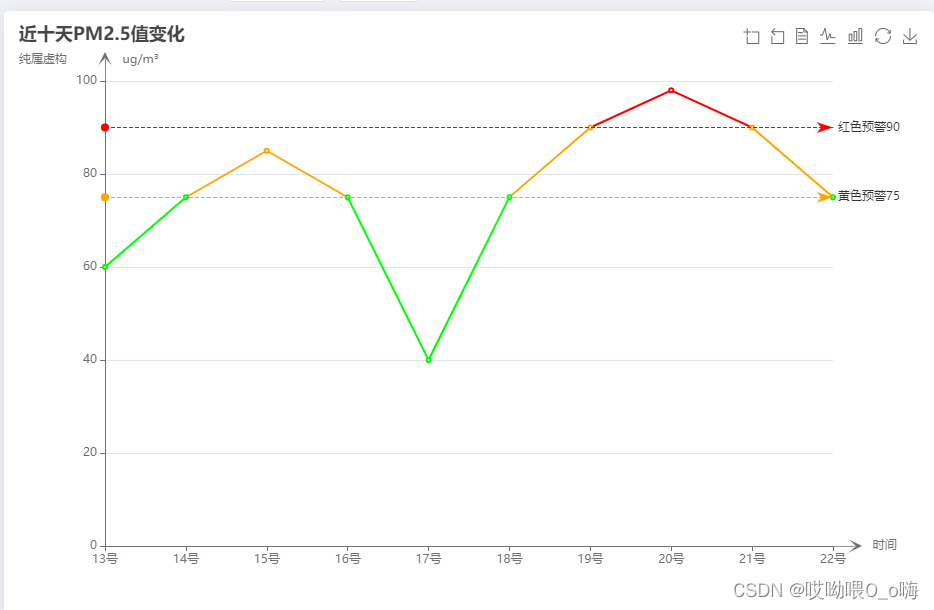
text: '近十天PM2.5值变化',
subtext: '纯属虚构'
},
tooltip: {
trigger: 'axis',
formatter:function(params)
{
var relVal = params[0].name;
for (var i = 0, l = params.length; i < l; i++) {
relVal += '<br/>' +params[i].marker+ params[i].seriesName+':'+params[i].value +'ug/m³';
}
return relVal;
}
},
toolbox: {
show: true,
feature: {
dataZoom: {
yAxisIndex: 'none'
},
dataView: {readOnly: false},
magicType: {type: ['line', 'bar']},
restore: {},
saveAsImage: {}
}
},
xAxis: {
name:'\t\t\t\t\t\t\t时间',
type: 'category',
boundaryGap: false,
symbol: ['none', 'arrow'],
axisLine: {
show:true,
symbol: ['none', 'path://M5, 20 L5, 5 L8, 8 L5, 2 L2, 8 L5, 5 L5.3, 6 L5.3,20'],
symbolOffset: 10,
symbolSize: [35, 38]
},
data: ['13号', '14号', '15号', '16号', '17号', '18号', '19号','20号','21号','22号']
},
yAxis: {
name:'\t\t\t\t\t\t\t\t\t\t\t\t\t\t\t\t\t\t\t\tug/m³',
type:'value',
axisLine: {
show:true,
symbol: ['none', 'path://M5, 20 L5, 5 L8, 8 L5, 2 L2, 8 L5, 5 L5.3, 6 L5.3,20'],
symbolOffset: 10,
symbolSize: [35, 38]
},
axisTick: {show:true},
axisLabel: {
formatter: '{value}',
symbol: ['none','arrow'],
}
},
visualMap: {
show: false,
pieces:[
{
lte: 75,
color: "#00ff00"
},
{
gt: 75,
lte: 90,
color: "orange"
},
{
gt: 90,
color: "#ff0000"
}
]
},
series: [
{
name: 'PM2.5',
type: 'line',
data: [60, 75,85,75,40,75,90,98,90, 75],
markLine: {
itemStyle: {
normal: {
lineStyle: {
type: 'dashed',
},
label: {
show: true,
position: 'end',
formatter: '{b}{c}',
}
},
},
data: [
{
name: '红色预警',
type: 'average',
yAxis: 90,
lineStyle: {
color: '#ff0000'
}
},
{
name: '黄色预警',
type: 'average',
yAxis: 75,
lineStyle: {
color: 'orange'
}
}
]
},
}
],
};


 这篇博客展示了近十天PM2.5值的变化情况,通过一张详细的数据图表进行说明。图表包括了不同级别的空气质量预警,如红色预警和黄色预警的平均值,并使用了折线图来直观展示数据。此外,还配置了视觉映射,根据PM2.5数值范围显示不同的颜色。内容涵盖了数据可视化、环境监测和信息图形设计。


 761
761

 被折叠的 条评论
为什么被折叠?
被折叠的 条评论
为什么被折叠?
 到【灌水乐园】发言


