


全部集合案例:
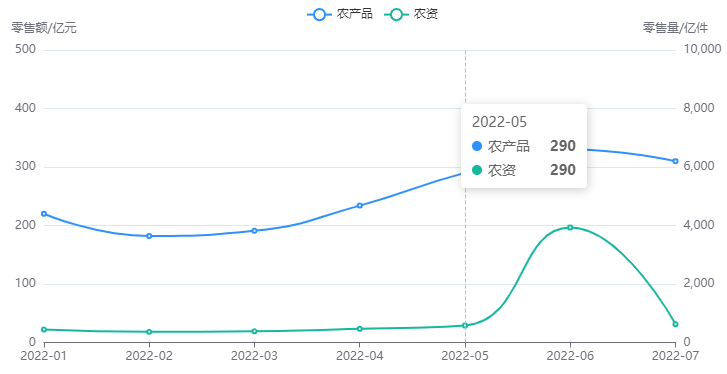
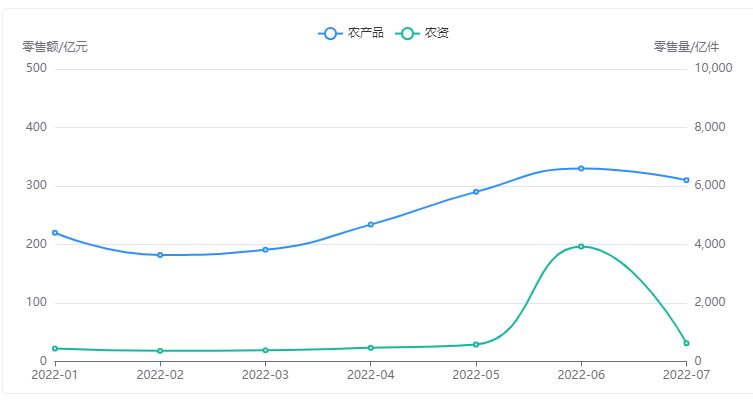
一、折线图
完整代码:
<div id="main"></div>

const echarts = require("echarts");

data(){
myChart: null,
}

  mounted() {
    this.echartsInit();
    window.addEventListener("resize", () => {
      this.myChart.resize();
    });
  },

 methods: {
    echartsInit() {
      var chartDom = document.getElementById("main");
      this.myChart = echarts.init(chartDom);
      var option;

      option = {
        // title: {
        //   text: "Stacked Line",
        // },
        tooltip: {
          trigger: "axis",
        },
        legend: {
          data: ["农产品", "农资"],
          padding: [18, 0, 0, 0],
        },
        grid: {
          left: "3%",
          right: "4%",
          bottom: "3%",

          containLabel: true,
        },
        xAxis: {
          type: "category",
          boundaryGap: false,
          data: [
            "2022-01",
            "2022-02",
            "2022-03",
            "2022-04",
            "2022-05",
            "2022-06",
            "2022-07",
          ],
        },
        yAxis: [
          {
            type: "value",
            name: "零售额/亿元", //顶端的文本描述
            show: true,
            min: 0,
            max: 500,
          },
          {
            type: "value",
            name: "零售量/亿件", //顶端的文本描述
            show: true,
            min: 0,
            max: 10000,
          },
        ],
        series: [
          {
            name: "农产品",
            type: "line",
            stack: "Total",
            smooth: true,
            color: "#2E90FA",
            data: [220, 182, 191, 234, 290, 330, 310],
          },
          {
            name: "农资",
            type: "line",
            yAxisIndex: 1,
            stack: "Total",
            smooth: true,
            color: "#15B79E",
            data: [220, 182, 191, 234, 290, 3600, 310],
          },
        ],
      };

      option && this.myChart.setOption(option);
    },
  },
完整代码:
<template>
<div id="mains"></div>
</template>
<script>
const echarts = require("echarts");
export default {
data() {
return {
myChart: null,
};
},
mounted() {
this.initCharts();
window.addEventListener("resize", () => {
this.initCharts();
});
},
methods: {
initCharts() {
var chartDom = document.getElementById("mains");
this.myChart = echarts.init(chartDom);
var option;
option = {
tooltip: {
trigger: "axis",
axisPointer: {
type: "shadow",
},
},
grid: {
left: "1%",
right: "4%",
bottom: "3%",
top: "4%",
containLabel: true,
},
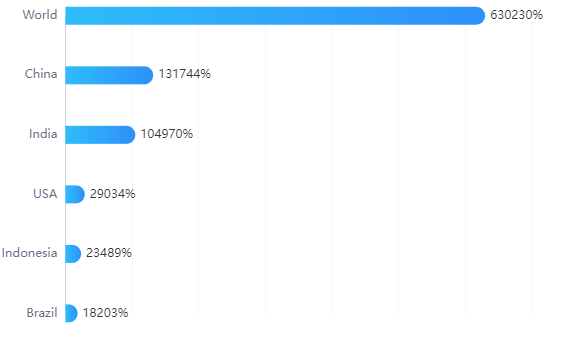
xAxis: {
type: "value",
boundaryGap: [0, 0.01],
axisLabel: {
show: false,
},
splitLine: {
lineStyle: {
type: "dashed", //虚线
color:'#f2f3f5'
},
},
},
yAxis: {
type: "category",
boundaryGap: false,
axisTick: {
length: 0, // 竖线的长度
},
axisLine: {
lineStyle: {
type: "solid",
color: "#cbd0d9", // 更改坐标轴颜色
},
},
axisLabel: { color: "#667085" },
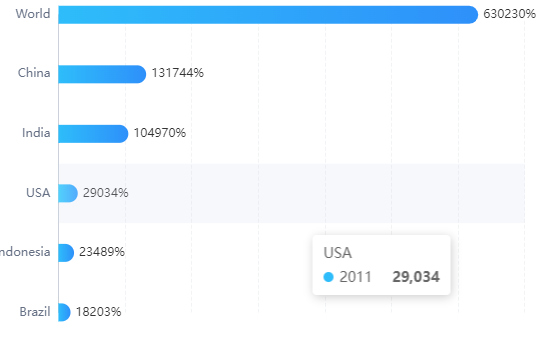
data: ["Brazil", "Indonesia", "USA", "India", "China", "World"],
},
series: [
{
name: "2011",
type: "bar",
barWidth: 18,
label: {
position: "right",
show: true,
fontSize: "12px",
formatter: "{c}%",
},
itemStyle: {
normal: {
color: new echarts.graphic.LinearGradient(0, 0, 1, 0, [
{ offset: 0, color: "#2EBDFA" },
{ offset: 1, color: "#2E90FA" },
]),
// 柱形图圆角,初始化效果
barBorderRadius: [0, 40, 40, 0],
},
},
data: [18203, 23489, 29034, 104970, 131744, 630230],
},
],
};
option && this.myChart.setOption(option);
},
},
};
</script>
<style lang="scss">
#main {
width: 100%;
height: 100%;
}
</style>
完整代码:
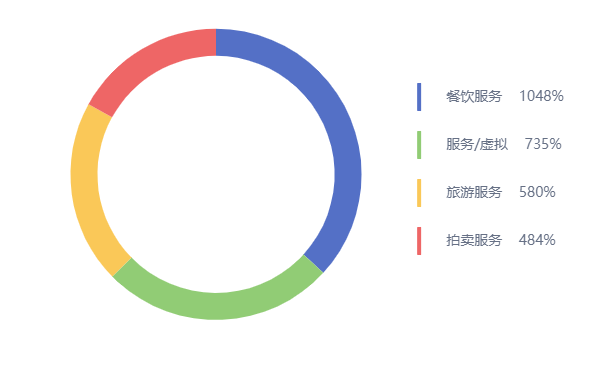
<template>
<div class="onepie assembly">
<div id="pie-main"></div>
</div>
</template>
<script>
const echarts = require("echarts");
export default {
data() {
return {
pieMyChart: null,
};
},
mounted() {
this.initEcharts();
window.addEventListener("resize", () => {
this.initEcharts();
});
},
methods: {
initEcharts() {
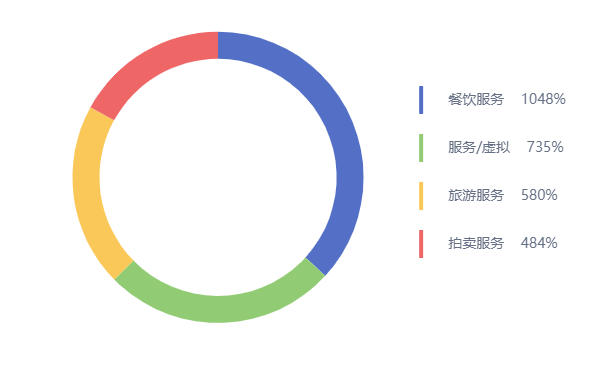
const dataList = [
{ value: 1048, name: "餐饮服务" },
{ value: 735, name: "服务/虚拟" },
{ value: 580, name: "旅游服务" },
{ value: 484, name: "拍卖服务" },
];
var chartDom = document.getElementById("pie-main");
this.pieMyChart = echarts.init(chartDom);
var option;
option = {
tooltip: {
trigger: "item",
},
legend: {
orient: "vertical",
itemWidth: 4,
itemHeight: 28,
itemGap: 20,
textStyle: {
color: "#667085",
fontSize: "14px",
padding: [0, 0, 40, 20],
},
right: "50",
top: "70",
formatter: function (name) {
let arr
for (let i = 0; i < dataList.length; i++) {
if (name === dataList[i].name) {
arr = name +'\u0020\u0020\u0020\u0020'+ dataList[i].value + "%";
}
}
return arr;
},
},
series: [
{
name: "Access From",
type: "pie",
radius: ["57%", "70%"],
center: ["35%", "40%"],
avoidLabelOverlap: false,
label: {
show: false,
position: "center",
},
emphasis: {
label: {
show: true,
fontSize: 40,
fontWeight: "bold",
},
},
labelLine: {
show: false,
},
data: [
{ value: 1048, name: "餐饮服务" },
{ value: 735, name: "服务/虚拟" },
{ value: 580, name: "旅游服务" },
{ value: 484, name: "拍卖服务" },
],
},
],
};
option && this.pieMyChart.setOption(option);
},
},
};
</script>
<style lang="scss">
.onepie {
height: 416px;
#pie-main {
width: 100%;
height: 100%;
}
}
</style>


 7419
7419

 被折叠的 条评论
为什么被折叠?
被折叠的 条评论
为什么被折叠?
 到【灌水乐园】发言


