


一、前言
数据存储在网页上,需要爬取数据下来,数据存储格式是JSON,数据可视化在工作中也变得日益重要,接下来将数据爬虫与数据可视化结合起来,做个案例
注:当时数据是22年1月29日爬取数据
二、使用步骤
# 1.导入包
import pandas as pd
import requests
import json
# 2.数据爬取
china_url = 'https://view.inews.qq.com/g2/getOnsInfo?name=disease_h5'
headers = {
"User-Agent": "Mozilla/5.0 (Macintosh; Intel Mac OS X 10_15_4) AppleWebKit/537.36 (KHTML, like Gecko) Chrome/91.0.4472.114 Safari/537.36"
}
response = requests.get(url=china_url,headers = headers).json()
data = json.loads(response['data'])
with open('1-29.json','w',encoding='utf-8') as f:
f.write(json.dumps(data))
# 3.存储到dataframe中
# 获取中国所有的数据
chinaAreaDict=data['areaTree'][0]
# 获取 所有省份的数据
provinceList = chinaAreaDict['children']
'''
[{河南,安阳},{河南,许昌}], 为了方便存储到dataframe中
'''
china_cityList = []
# 遍历每一个省份数据
for x in range(len(provinceList)):
# 省份的名称
province = provinceList[x]['name']
# 获取每一个省下的所有的城市
province_list = provinceList[x]['children']
# 遍历这个省份的所有城市【一个一个的拿出来】
for y in range(len(province_list)):
# 获取城市的名字
city = province_list[y]['name']
# 获取当前城市的总数据
total = province_list[y]['total']
# 获取当前城市的今日数据
today = province_list[y]['today']
# 保存成一个字典 {'province':province, 'city':city, 'total':total}
china_dict = {'province':province, 'city':city, 'total':total, 'today':today}
# 添加到列表中
china_cityList.append(china_dict)
# 将放有每一个城市的列表构建成dataframe
chinaTotalData = pd.DataFrame(china_cityList)
chinaTotalData
# 4.将total列数据字典转化成多列
total_dataframe = pd.DataFrame()
def func(ser):
global total_dataframe
total_dataframe = total_dataframe.append(pd.Series(ser['total']).to_frame().T,ignore_index = True)
chinaTotalData.apply(func,axis=1)
# 修改列的名字
def rename_func(x):
return "total_" + x # total_nowConfirm
total_dataframe.rename(columns = rename_func, inplace = True)
chinaTotalData = pd.merge(chinaTotalData,total_dataframe,left_index=True,right_index=True,how='outer')
# 删除total列
chinaTotalData.drop(['total'],axis=1, inplace = True)
chinaTotalData
# 5.将today列数据字典转化成多列
total_dataframe = pd.DataFrame()
def func(ser):
global total_dataframe
total_dataframe = total_dataframe.append(pd.Series(ser['today']).to_frame().T,ignore_index = True)
chinaTotalData.apply(func,axis=1)
# 修改列的名字
def rename_func(x):
return "today_" + x # total_nowConfirm
total_dataframe.rename(columns = rename_func, inplace = True)
chinaTotalData = pd.merge(chinaTotalData,total_dataframe,left_index=True,right_index=True,how='outer')
# 删除total列
chinaTotalData.drop(['today'],axis=1, inplace = True)
chinaTotalData
# 6.保存到Excel
chinaTotalData.to_excel('1-29疫情数据.xlsx',sheet_name='数据',index=False)
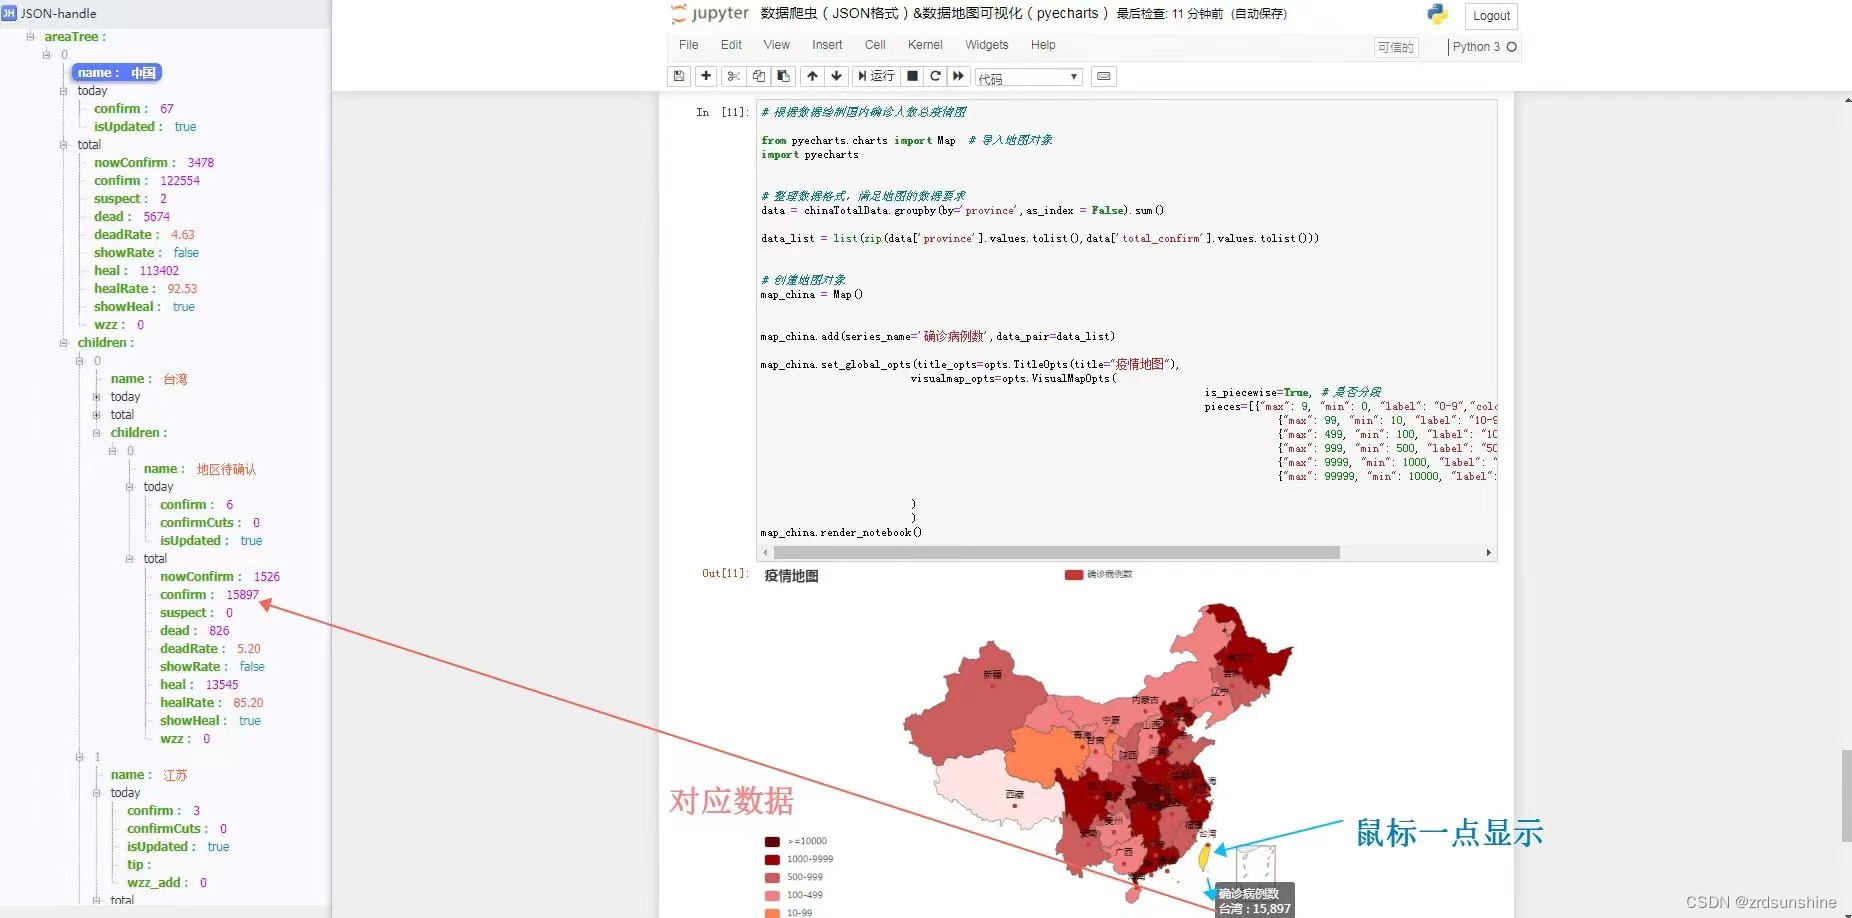
# 7.根据数据绘制国内确诊人数总疫情图
from pyecharts.charts import Map # 导入地图对象
import pyecharts
# 整理数据格式,满足地图的数据要求
data = chinaTotalData.groupby(by='province',as_index = False).sum()
data_list = list(zip(data['province'].values.tolist(),data['total_confirm'].values.tolist()))
# 创建地图对象
map_china = Map()
map_china.add(series_name='确诊病例数',data_pair=data_list)
map_china.set_global_opts(title_opts=opts.TitleOpts(title="疫情地图"),
visualmap_opts=opts.VisualMapOpts(
is_piecewise=True, # 是否分段
pieces=[{"max": 9, "min": 0, "label": "0-9","color":"#FFE4E1"},
{"max": 99, "min": 10, "label": "10-99","color":"#FF7F50"},
{"max": 499, "min": 100, "label": "100-499","color":"#F08080"},
{"max": 999, "min": 500, "label": "500-999","color":"#CD5C5C"},
{"max": 9999, "min": 1000, "label": "1000-9999", "color":"#990000"},
{"max": 99999, "min": 10000, "label": ">=10000", "color":"#660000"}]
)
)
map_china.render_notebook()
数据展示
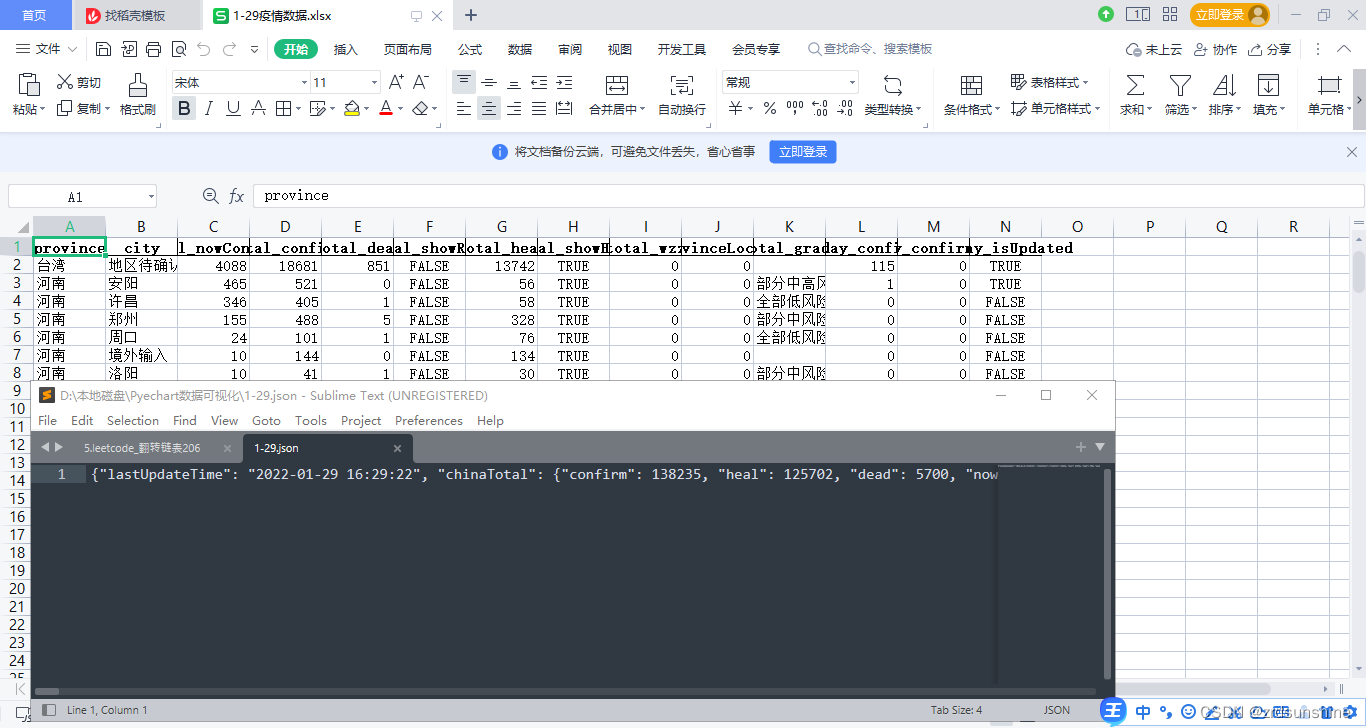
1.原始数据(Json)与结果集(Excel)所示:
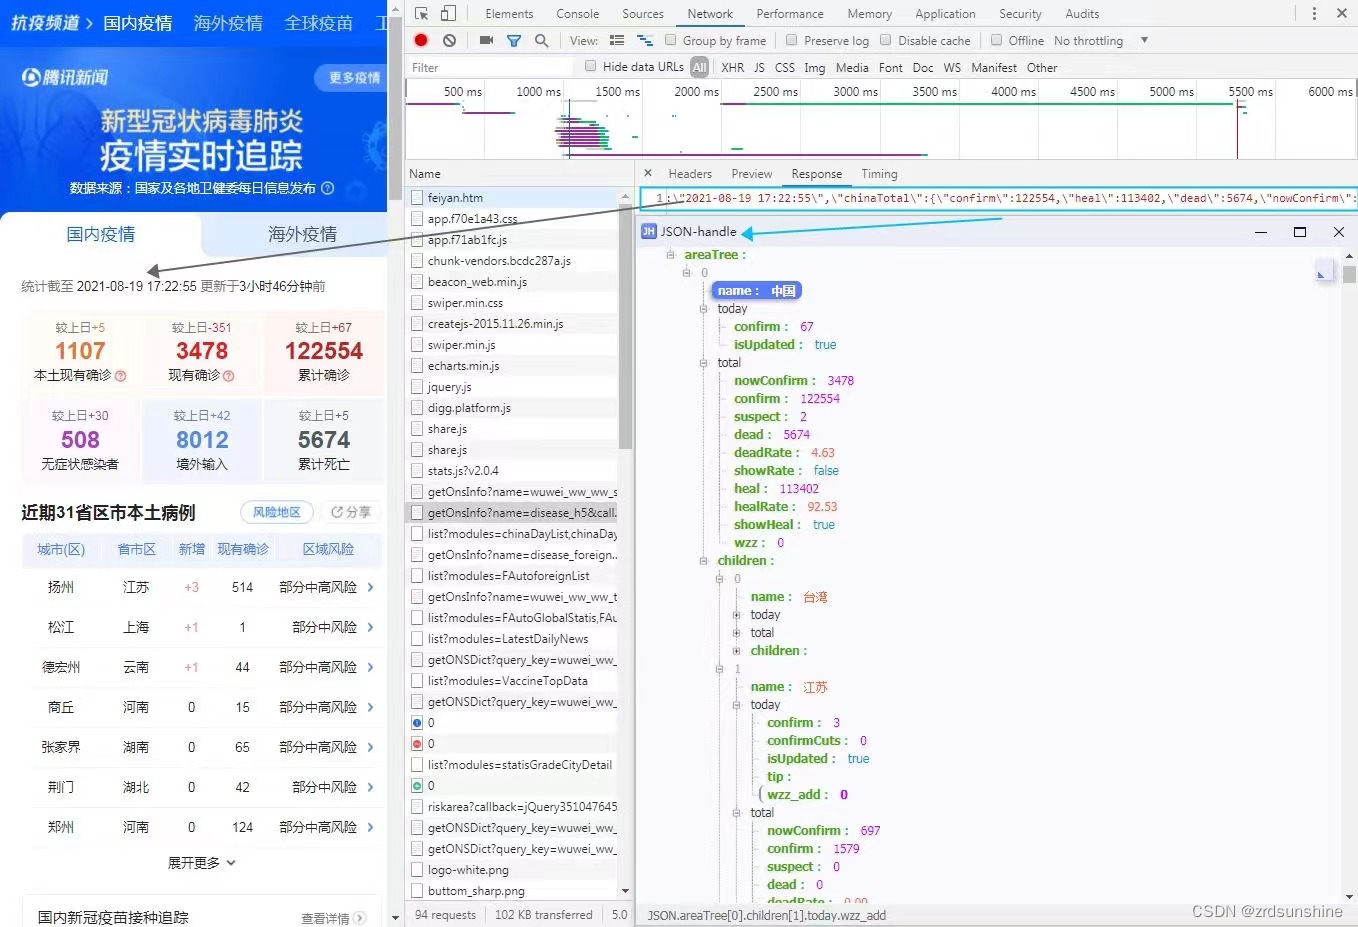
2.数据地图可视化所示(当时的记录):
(1)、
(2)、

(3)、


 被折叠的 条评论
为什么被折叠?
被折叠的 条评论
为什么被折叠?
 到【灌水乐园】发言


