import numpy as np
import matplotlib.pyplot as plt
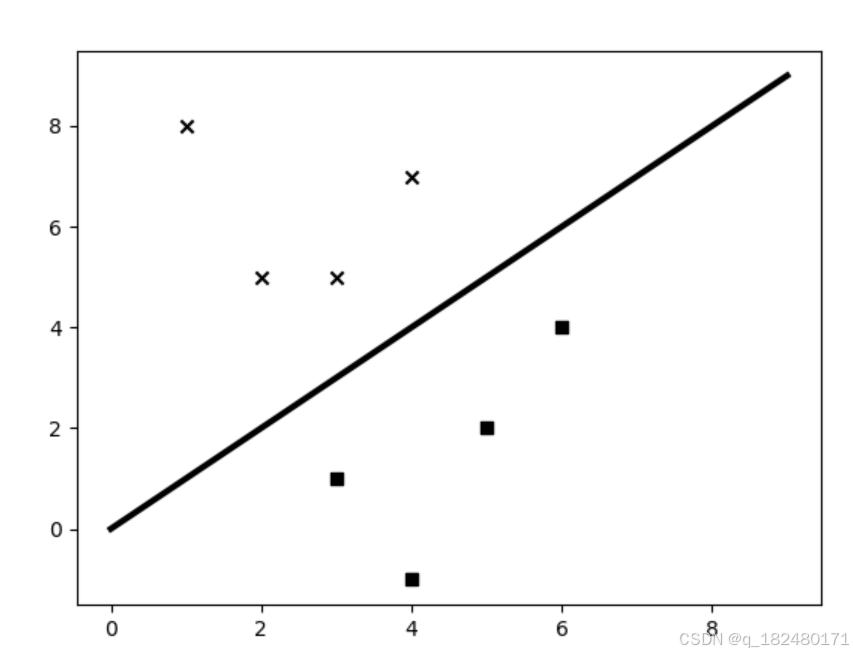
X = np.array([[3,1], [2,5], [1,8], [6,4], [5,2], [3,5], [4,7], [4,-1]])
y = [0, 1, 1, 0, 0, 1, 1, 0]
class_0 = np.array([X[i] for i in range(len(X)) if y[i]==0])
class_1 = np.array([X[i] for i in range(len(X)) if y[i]==1])
plt.figure()
plt.scatter(class_0[:,0], class_0[:,1], color='black', marker='s')
plt.scatter(class_1[:,0], class_1[:,1], color='black', marker='x')
line_x = range(10)
line_y = line_x
plt.figure()
plt.scatter(class_0[:,0], class_0[:,1], color='black', marker='s')
plt.scatter(class_1[:,0], class_1[:,1], color='black', marker='x')
plt.plot(line_x, line_y, color='black', linewidth=3)plt.show()
- 1.
- 2.
- 3.
- 4.
- 5.
- 6.
- 7.
- 8.
- 9.
- 10.
- 11.
- 12.
- 13.
- 14.
- 15.


 被折叠的 条评论
为什么被折叠?
被折叠的 条评论
为什么被折叠?
 到【灌水乐园】发言


 7368
7368


