


echarts之横向单条进度条
背景
需要将打卡进度可视化
需求
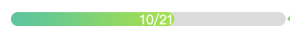
从左往右,颜色从#A4DF4E渐变至#5DC69D,效果如图:
实现代码如下:
<!DOCTYPE html>
<html>
<head>
    <meta charset="utf-8">
    <meta http-equiv="x-ua-compatible" content="IE=edge" >
    <meta name="viewport" content="width=device-width, height=device-height, initial-scale=1, maximum-scale=1, minimum-scale=1, user-scalable=no"/>
    <title>进度条</title>
    <style>
        #progress_bar{
            width:200px;
            height:50px;
        }
    </style>
    <script type="text/javascript" charset="utf-8" src="https://lib.baomitu.com/echarts/5.0.0/echarts.common.min.js"></script>
</head>
<body>
<div id="progress_bar">
    <script>
        bar_canvas('progress_bar', 10,20);
        function bar_canvas(id, val ,all){
            var myChart               = echarts.init(document.getElementById(id));
            var option                = {
                grid                : {
                    left            : '5%',
                    top             : '0',
                    right           : '0',
                    bottom          : '0',
                    containLabel    : true,
                    width           : '93%'
                },
                xAxis               : {
                    type            : 'value',
                    splitLine       : {show: false},
                    axisLabel       : {show: false},
                    axisTick        : {show: false},
                    axisLine        : {show: false},
                },
                yAxis               : {
                    type            : 'category',
                    axisTick        : {show: false},
                    axisLine        : {show: false},
                    axisLabel       : {
                        color       : 'black',
                        fontSize    : 17
                    },
                },
                series              : [
                    {
                        name        : '/'+all,
                        type        : 'bar',
                        barWidth    : 18,
                        data        : [val],
                        label       : {
                            show        : true,
                            //position    : 'middle',
                            offset      : [20,2],
                            formatter   : '{c}{a}',
                            color       : '#fff',
                            fontSize    : 15
                        },
                        itemStyle       : {
                            color: new echarts.graphic.LinearGradient(
                                1, 0, 0, 0,
                                [
                                    {offset: 0, color: '#A4DF4E'},                   //柱图渐变色
                                    // {offset: 0.5, color: '#44C0C1'},                 //柱图渐变色
                                    {offset: 1, color: '#5DC69D'},                   //柱图渐变色
                                ]
                            ),
                            barBorderRadius: 9,
                        },
                        zlevel                    : 1
                    },
                    {
                        name                      : '进度条背景',
                        type                      : 'bar',
                        barGap                    : '-100%',
                        barWidth                  : 18,
                        data                      : [all],
                        color                     : '#DCDCDC',//柱条颜色
                        itemStyle                 : {
                            normal                : {
                                barBorderRadius: 9,
                                borderColor: '#FEFEFE',
                            }
                        }
                    }
                ]
            };

            // 使用刚指定的配置项和数据显示图表。
            myChart.setOption(option);

            setTimeout(function (){
                window.onresize = function () {
                    myChart.resize();
                }
            },200);
        }
    </script>
</body>
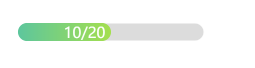
实现效果:
转载请标注来源https://blog.csdn.net/weixin_42557545/article/details/111482420


 1165
1165


 被折叠的 条评论
为什么被折叠?
被折叠的 条评论
为什么被折叠?
 到【灌水乐园】发言


