


主要使用面向对象(Object-Oriented):更为底层和基础的方式
// An highlighted block
import numpy as np
import matplotlib.pyplot as plt
面向对象方式
// An highlighted block
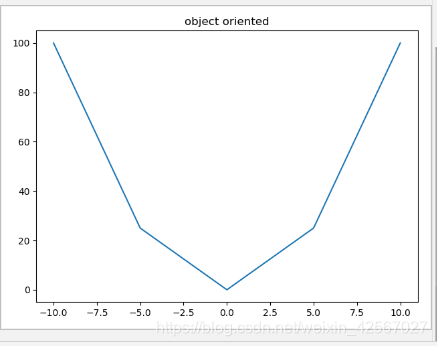
x=np.linspace(-10,10,5)
y=x**2
fig=plt.figure() #生成画布
ax=fig.add_subplot(111)
l,=plt.plot(x,y)
t=ax.set_title('object oriented')
plt.show()
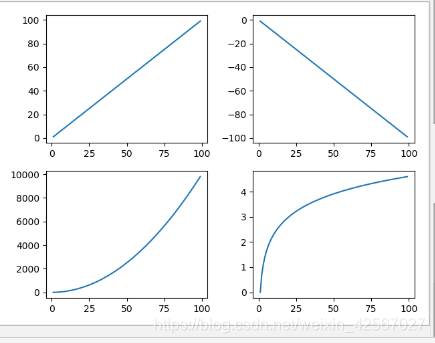
绘制子图
面向对象方式
// An highlighted block
x=np.arange(1,100)
fig=plt.figure()
ax1=fig.add_subplot(221)
ax1.plot(x,x)
ax2=fig.add_subplot(222)
ax2.plot(x,-x)
ax3=fig.add_subplot(223)
ax3.plot(x,x**2)
ax4=fig.add_subplot(224)
ax4.plot(x,np.log(x))
plt.show()
pyplot方式
// An highlighted block
x=np.arange(1,100)
plt.subplot(221)
plt.plot(x,x)
plt.subplot(222)
plt.plot(x,-x)
plt.subplot(223)
plt.plot(x,x**2)
plt.subplot(224)
plt.plot(x,np.log(x))
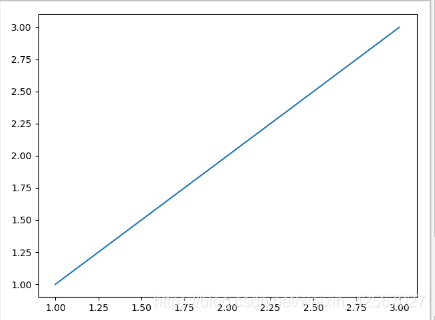
同时生成多张图
// An highlighted block
fig1=plt.figure()
ax1=fig1.add_subplot(111)
ax1.plot([1,2,3],[3,2,1])
fig2=plt.figure()
ax2=fig2.add_subplot(111)
ax2.plot([1,2,3],[1,2,3])
plt.show()

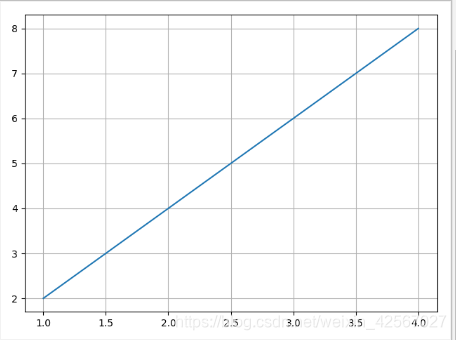
网格
网格作为背景,得到具体位置
面向对象方式
// An highlighted block
x=np.arange(1,5)
fig=plt.figure()
ax=fig.add_subplot(111)
plt.plot(x,x*2)
ax.grid()
plt.show()
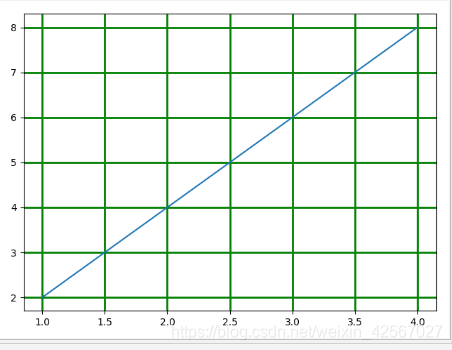
设置网格
颜色:color 宽度:linewidth 格式:linestyle
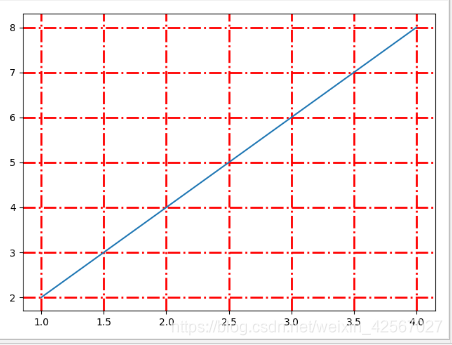
pyplot方式
// An highlighted block
x=np.arange(1,5)
plt.plot(x,x*2)
#打开网格
plt.grid(True)
#关闭网格
#plt.grid()
plt.grid(color='green')
plt.grid(linewidth='2')
plt.grid(linestyle='-')
plt.show()
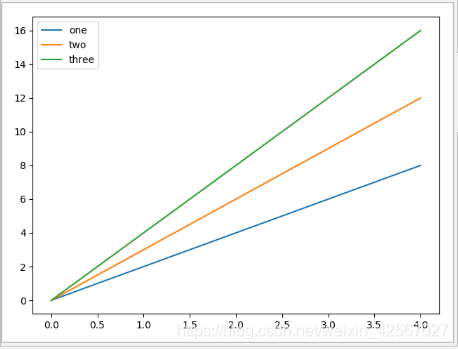
图例
信息框的设置
面向对象方式
// An highlighted block
x=np.arange(0,5)
fig=plt.figure()
ax=fig.add_subplot(111)
ax.plot(x,x*2,label='one')
ax.plot(x,x*3,label='two')
ax.plot(x,x*4,label='three')
plt.show()
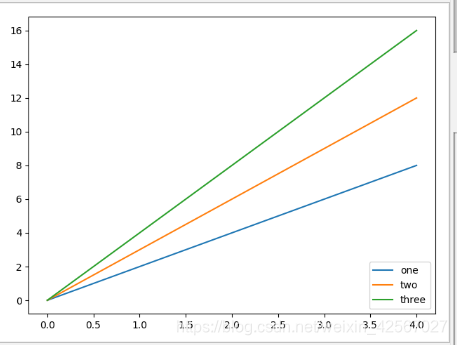
参数调整
- 信息框位置 1:左上角 2:右上角 3:左下角 4:右下角 0:系统默认的最佳位置
// An highlighted block
x=np.arange(0,5)
fig=plt.figure()
ax=fig.add_subplot(111)
ax.plot(x,x*2,label='one')
ax.plot(x,x*3,label='two')
ax.plot(x,x*4,label='three')
plt.legend(loc=4)
plt.show()
2. 信息框列数(ncol)
// An highlighted block
x=np.arange(0,5)
fig=plt.figure()
ax=fig.add_subplot(111)
ax.plot(x,x*2,label='one')
ax.plot(x,x*3,label='two')
ax.plot(x,x*4,label='three')
plt.legend(ncol=3)
plt.show()

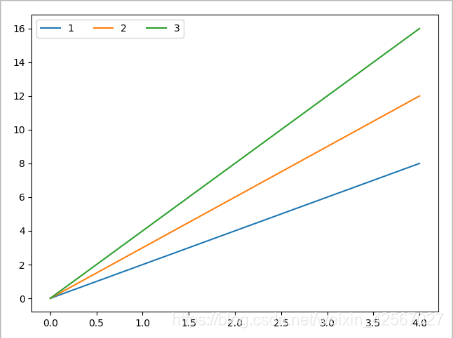
3. 统一设置
// An highlighted block
x=np.arange(0,5)
fig=plt.figure()
ax=fig.add_subplot(111)
ax.plot(x,x*2)
ax.plot(x,x*3)
ax.plot(x,x*4)
plt.legend(['1','2','3'],ncol=3)
plt.show()

pyplot方式
// An highlighted block
x=np.arange(0,5)
plt.plot(x,x*2)
plt.plot(x,x*3)
plt.plot(x,x*4)
plt.legend(['1','2','3'],ncol=3)
plt.show()


 994
994


 被折叠的 条评论
为什么被折叠?
被折叠的 条评论
为什么被折叠?
 到【灌水乐园】发言


