


一、介绍
FusionCharts是一个基于XML和Flash的图表组件,其中FusionCharts Free是免费的,其功能也十分强大、美观。
其可以用在PHP、JSP、ASP等等。
二、常见的图表类型
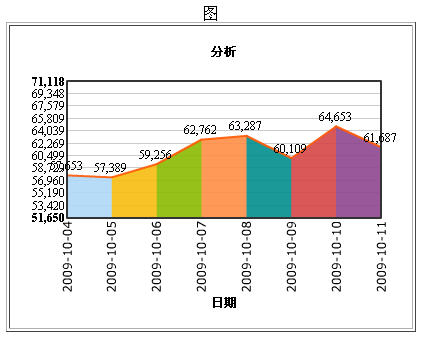
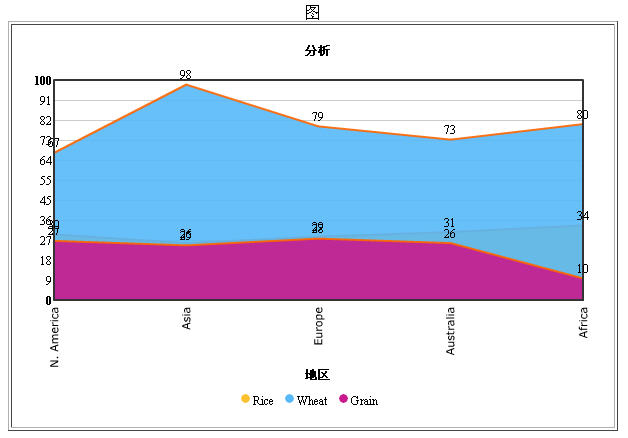
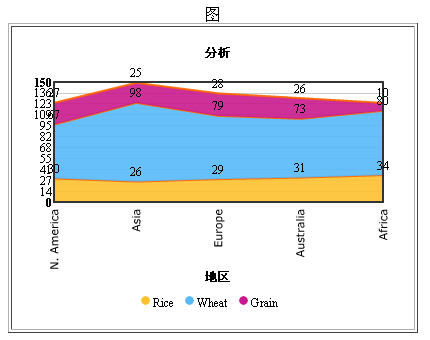
1.Area图
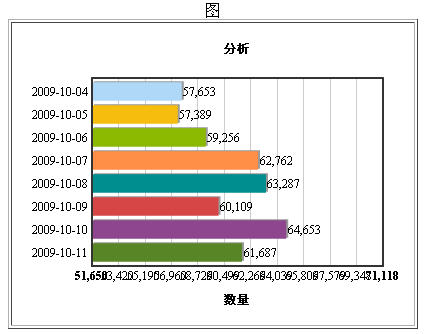
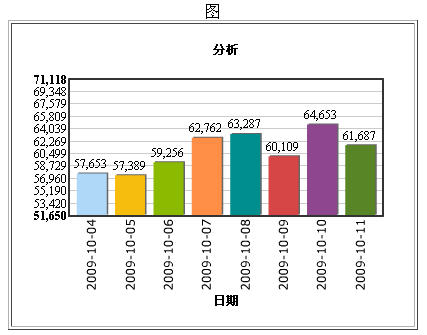
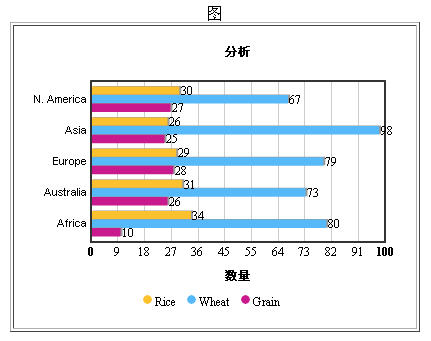
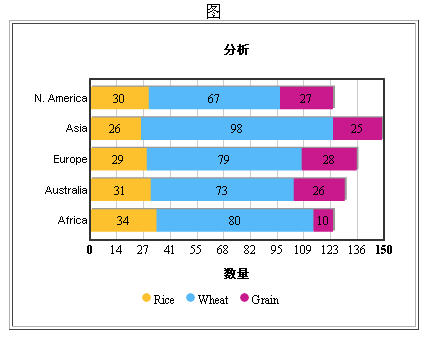
2.Bar图
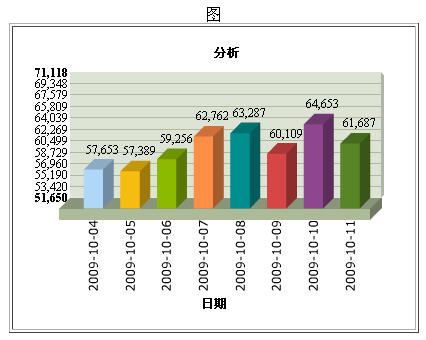
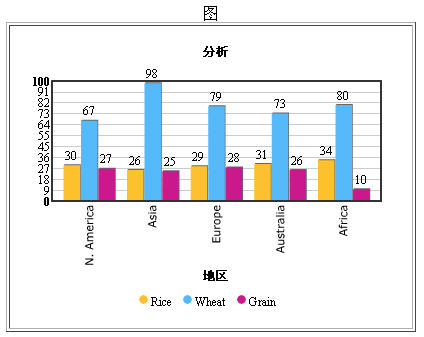
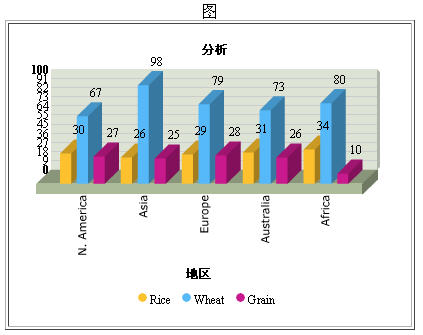
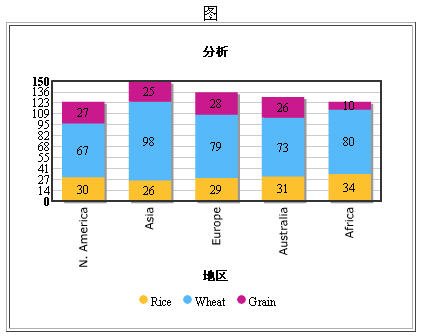
3.Column图
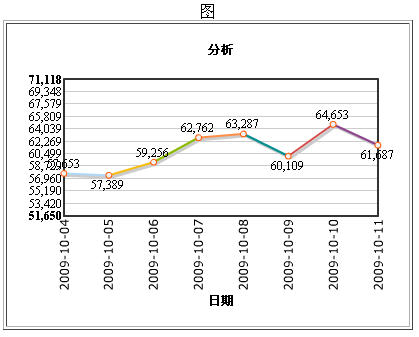
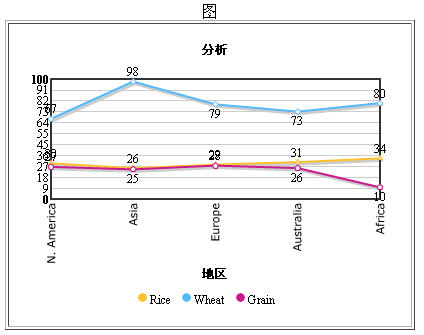
4.Line图
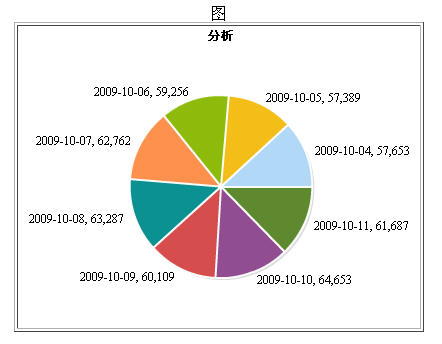
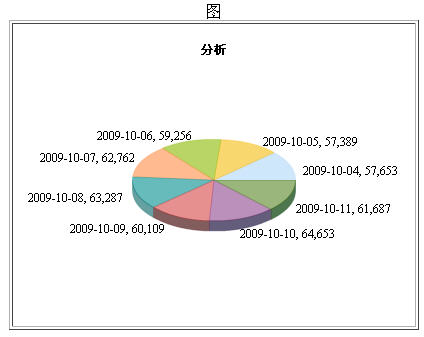
5.Pie图
6.Stacked图
7.Combine图
三、数据源
其数据源形式为XML的形式,XML形式分为单序列和多序列XML,以及其他的格式。
四、简单使用
目录结构:
test.html
data.xml
FusionCharts
|----------Charts
| |--------------- many charts *.swf
|----------JSClass
| |--------------- FusionCharts.js
test.html代码:
html PUBLIC "-//W3C//DTD HTML 4.01 Transitional//EN" "http://www.w3.org/TR/html4/loose.dtd">
图|
var chart = new FusionCharts('FusionCharts/Charts/FCF_Pie2D.swf', "ChartId", "400", "300"); chart.setDataURL("data.xml"); chart.render('Pie'); |
要注意添加以下几行代码,并注意其中的路径:
(1)导入JS:
(2)图表显示的地方:
(3)脚本:用于设置显示什么图、图的数据等
var chart =
new FusionCharts('FusionCharts/Charts/FCF_Pie2D.swf ', "ChartId", "400", "300");
chart.setDataURL("data.xml");
chart.render('Pie ');
其中,chart.render("Pie")中的Pie是你要显示图的div的id
data.xml
显示效果如下:
也可以不用单独的文件存储xml,可以利用setDataXML方法,如下:
var chart =
new FusionCharts('FusionCharts/Charts/FCF_Pie2D.swf', "ChartId", "400", "300");
chart.setDataXML("");
chart.render('Pie');
五、单序列XML形式
举例:
标签的一些属性:
baseFont: 图表的字体
baseFontSize: 图表的字号
caption: 标题
subcaption: 子标题
yAxisMinValue: y轴的最小值
yAxisMaxValue: y轴的最大值
hovercapbg: 当鼠标悬停时显示的背景色
hovercapborder: 当鼠标悬停时边框色
formatNumber(0/1):是否用逗号分隔(1--用逗号分隔,0--不用)
formatNumberScale(0/1): 是否添加K、M到数字(1--添加,0--不添加)
decimalPrecision: 小数的位数
showValues(0/1): 是否显示数值
numdivlines: 水平网格线的条数
numVdivlines: 垂直网络线显示的条数
showNames(0/1): 是否显示x轴的每个数据的名称
rotateNames(0/1): 是否旋转x轴的每个数据的名称
rotateYAxisName(0/1):是否显示y轴的名称
showAlternateHGridColor(0/1): 是否显示交替的网格颜色
标签:
name: x轴的每个数据的名称
value: 值
有几种图可以使用单序列的XML格式的数据
(1)Pie图
FCF_Pie2D.swf FCF_Pie3D.swf

(2)Area图
FCF_Area2D.swf
(3)Bar图
FCF_Bar2D.swf
(4)Column图
FCF_Column2D.swf FCF_Column3D.swf
(5)Line图
FCF_Line.swf
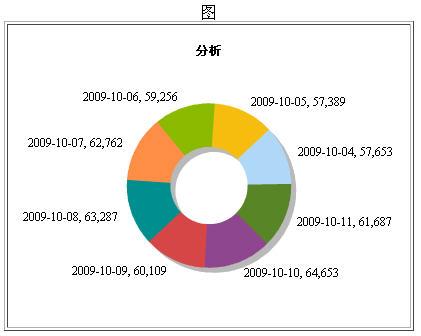
(6)Doughnut图
FCF_Doughnut2D.swf
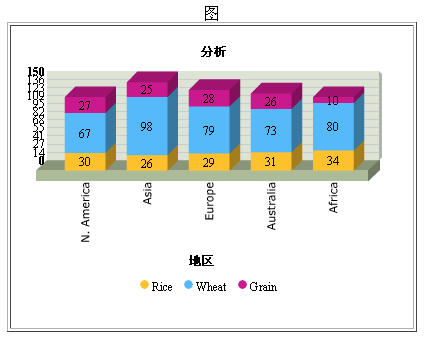
六、多序列XML形式
举例:
' yaxisname='数量' hovercapbg='FFECAA' hovercapborder='F47E00' formatNumberScale='0' decimalPrecision='0' showvalues='1'
numdivlines='10' numVdivlines='0' shownames='1' rotateNames='1' >
基本上同单序列XML形式
指明x轴有几个种类
对应一个种类
name:种类名
指明一个序列集,序列集中值的个数同category的种类数
seriesname:序列的名称
:序列的一个值
有几种图可以使用多序列的XML格式的数据
(1)Area图
FCF_MSArea2D.swf
(2)Bar图
FCF_MSBar2D.swf
(3)Column图
FCF_MSColumn2D.swf FCF_MSColumn3D.swf
(4)Line图
FCF_MSLine.swf
(5)Stacked图
FCF_StackedArea2D.swf
FCF_StackedBar2D.swf
FCF_StackedColumn2D.swf FCF_StackedColumn3D.swf
七、产生上述XML的类
public class FusionChartsXMLGenerator {
public static final int BOOLEAN_TRUE = 0;
public static final int BOOLEAN_FALSE = 1;
private static Logger LOGGER = LoggerFactory.getLogger(FusionChartsXMLGenerator.class);
private static FusionChartsXMLGenerator singleton = new FusionChartsXMLGenerator();
public static FusionChartsXMLGenerator getInstance() {
return singleton;
}
private FusionChartsXMLGenerator() {}
private String[] colors = {"AFD8F8", "F6BD0F", "8BBA00", "FF8E46", "008E8E",
"D64646", "8E468E", "588526", "B3AA00", "008ED6", "9D080D", "A186BE"};
/**
* data形式为:
* "" category1,category2,category3...-------->这是第一行
* type1 value1,value2,value3,...
* type2 value1,value2,value3,...
* ......
*/
public String getMultiDSXML(List> data,
String caption, String subCaption,
String xAxisName, String yAxisName,
int showNames,int showValues,
int decimalPrecision, int rotateNames) {
double max = -Double.MAX_VALUE, min = Double.MAX_VALUE;
for (int i = 1; i
List row = (List)data.get(i);
for (int j = 1; j
String val = (String)row.get(j);
if (val != null && val.length() > 0) {
double v = Double.parseDouble(val);
if (v > max) {
max = v;
}
if (v
min = v;
}
}
}
}
if (max == -Double.MAX_VALUE) {
max = 0;
}
if (min == Double.MAX_VALUE) {
min = 0;
}
if (min == max && min == 0) {
min = 0;
max = 100;
}
max = Math.abs(max / 10) + max;
min = min - Math.abs(min / 10);
int valCnt = ((List)data.get(0)).size() - 1;
if (valCnt > 30) {
showNames = 0;
showValues = 0;
}
StringBuffer strXml = new StringBuffer();
strXml.append("
caption +"' subcaption='" + subCaption + "' " +
"yAxisMinValue='" + min + "' yAxisMaxValue='" + max + "' " +
"xAxisName='" + xAxisName + "' yAxisName='" + yAxisName + "' hovercapbg='FFECAA' " +
"hovercapborder='F47E00' formatNumberScale='0' decimalPrecision='" + decimalPrecision + "' " +
"showValues='" + showValues + "' numdivlines='10' numVdivlines='0' " +
"showNames='" + showNames + "' rotateNames='" + rotateNames + "' " +
"rotateYAxisName='0' showAlternateHGridColor='1'>");
strXml.append("");
List headerRow = (List)data.get(0);
for (int i = 1; i
strXml.append("");
}
strXml.append("");
for (int i = 1; i
List row = (List)data.get(i);
String name = (String)row.get(0);
String color = colors[(i - 1) % 12];
strXml.append("
"color='" + color + "' anchorBorderColor='" + color + "' " +
"anchorBgColor='" + color + "'>");
for (int j = 1; j
strXml.append("");
}
strXml.append("
");}
strXml.append("
");String str = strXml.toString();
LOGGER.info("=============/n" + str + "/n==============/n");
return str;
}
/**
* 数据格式为:
* name value
* name value
* ......
*/
public String getSingleDSXML(List> data,
String caption, String subCaption,
String xAxisName, String yAxisName,
int showNames,int showValues,
int decimalPrecision, int rotateNames) {
double max = -Double.MAX_VALUE, min = Double.MAX_VALUE;
for (int i = 0; i
List row = data.get(i);
double value = Double.parseDouble(row.get(1));
if (value > max) {
max = value;
}
if (value
min = value;
}
}
if (max == -Double.MAX_VALUE) {
max = 0;
}
if (min == Double.MAX_VALUE) {
min = 0;
}
if (min == max && min == 0) {
min = 0;
max = 100;
}
max = Math.abs(max / 10) + max;
min = min - Math.abs(min / 10);
int valCnt = data.size() - 1;
if (valCnt > 30) {
showNames = 0;
showValues = 0;
}
StringBuffer strXml = new StringBuffer();
strXml.append("
caption +"' subcaption='" + subCaption + "' " +
"yAxisMinValue='" + min + "' yAxisMaxValue='" + max + "' " +
"xAxisName='" + xAxisName + "' yAxisName='" + yAxisName + "' hovercapbg='FFECAA' " +
"hovercapborder='F47E00' formatNumberScale='0' decimalPrecision='" + decimalPrecision + "' " +
"showValues='" + showValues + "' numdivlines='10' numVdivlines='0' " +
"showNames='" + showNames + "' rotateNames='" + rotateNames + "' " +
"rotateYAxisName='0' showAlternateHGridColor='1'>");
for (int i = 0; i
List row = data.get(i);
String label = row.get(0);
String value = row.get(1);
String color = colors[i % 12];
strXml.append("");
}
strXml.append("
");String str = strXml.toString();
LOGGER.info("=============/n" + str + "/n==============/n");
return str;
}
}
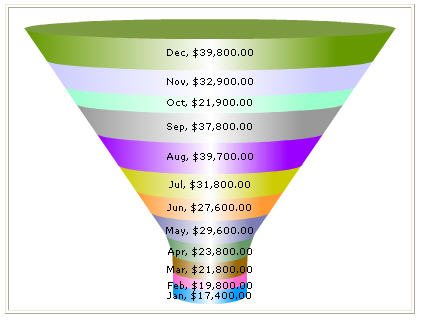
八、其他图
(1)漏斗图
FCF_Funnel.swf
XML:
===================================
===================================
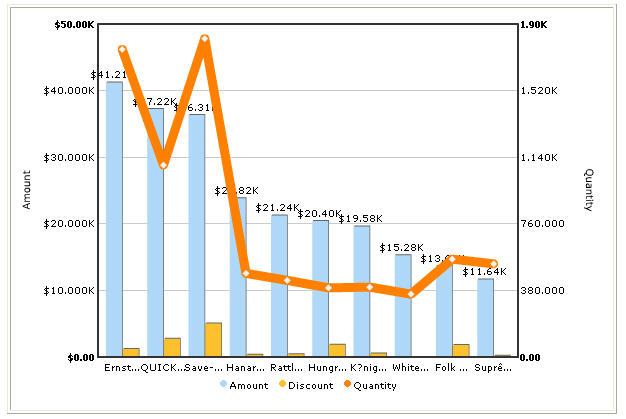
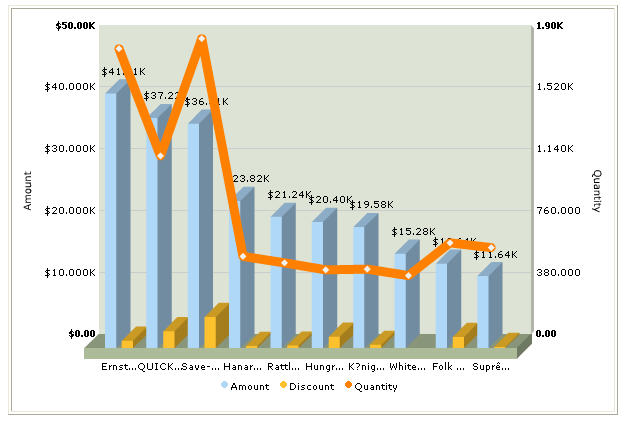
(2)线柱组合图
FCF_MSColumn2DLineDY.swf FCF_MSColumn3DLineDY.swf
XML:
===================================
========================================
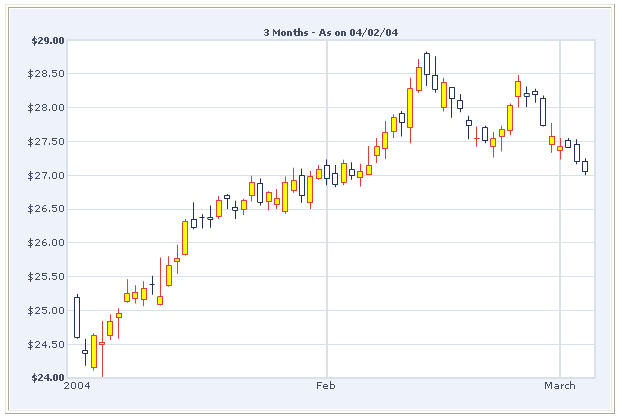
(3)K线图
FCF_Candlestick.swf
XML:
========================================
================================================


 204
204


 被折叠的 条评论
为什么被折叠?
被折叠的 条评论
为什么被折叠?
 到【灌水乐园】发言


