


前言
最近很喜欢一个IP官方微博(@暹罗厘普),想做一份它内容的拆解分析,一开始都是图文没有相关数据支撑,感觉没有啥说服力,所以自己捣鼓捣鼓,把它的微博内容爬了一下做了一些简单的数据分析。从数据爬取、清洗、分析到可视化的全流程都跑了一遍,
希望大家享用愉快!
(IP的内容分析可以看新生代IP暹罗厘普的分析与启示 | 人人都是产品经理)
目录
项目概述
本项目主要包含两大部分:
-
数据爬取:使用Selenium自动化爬取目标微博账号的所有微博内容和互动数据
-
数据分析:从多个维度对微博数据进行分析,并生成可视化图表和HTML报告
分析维度
这个部分我只选了我需要用的,大家自行摘取
-
基础信息分析(发布时间分布、互动数据统计)
-
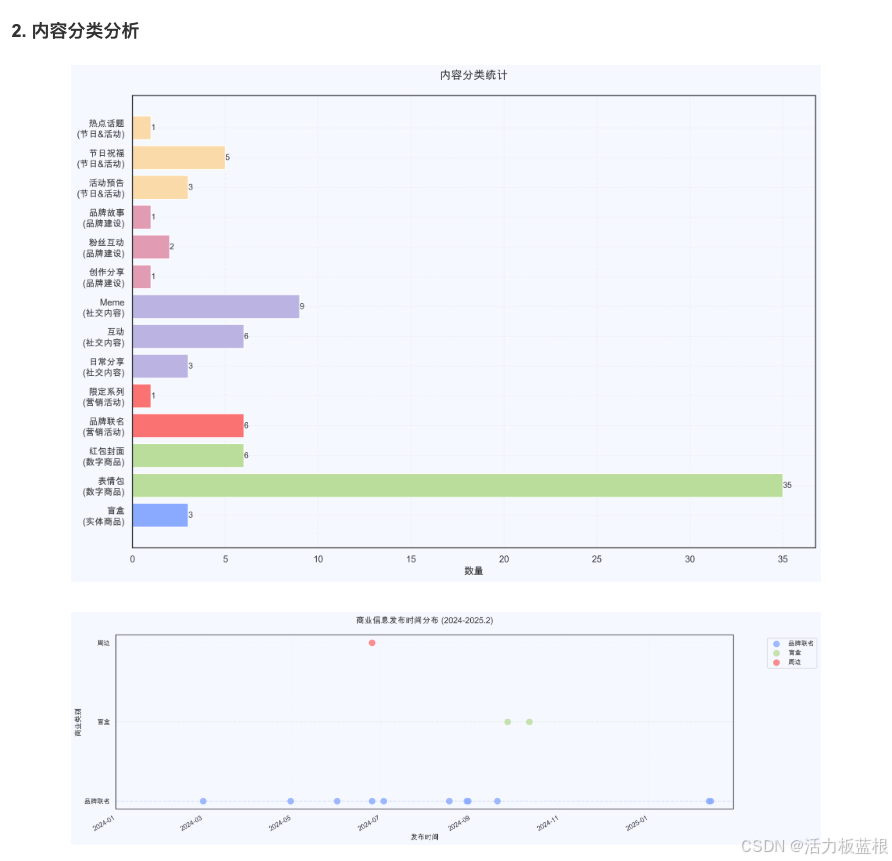
内容分类分析(商品、联名活动、社交媒体内容等)
-
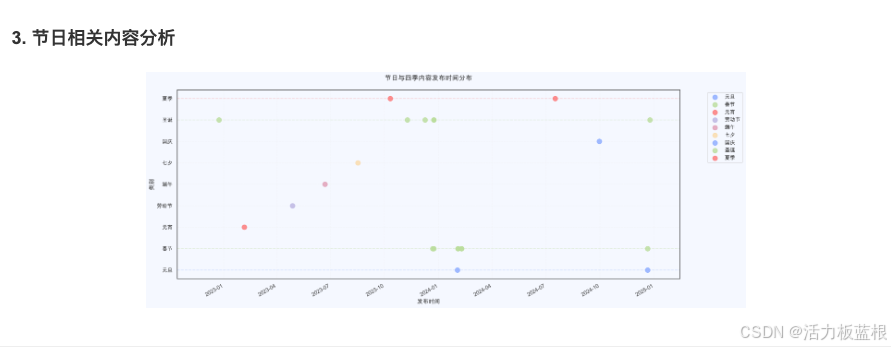
节日相关内容分析
-
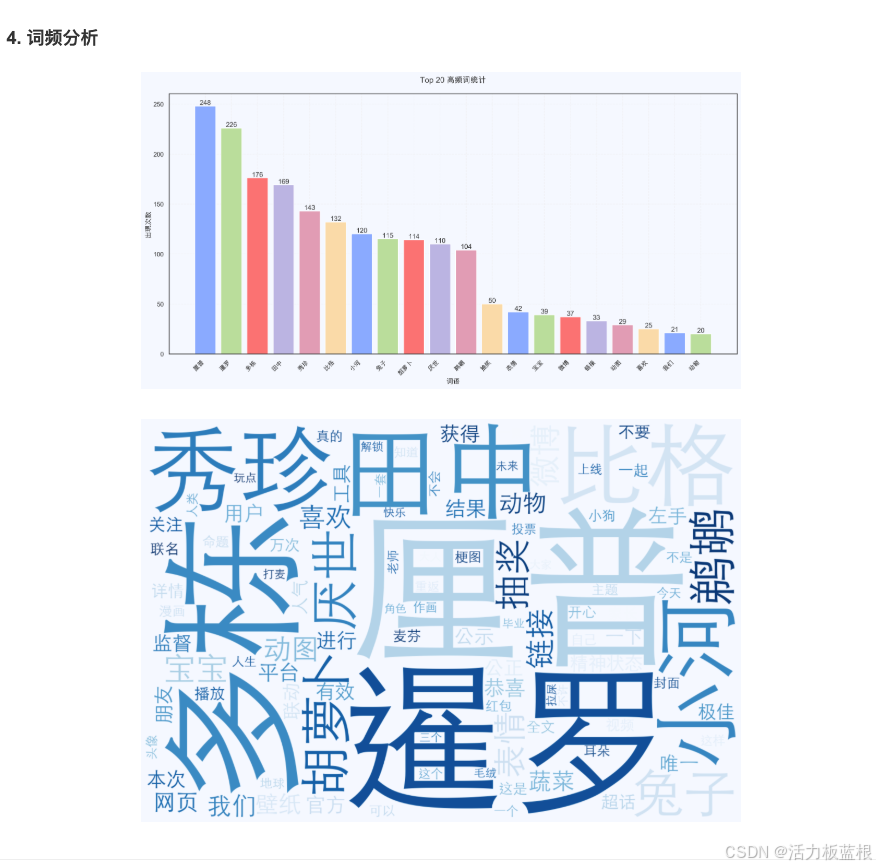
词频分析(高频词统计、词云可视化)
-
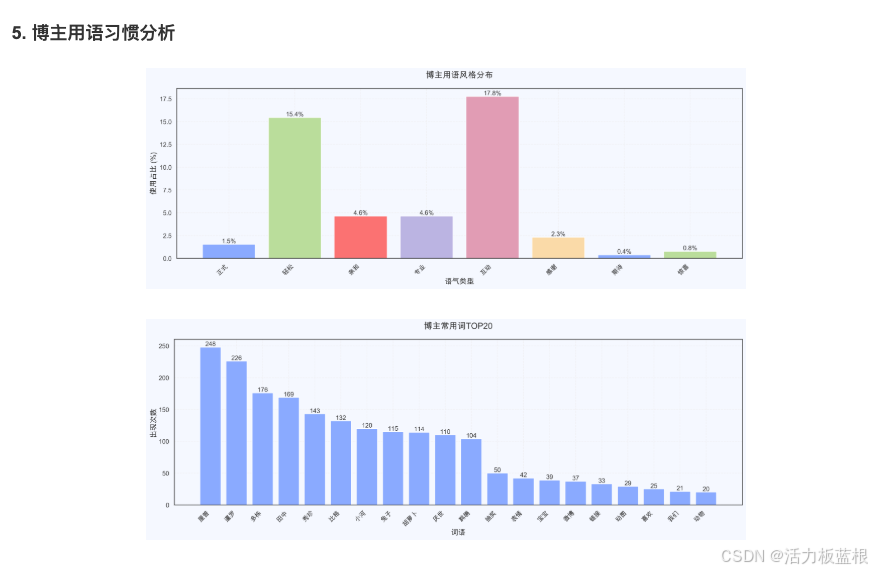
博主用语习惯分析
-
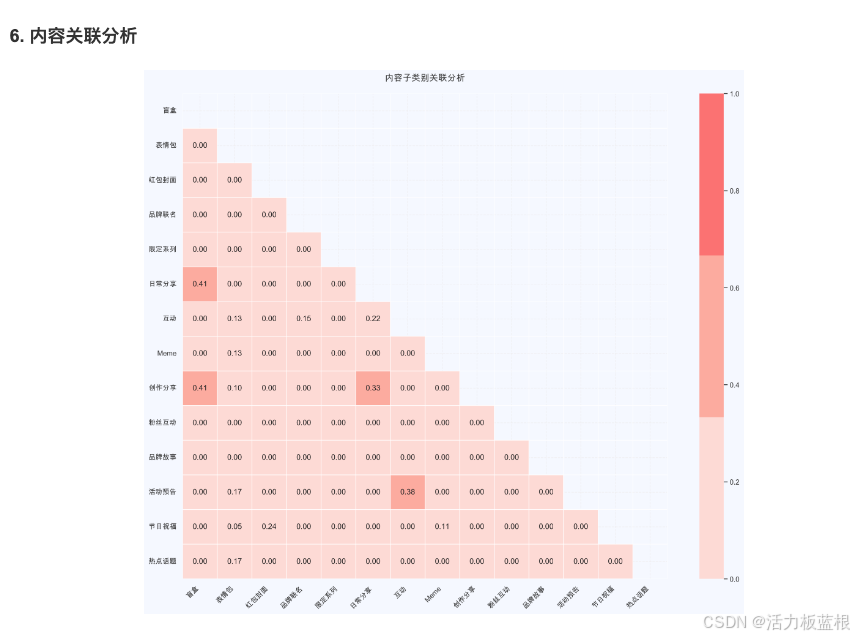
内容关联分析
-
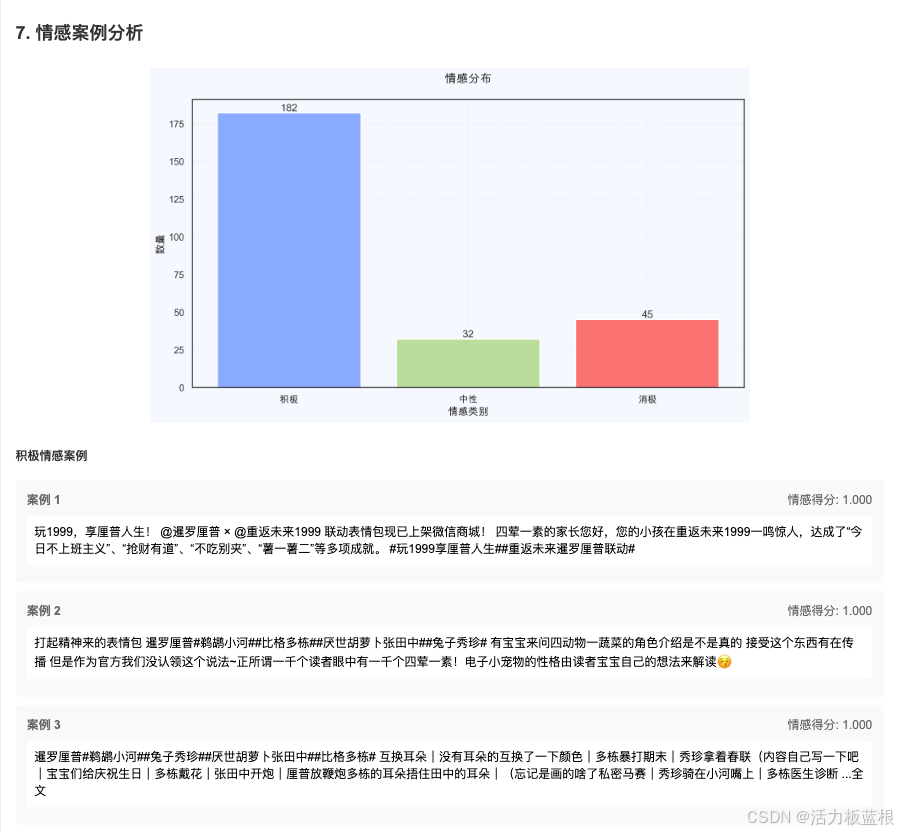
情感分析
-
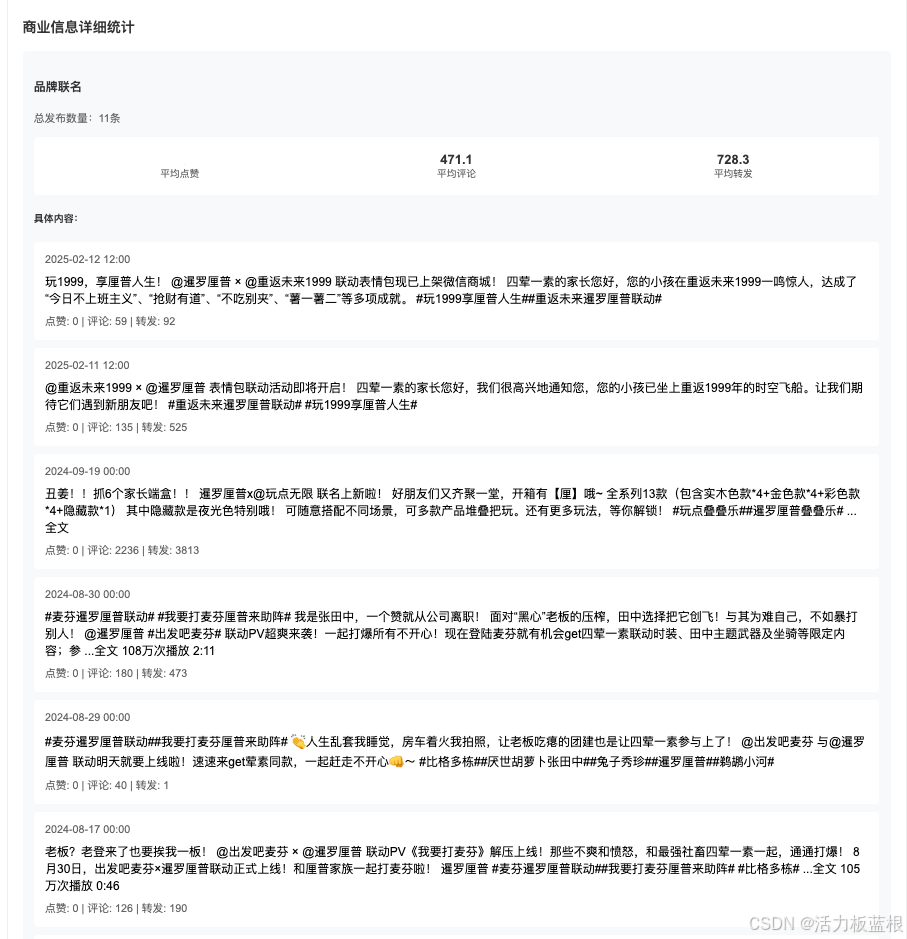
商业信息分析
环境准备
首先,我们需要安装必要的Python库:
pip install -r requirements.txtrequirements.txt 文件内容如下:
requests==2.31.0
beautifulsoup4==4.12.2
pandas==2.1.3
selenium==4.15.2
python-dateutil==2.8.2
tqdm==4.66.1
fake-useragent==1.4.0
lxml==4.9.3
webdriver-manager==4.0.1
matplotlib
jieba
snownlp
wordcloud
numpy
seaborn
项目结构
项目采用模块化设计更加便于维护和扩展:
weibo_analysis/
├── README.md                # 项目说明文档
├── requirements.txt         # 项目依赖
├── scraper.py               # 微博爬虫主程序
├── analyzer.py              # 数据分析主程序
├── config.py                # 配置文件
├── utils.py                 # 工具函数
├── analyzers/               # 各类分析器
│   ├── base_analyzer.py     # 基础分析器
│   ├── basic_info_analyzer.py # 基础信息分析器
│   ├── content_analyzer.py  # 内容分析器
│   ├── festival_analyzer.py # 节日内容分析器
│   ├── word_analyzer.py     # 词频分析器
│   ├── language_analyzer.py # 语言习惯分析器
│   ├── correlation_analyzer.py # 关联分析器
│   ├── sentiment_analyzer.py # 情感分析器
│   └── business_analyzer.py # 商业信息分析器
└── data/                    # 数据和输出目录
    ├── raw_data.json        # 原始数据(JSON格式)
    ├── raw_data.csv         # 原始数据(CSV格式)
    ├── analysis_report.html # 分析报告
    └── *.png                # 各类分析图表
第一部分:微博数据爬取
1. 爬虫设计思路
微博网站是动态加载的,因此我们使用Selenium来模拟浏览器行为,实现自动化爬取。爬虫的主要流程包括:
-
初始化WebDriver
-
登录微博(可选)
-
访问目标用户主页
-
滚动页面加载更多微博
-
解析微博内容和互动数据
-
保存数据到JSON和CSV文件
2. 核心代码实现
2.1 初始化WebDriver
def setup_driver(self):
    print_step("设置WebDriver")
    chrome_options = Options()

    # 设置无头模式(可选)
    if HEADLESS_MODE:
        chrome_options.add_argument('--headless')

    chrome_options.add_argument('--no-sandbox')
    chrome_options.add_argument('--disable-dev-shm-usage')
    chrome_options.add_argument('--disable-gpu')
    chrome_options.add_argument('--window-size=1920,1080')

    # 添加用户代理
    chrome_options.add_argument(f'user-agent={USER_AGENT}')

    # 设置Chrome驱动
    service = Service(CHROME_DRIVER_PATH)
    self.driver = webdriver.Chrome(service=service, options=chrome_options)

    # 设置等待
    self.wait = WebDriverWait(self.driver, 10)
    print_success("WebDriver设置完成")
2.2 滚动页面加载更多微博
def scroll_page(self):
    print_step("开始滚动页面加载更多微博")

    # 初始化计数器和上一次高度
    scroll_count = 0
    last_height = self.driver.execute_script("return document.body.scrollHeight")

    # 设置进度条
    with tqdm(total=MAX_SCROLLS, desc="滚动页面") as pbar:
        while scroll_count < MAX_SCROLLS:
            # 滚动到页面底部
            self.driver.execute_script("window.scrollTo(0, document.body.scrollHeight);")

            # 随机等待,模拟人类行为
            time.sleep(random.uniform(1.5, 3.0))

            # 获取新的页面高度
            new_height = self.driver.execute_script("return document.body.scrollHeight")

            # 如果高度没有变化,可能已经到底或者需要点击"加载更多"
            if new_height == last_height:
                try:
                    # 尝试查找并点击"加载更多"按钮
                    more_btn = self.driver.find_element(By.CSS_SELECTOR, '.more_txt')
                    more_btn.click()
                    time.sleep(random.uniform(1.0, 2.0))
                except:
                    # 如果连续多次高度不变,可能已经到底
                    print_warning(f"已滚动 {scroll_count} 次,可能已到达底部")
                    break

            last_height = new_height
            scroll_count += 1
            pbar.update(1)

    print_success(f"页面滚动完成,共滚动 {scroll_count} 次")
2.3 解析微博内容
def parse_weibo_content(self):
    print_step("开始解析微博内容")

    # 等待微博内容加载
    self.wait.until(EC.presence_of_element_located((By.CSS_SELECTOR, '.card-wrap')))

    # 获取页面源码并使用BeautifulSoup解析
    html = self.driver.page_source
    soup = BeautifulSoup(html, 'lxml')

    # 查找所有微博卡片
    cards = soup.find_all('div', class_='card-wrap')

    # 初始化数据列表
    weibo_data = []

    # 设置进度条
    with tqdm(total=len(cards), desc="解析微博") as pbar:
        for card in cards:
            try:
                # 跳过非微博内容的卡片
                if not card.find('div', class_='content'):
                    pbar.update(1)
                    continue

                # 解析微博ID
                weibo_id = card.get('mid', '')

                # 解析发布时间
                time_elem = card.find('div', class_='from').find('a')
                time_str = time_elem.text.strip() if time_elem else ''

                # 解析微博内容
                content_elem = card.find('div', class_='content').find('p', class_='txt')
                content = content_elem.text.strip() if content_elem else ''

                # 解析互动数据(点赞、评论、转发)
                footer = card.find('div', class_='card-act')

                # 获取点赞数
                like_elem = footer.find('span', class_='praised')
                like_count = 0
                if like_elem:
                    like_text = like_elem.find('em').text if like_elem.find('em') else '0'
                    like_count = int(like_text) if like_text.isdigit() else 0

                # 获取评论数
                comment_elem = footer.find_all('li')[1].find('a')
                comment_count = 0
                if comment_elem:
                    comment_text = re.search(r'\d+', comment_elem.text)
                    comment_count = int(comment_text.group()) if comment_text else 0

                # 获取转发数
                repost_elem = footer.find_all('li')[0].find('a')
                repost_count = 0
                if repost_elem:
                    repost_text = re.search(r'\d+', repost_elem.text)
                    repost_count = int(repost_text.group()) if repost_text else 0

                # 将数据添加到列表
                weibo_data.append({
                    'id': weibo_id,
                    'time': time_str,
                    'content': content,
                    'likes': like_count,
                    'comments': comment_count,
                    'reposts': repost_count
                })

            except Exception as e:
                print_error(f"解析微博时出错: {str(e)}")

            pbar.update(1)

    print_success(f"微博解析完成,共获取 {len(weibo_data)} 条微博")
    return weibo_data
第二部分:数据分析与可视化
1. 分析器架构设计
这里我选用了面向对象的设计模式,创建了一个基础分析器类 BaseAnalyzer,然后各种具体的分析器都继承自这个基类。这种设计使得代码结构清晰,便于扩展和维护。
# base_analyzer.py
class BaseAnalyzer:
def __init__(self, data, output_dir):
self.data = data
self.output_dir = output_dir
self.results = {}
def analyze(self):
"""执行分析,需要在子类中实现"""
raise NotImplementedError
def visualize(self):
"""生成可视化图表,需要在子类中实现"""
raise NotImplementedError
def get_results(self):
"""返回分析结果"""
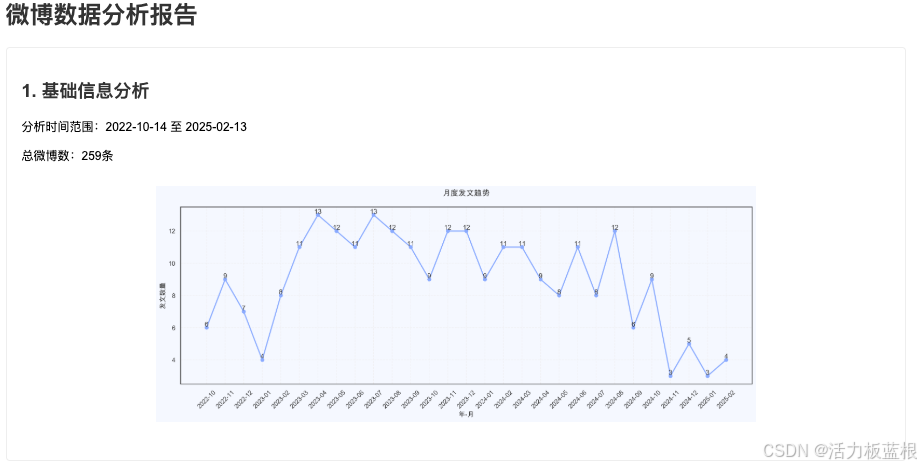
return self.results2. 基础信息分析
基础信息分析器主要分析微博的发布时间分布和互动数据统计:
# basic_info_analyzer.py
class BasicInfoAnalyzer(BaseAnalyzer):
    def analyze(self):
        # 统计总微博数
        self.results['total_posts'] = len(self.data)

        # 统计总互动数
        total_likes = sum(post['likes'] for post in self.data)
        total_comments = sum(post['comments'] for post in self.data)
        total_reposts = sum(post['reposts'] for post in self.data)

        self.results['total_interactions'] = {
            'likes': total_likes,
            'comments': total_comments,
            'reposts': total_reposts,
            'total': total_likes + total_comments + total_reposts
        }

        # 计算平均互动数
        self.results['avg_interactions'] = {
            'likes': total_likes / len(self.data) if len(self.data) > 0 else 0,
            'comments': total_comments / len(self.data) if len(self.data) > 0 else 0,
            'reposts': total_reposts / len(self.data) if len(self.data) > 0 else 0
        }

        # 分析月度发布趋势
        self.analyze_monthly_trend()

        # 分析小时级发布趋势
        self.analyze_hourly_trend()

        return self.results
3. 词频分析与词云生成
词频分析器使用jieba分词库对微博内容进行分词,然后统计词频并生成词云:
# word_analyzer.py
class WordAnalyzer(BaseAnalyzer):
    def analyze(self):
        # 合并所有微博内容
        all_content = ' '.join([post['content'] for post in self.data])

        # 使用jieba进行分词
        words = jieba.cut(all_content)

        # 过滤停用词
        filtered_words = [word for word in words if len(word) > 1 and word not in STOP_WORDS]

        # 统计词频
        word_counts = Counter(filtered_words)

        # 获取前50个高频词
        top_words = word_counts.most_common(50)

        self.results['word_frequency'] = top_words

        return self.results

    def visualize(self):
        # 生成词云
        wordcloud = WordCloud(
            font_path=FONT_PATH,
            width=800,
            height=400,
            background_color='white',
            max_words=100
        )

        # 从结果中获取词频数据
        word_freq = dict(self.results['word_frequency'])

        # 生成词云图像
        wordcloud_img = wordcloud.generate_from_frequencies(word_freq)

        # 保存词云图像
        plt.figure(figsize=(10, 5))
        plt.imshow(wordcloud_img, interpolation='bilinear')
        plt.axis('off')
        plt.tight_layout()
        plt.savefig(os.path.join(self.output_dir, 'wordcloud.png'), dpi=300)
        plt.close()

        # 生成词频柱状图
        top_20_words = self.results['word_frequency'][:20]
        words, counts = zip(*top_20_words)

        plt.figure(figsize=(12, 6))
        bars = plt.bar(words, counts, color=COLOR_SCHEME['main'])

        # 添加数据标签
        for bar in bars:
            height = bar.get_height()
            plt.text(bar.get_x() + bar.get_width()/2., height + 0.1,
                    f'{height}',
                    ha='center', va='bottom')

        plt.title('微博内容Top20高频词')
        plt.xticks(rotation=45, ha='right')
        plt.tight_layout()
        plt.savefig(os.path.join(self.output_dir, 'word_frequency.png'), dpi=300)
        plt.close()
4. 情感分析
情感分析器使用SnowNLP库对微博内容进行情感分析,判断每条微博的情感倾向:
# sentiment_analyzer.py
class SentimentAnalyzer(BaseAnalyzer):
    def analyze(self):
        # 初始化情感分类结果
        sentiment_categories = {
            'positive': [],
            'neutral': [],
            'negative': []
        }

        # 情感分数分布
        sentiment_scores = []

        # 对每条微博进行情感分析
        for post in self.data:
            content = post['content']

            # 使用SnowNLP进行情感分析
            sentiment = SnowNLP(content)
            score = sentiment.sentiments

            # 记录情感分数
            sentiment_scores.append(score)

            # 根据分数进行分类
            if score > 0.7:
                sentiment_categories['positive'].append({
                    'content': content,
                    'score': score,
                    'likes': post['likes'],
                    'time': post['time']
                })
            elif score < 0.3:
                sentiment_categories['negative'].append({
                    'content': content,
                    'score': score,
                    'likes': post['likes'],
                    'time': post['time']
                })
            else:
                sentiment_categories['neutral'].append({
                    'content': content,
                    'score': score,
                    'likes': post['likes'],
                    'time': post['time']
                })

        # 计算各类情感的占比
        total = len(self.data)
        sentiment_distribution = {
            'positive': len(sentiment_categories['positive']) / total,
            'neutral': len(sentiment_categories['neutral']) / total,
            'negative': len(sentiment_categories['negative']) / total
        }

        # 保存结果
        self.results['sentiment_categories'] = sentiment_categories
        self.results['sentiment_distribution'] = sentiment_distribution
        self.results['sentiment_scores'] = sentiment_scores

        return self.results
5. 生成HTML分析报告
最后,我们将所有分析结果整合到一个HTML报告中,方便查看和分享:
def generate_report(self):
    print_step("生成HTML分析报告")

    # 创建HTML报告
    html_content = f"""
    <!DOCTYPE html>
    <html>
    <head>
        <meta charset="UTF-8">
        <meta name="viewport" content="width=device-width, initial-scale=1.0">
        <title>微博数据分析报告 - @暹罗厘普</title>
        <style>
            body {{
                font-family: 'Helvetica Neue', Arial, sans-serif;
                line-height: 1.6;
                color: #333;
                max-width: 1200px;
                margin: 0 auto;
                padding: 20px;
                background-color: #f9f9f9;
            }}
            h1, h2, h3 {{
                color: #2c3e50;
            }}
            h1 {{
                text-align: center;
                margin-bottom: 30px;
                padding-bottom: 10px;
                border-bottom: 2px solid #3498db;
            }}
            .section {{
                background: white;
                padding: 20px;
                margin-bottom: 30px;
                border-radius: 5px;
                box-shadow: 0 2px 5px rgba(0,0,0,0.1);
            }}
            .chart-container {{
                text-align: center;
                margin: 20px 0;
            }}
            .chart {{
                max-width: 100%;
                height: auto;
                border: 1px solid #eee;
                border-radius: 5px;
            }}
            .stats {{
                display: flex;
                justify-content: space-around;
                flex-wrap: wrap;
                margin: 20px 0;
            }}
            .stat-box {{
                background: #f8f9fa;
                padding: 15px;
                border-radius: 5px;
                margin: 10px;
                min-width: 200px;
                text-align: center;
                box-shadow: 0 1px 3px rgba(0,0,0,0.1);
            }}
            .stat-value {{
                font-size: 24px;
                font-weight: bold;
                color: #3498db;
            }}
            .stat-label {{
                font-size: 14px;
                color: #7f8c8d;
            }}
            table {{
                width: 100%;
                border-collapse: collapse;
                margin: 20px 0;
            }}
            th, td {{
                padding: 12px 15px;
                text-align: left;
                border-bottom: 1px solid #ddd;
            }}
            th {{
                background-color: #f2f2f2;
            }}
            tr:hover {{
                background-color: #f5f5f5;
            }}
        </style>
    </head>
    <body>
        <h1>微博数据分析报告 - @暹罗厘普</h1>

        <!-- 基础信息部分 -->
        <div class="section">
            <h2>基础信息分析</h2>
            <div class="stats">
                <div class="stat-box">
                    <div class="stat-value">{self.basic_info_results['total_posts']}</div>
                    <div class="stat-label">总微博数</div>
                </div>
                <div class="stat-box">
                    <div class="stat-value">{self.basic_info_results['total_interactions']['likes']:,}</div>
                    <div class="stat-label">总点赞数</div>
                </div>
                <div class="stat-box">
                    <div class="stat-value">{self.basic_info_results['total_interactions']['comments']:,}</div>
                    <div class="stat-label">总评论数</div>
                </div>
                <div class="stat-box">
                    <div class="stat-value">{self.basic_info_results['total_interactions']['reposts']:,}</div>
                    <div class="stat-label">总转发数</div>
                </div>
            </div>

            <div class="chart-container">
                <h3>月度发布趋势</h3>
                <img class="chart" src="monthly_posts.png" alt="月度发布趋势">
            </div>

            <div class="chart-container">
                <h3>小时级发布趋势</h3>
                <img class="chart" src="hourly_posts.png" alt="小时级发布趋势">
            </div>
        </div>

        <!-- 其他分析部分... -->

    </body>
    </html>
    """

    # 保存HTML报告
    report_path = os.path.join(self.output_dir, 'analysis_report.html')
    with open(report_path, 'w', encoding='utf-8') as f:
        f.write(html_content)

    print_success(f"HTML分析报告已生成: {report_path}")
实际分析成果展示
在这里也简单展示一些对@暹罗厘普微博账号的数据分析成果。
常见问题与解决方案
在项目实施过程中,你可能会遇到以下常见问题,这里也有一些相应的解决方案供大家参考。
1. 爬虫相关问题
问题1:微博反爬机制导致爬虫被封
解决方案:
-
添加随机等待时间,模拟人类浏览行为
-
使用代理IP轮换
-
设置合理的User-Agent
-
减少爬取频率和单次爬取数量
# 添加随机等待时间
time.sleep(random.uniform(1.5, 3.0))

# 使用代理IP
proxies = {
    'http': 'http://your_proxy_ip:port',
    'https': 'https://your_proxy_ip:port'
}
问题2:Selenium无法定位元素
解决方案:
-
使用显式等待,确保元素加载完成
-
尝试不同的定位方式(XPath, CSS选择器等)
-
检查元素是否在iframe中
# 使用显式等待
element = WebDriverWait(driver, 10).until(
    EC.presence_of_element_located((By.CSS_SELECTOR, '.card-wrap'))
)

# 尝试不同的定位方式
element = driver.find_element(By.XPATH, '//div[contains(@class, "card-wrap")]')
2. 数据处理问题
问题1:微博时间格式解析错误
解决方案:
-
处理多种时间格式("刚刚"、"x分钟前"、"今天xx:xx"、具体日期等)
-
使用正则表达式匹配不同格式
def parse_weibo_time(time_str):
    now = datetime.now()

    if '刚刚' in time_str:
        return now
    elif '分钟前' in time_str:
        minutes = int(re.search(r'(\d+)分钟前', time_str).group(1))
        return now - timedelta(minutes=minutes)
    elif '今天' in time_str:
        hour, minute = re.search(r'今天\s*(\d+):(\d+)', time_str).groups()
        return now.replace(hour=int(hour), minute=int(minute), second=0, microsecond=0)
    # 处理其他格式...
问题2:中文分词效果不理想
解决方案:
-
添加自定义词典,提高特定领域词汇的识别率
-
使用停用词表过滤无意义词汇
-
尝试不同的分词工具(如HanLP、pkuseg等)
# 添加自定义词典
jieba.load_userdict('custom_dict.txt')

# 使用停用词表
with open('stopwords.txt', 'r', encoding='utf-8') as f:
    stop_words = set([line.strip() for line in f])
3. 可视化问题
问题1:中文字体显示为方块
解决方案:
-
设置matplotlib使用支持中文的字体
-
在系统中安装中文字体并在代码中指定
# 设置中文字体
plt.rcParams['font.sans-serif'] = ['SimHei']  # 设置默认字体为黑体
plt.rcParams['axes.unicode_minus'] = False  # 解决保存图像时负号'-'显示为方块的问题

# 或者指定特定字体
font_path = 'path/to/your/chinese/font.ttf'  # 例如:'C:/Windows/Fonts/simhei.ttf'
font_prop = FontProperties(fname=font_path)
plt.title('标题', fontproperties=font_prop)
问题2:图表美观度不够
解决方案:
-
使用专业的配色方案
-
添加适当的标题、标签和图例
-
调整图表大小和布局
-
考虑使用更专业的可视化库(如Plotly、Seaborn等)
# 使用Seaborn提升美观度
import seaborn as sns
sns.set_theme(style="whitegrid", palette="pastel")

# 设置图表大小和DPI
plt.figure(figsize=(12, 6), dpi=300)

# 添加网格线
plt.grid(True, linestyle='--', alpha=0.7)
总结
通过这个项目,我们实现了一个完整的微博数据分析系统,从数据爬取到多维度分析和可视化展示全流程跑了一遍。
其实这种分析在很多地方都可以应用到,不仅适用于单个账号的纵向深度研究,也可以扩展到行业生态的横向对比分析,有效地挖掘社交媒体数据中的价值,帮助我们理解用户行为和内容效果。
欢迎大家在实际使用中持续迭代优化,有啥问题评论区沟通!
参考资料


 3065
3065

 被折叠的 条评论
为什么被折叠?
被折叠的 条评论
为什么被折叠?
 到【灌水乐园】发言


