


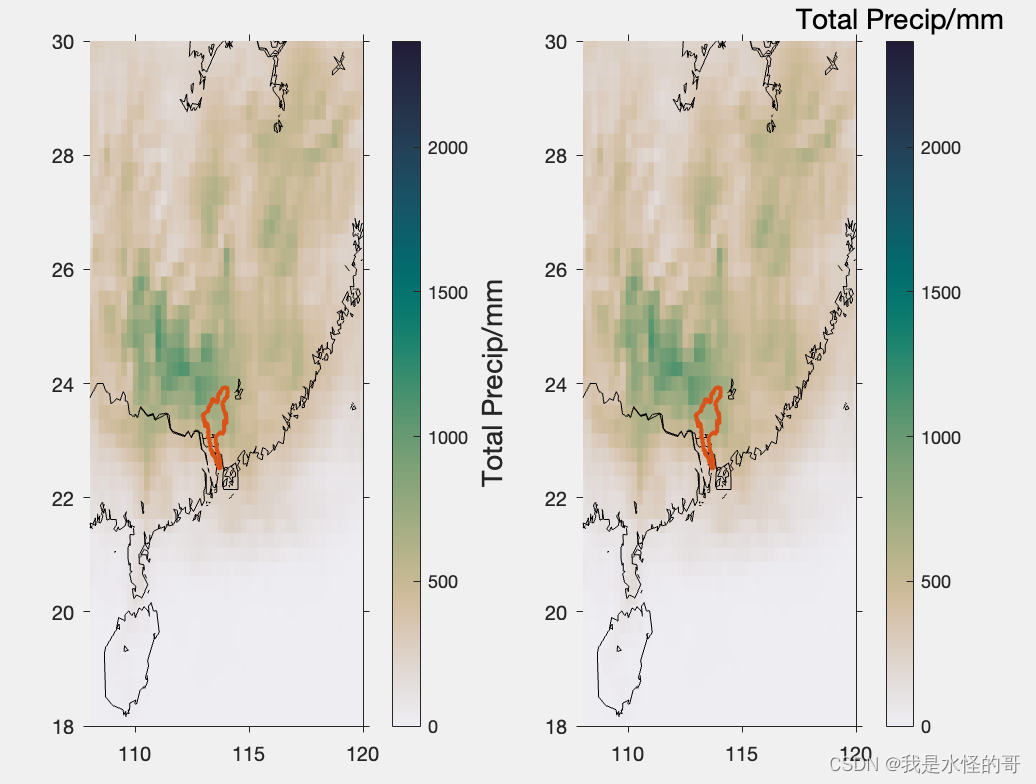
%% label colorbar
subplot(1,2,1)
rg_plot(era_tp,total_all*1000) % mm
hold on
plot(lon2,lat2,'LineWidth',2)
xlim([108,120])
ylim([18,30])
cmap = cmocean('rain');
colormap(cmap)
my_handle=colorbar;
my_handle.Label.String = 'Total Precip/mm';
my_handle.Label.FontSize = 14;
subplot(1,2,2)
rg_plot(era_tp,total_all*1000) % mm
hold on
plot(lon2,lat2,'LineWidth',2)
xlim([108,120])
ylim([18,30])
cmap = cmocean('rain');
colormap(cmap)
my_handle=colorbar;
my_handle.Title.String = 'Total Precip/mm';
my_handle.Title.FontSize = 14;
效果:
❤️欢迎点赞收藏❤️


 8225
8225

 被折叠的 条评论
为什么被折叠?
被折叠的 条评论
为什么被折叠?
 到【灌水乐园】发言


