


文章目录
1.About check_mk metric:ORA_ORCL_Active_Session
This is a custom monitoring metric on check_mk platform,
the threshold is defined in /usr/lib/check_mk_oracle/MAIN/conf1/perf_ORCL_act_session.json
{"target_info":[{
"perf_min":"0",
"chk_interval":5000,
"output_cmd":"echo",
"post_action":"",
"perf_crit":"70",
"chk_cmd":"sh run_active_session.sh",
"perf_max":"0",
"chk_result_separator":";",
"perf_warn":"50",
"database":"ORCL"
}]}
notice the two threshold value:“perf_warn”:“50”,“perf_crit”:“70”,mean total number of active concurrent sessions , which will trigger warning alarm and trigger critical alarm if reach the threshold respectively.
2.Solution
2.1get the total number of active concurrent sessions
you can check total number of active concurrent sessions by the following sql statement:
SELECT COUNT(1)  FROM V$SESSION WHERE STATUS = 'ACTIVE';
or
SELECT *   FROM V$SESSION WHERE STATUS = 'ACTIVE';
2.2 the possible reason for this:
2.2.1.High connection for normal behavior that happens occasionally
For tthis, In a certain period of time, for some reason, there may suddenly be many users connected to the database, but this is just a high number of connections, usually without any blocking or resource competition
so, you need to adjust the critical and warning threshold by editing/usr/lib/check_mk_oracle/MAIN/conf1/perf_ORCL_act_session.json
the sql statement will help you to get max connections(max_utilization) that ever reached, you can adjust your new threshold according to the value
select * from v$resource_limit where resource_name in ('sessions')

2.2.2.resource competition
this is a very complex issue, need to make different analysis depend on different scenarios
here is only a referrence:
usually, the high resource competition will be along with session blocking, according to the guideline, You can get which sessions are blocking other sessions through the following sql:
select to_char(sample_time,'YYYY-MM-DD HH24') "YYYYMMDD HH24",session_id,blocking_session
from DBA_HIST_ACTIVE_SESS_HISTORY where to_char(sample_time,'YYYY-MM-DD HH24:MI')
Between '2023-04-08 11:00' and '2023-04-08 12:00'
and blocking_session is not null
the output will be:
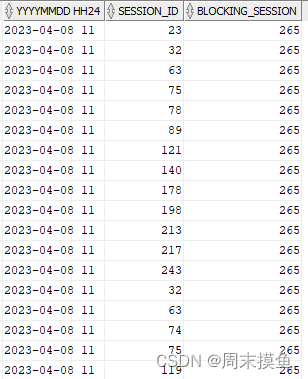
many sessions were blocking by session 265, so You can dig into what’s happening on session 265 by the following sql statement:
select SESSION_ID,BLOCKING_SESSION,EVENT,session_state,time_waited/1000 time_waited_in_ms
from DBA_HIST_ACTIVE_SESS_HISTORY where to_char(sample_time,'YYYY-MM-DD HH24:MI')
Between '2023-04-08 11:00' and '2023-04-08 12:00' and session_id=265
the output will be:
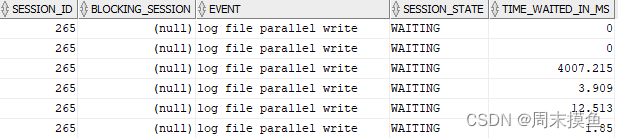
you can found that session 265 is being stuck on wait event “log file parallel write”, this is a wait event about disk IO, so you can improve this putting logfile on more faster device or reducing the log generation volume
of cause, This is just a way to tell you how to deal with this type of problem,In actual work, many other waiting events may be encountered, you need to make different solution to different wait event


 285
285


 被折叠的 条评论
为什么被折叠?
被折叠的 条评论
为什么被折叠?
 到【灌水乐园】发言


