


#总结这是纯显示分组的最佳方法
d2 = df.groupby('id').apply(lambda x:x[:]).drop(axis=1,columns='id',inplace=False)
d2 # 最佳方法; just modify df itself,inplace=True
纯显示分组是这样最好,但建议不要.drop(axis=1,columns=‘id’,inplace=False) ,因为做针对性查询的时候会有麻烦。详情可搜索该行代码及看其前后:
d3 = df.groupby(‘id’).apply(lambda x:x[:])
此外别误以为groupby会自动对每组的数字求和,求和还得加.sum([])。df.groupby(‘id’).first() 真的只会取每组的第一行记录,所以要小心使用,避免漏掉其余行的数据。
import pandas as pd
d = {'id':[1,1,2,3,3,4,3,4,1,5],'product':['p2','p1','p3','p2','p1','p3','p4','p5','p6','p5']}
df = pd.DataFrame.from_dict(d).reset_index(drop=True) # .reset_index(drop=True) 只能对index重置,无法删除
df
out:
	id 	product
0 	1 	p2
1 	1 	p1
2 	2 	p3
3 	3 	p2
4 	3 	p1
5 	4 	p3
6 	3 	p4
7 	4 	p5
8 	1 	p6
9 	5 	p5
#############
# 想以dataframe形式来展示,这不够好看
for i,j in df.groupby('id'):
    print(i,j)
out:
1    id product
0   1      p2
1   1      p1
8   1      p6
2    id product
2   2      p3
3    id product
3   3      p2
4   3      p1
6   3      p4
4    id product
5   4      p3
7   4      p5
5    id product
9   5      p5
d2 = df.groupby('id').apply(lambda x:x[:]).drop(axis=1,columns='id',inplace=False)
d2 # 最佳方法
 		product
id
1 	0 	p2
	1 	p1
	8 	p6
2 	2 	p3
3 	3 	p2
	4 	p1
	6 	p4
4 	5 	p3
	7 	p5
5 	9 	p5
d2.index
out:
MultiIndex([(1, 0),
            (1, 1),
            (1, 8),
            (2, 2),
            (3, 3),
            (3, 4),
            (3, 6),
            (4, 5),
            (4, 7),
            (5, 9)],
           names=['id', None])
d2[d2.index=='3'] # can't find anything
 		product
id
d3 =  df.groupby('id').apply(lambda x:x[:])
d3 # d3[d3.index=='3'] still can't find anythings,but I can find it in cloumns='id'
 		id 	product
id
1 	0 	1 	p2
	1 	1 	p1
	8 	1 	p6
2 	2 	2 	p3
3 	3 	3 	p2
	4 	3 	p1
	6 	3 	p4
4 	5 	4 	p3
	7 	4 	p5
5 	9 	5 	p5
d3[d3['id']==3] # type(id) is int, but id as index,you have to find it in str '3';
 		id 	product
id
3 	3 	3 	p2
	4 	3 	p1
	6 	3 	p4
# 看可否去掉index来优化显示
df2.to_excel('aa.xlsx',engine='openpyxl',index=False)
excel:
from IPython.display import HTML
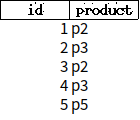
HTML(df2.to_html(index=False)) # 发现只要把index去掉都会导致每组只显示一个元素,此外index可反映对应元素的下标,所以去掉它的意义不大。
id 	product
1 	p2
2 	p3
3 	p2
4 	p3
5 	p5
df3 = df.groupby('id').head(2) # 当.head(n)的 n=1,展示的数组和df.groupby('id').first()一样,但格式稍有区别,
# 它只是取每种类型的前n个,而非分组后再取前n个(不作分组归类,别以为goupby就一定归类)
# 我为该程序单独用d = {'id':[1,1,2,3,3,4,3,4,1,5,2],'product':['p2','p1','p3','p2','p1','p3','p4','p5','p6','p5','p8']}
df3
 	id 	product
0 	1 	p2
1 	1 	p1
2 	2 	p3
3 	3 	p2
4 	3 	p1
5 	4 	p3
7 	4 	p5
9 	5 	p5
10 	2 	p8
#############
d_first = df.groupby('id').first() # 取出各分组第一个元素作展示
d_first
out:
 	product
id
1 	p2
2 	p3
3 	p2
4 	p3
5 	p5
df3 == df_first # 拓展一下,这2表看似相同,但表结构有差异(df_first被看作id为索引的表,
# 而df3.index会报错 'HTML' object has no attribute 'index'),所以不等。
out:
 	product
id
1 	False
2 	False
3 	False
4 	False
5 	False
d_last = df.groupby('id').last() #  取出各分组倒数第一个元素作展示
d_last
out:
 	product
id
1 	p6
2 	p3
3 	p4
4 	p5
5 	p5


 541
541


 被折叠的 条评论
为什么被折叠?
被折叠的 条评论
为什么被折叠?
 到【灌水乐园】发言


