


目录
1 进程和内存管理
内核功用:进程管理、内存管理、文件系统、网络功能、驱动程序、安全功能等
 1.1 什么是进程
Process: 运行中的程序的一个副本,是被载入内存的一个指令集合,是资源分配的单位
进程ID(Process ID,PID)号码被用来标记各个进程
UID、GID、和SELinux语境决定对文件系统的存取和访问权限
通常从执行进程的用户来继承
存在生命周期
进程创建:
init:第一个进程,从 CentOS7 以后为systemd
进程:都由其父进程创建,fork(),父子关系,CoW:Copy On Write
进程,线程
进程:
进程是一个具有一定独立功能的程序在一个数据集上的一次动态执行的过程,是操作系统进行资源分配和调度的一个独立单位,是应用程序运行的载体。进程是一种抽象的概念,从来没有统一的标准定义。
进程的组成
进程一般由程序、数据集合和进程控制块三部分组成。
程序用于描述进程要完成的功能,是控制进程执行的指令集;
数据集合是程序在执行时所需要的数据和工作区;
程序控制块(Program Control Block,简称PCB),包含进程的描述信息和控制信息,是进程存在的唯一标志。
进程具有的特征:
动态性:进程是程序的一次执行过程,是临时的,有生命期的,是动态产生,动态消亡的;
并发性:任何进程都可以同其他进程一起并发执行;
独立性:进程是系统进行资源分配和调度的一个独立单位;
结构性:进程由程序、数据和进程控制块三部分组成。
线程:
在早期的操作系统中并没有线程的概念,进程是能拥有资源和独立运行的最小单位,也是程序执行的最小单位。任务调度采用的是时间片轮转的抢占式调度方式,而进程是任务调度的最小单位,每个进程有各自独立的一块内存,使得各个进程之间内存地址相互隔离。
后来,随着计算机的发展,对CPU的要求越来越高,进程之间的切换开销较大,已经无法满足越来越复杂的程序的要求了。于是就发明了线程。
线程是程序执行中一个单一的顺序控制流程,是程序执行流的最小单元,是处理器调度和分派的基本单位。一个进程可以有一个或多个线程,各个线程之间共享程序的内存空间(也就是所在进程的内存空间)。一个标准的线程由线程ID、当前指令指针(PC)、寄存器和堆栈组成。而进程由内存空间(代码、数据、进程空间、打开的文件)和一个或多个线程组成。
进程与线程的区别
线程是程序执行的最小单位,而进程是操作系统分配资源的最小单位;
一个进程由一个或多个线程组成,线程是一个进程中代码的不同执行路线;
进程之间相互独立,但同一进程下的各个线程之间共享程序的内存空间(包括代码段、数据集、堆等)及一些进程级的资源(如打开文件和信号),某进程内的线程在其它进程不可见;
调度和切换:线程上下文切换比进程上下文切换要快得多。
协程和线程的比较

#查看进程中的线程:
grep -i threads /proc/PID/status
1.2 进程结构
内核把进程存放在叫做任务队列(task list)的双向循环链表中
链表中的每一项都是类型为task_struct,称为进程控制块(Processing Control Block),PCB中包含一个具体进程的所有信息


进程控制块PCB包含信息:
进程id、用户id和组id
程序计数器
进程的状态(有就绪、运行、阻塞)
进程切换时需要保存和恢复的CPU寄存器的值
描述虚拟地址空间的信息
描述控制终端的信息
当前工作目录
文件描述符表,包含很多指向file结构体的指针
进程可以使用的资源上限(ulimit –a命令可以查看)
输入输出状态:配置进程使用I/O设备
1.3 进程相关概念
#Page Frame: 页框,用存储页面数据,存储Page 4k
[root@centos8 ~]#getconf -a |grep -i size
PAGESIZE              4096
PAGE_SIZE              4096
SSIZE_MAX              32767
_POSIX_SSIZE_MAX          32767
_POSIX_THREAD_ATTR_STACKSIZE    200809
FILESIZEBITS            64
POSIX_ALLOC_SIZE_MIN        4096
POSIX_REC_INCR_XFER_SIZE
POSIX_REC_MAX_XFER_SIZE
POSIX_REC_MIN_XFER_SIZE       4096
LEVEL1_ICACHE_SIZE         65536
LEVEL1_ICACHE_LINESIZE       64
LEVEL1_DCACHE_SIZE         32768
LEVEL1_DCACHE_LINESIZE       64
LEVEL2_CACHE_SIZE          524288
LEVEL2_CACHE_LINESIZE        64
LEVEL3_CACHE_SIZE          16777216
LEVEL3_CACHE_LINESIZE        64
LEVEL4_CACHE_SIZE          0
LEVEL4_CACHE_LINESIZE        0
1.3.1 物理地址空间和虚拟地址空间
MMU:Memory Management Unit 负责虚拟地址转换为物理地址
程序在访问一个内存地址指向的内存时,CPU不是直接把这个地址送到内存总线上,而是被送到MMU
(Memory Management Unit),然后把这个内存地址映射到实际的物理内存地址上,然后通过总线再去访问内存,程序操作的地址称为虚拟内存地址
TLB:Translation Lookaside Buffer 翻译后备缓冲区,用于保存虚拟地址和物理地址映射关系的缓存

1.3.2 用户和内核空间

1.3.3 C代码和内存布局之间的对应关系

每个进程都包括5种不同的数据段:
代码段:用来存放可执行文件的操作指令,也就是说是它是可执行程序在内存中的镜像。代码段需要防止在运行时被非法修改,所以只准许读取操作,而不允许写入(修改)操作——它是不可写的
数据段:用来存放可执行文件中已初始化全局变量,换句话说就是存放程序静态分配的变量和全局变量
BSS段:Block Started by Symbol”的缩写,意为“以符号开始的块,BSS段包含了程序中未初始化的全局变量,在内存中 bss段全部置零
堆(heap):存放数组和对象,堆是用于存放进程运行中被动态分配的内存段,它的大小并不固定,可动态扩张或缩减。当进程调用malloc等函数分配内存时,新分配的内存就被动态添加到堆上(堆被扩张);当利用free等函数释放内存时,被释放的内存从堆中被剔除(堆被缩减)
栈(stack):栈是用户存放程序临时创建的局部变量,也就是说我们函数括弧“{}”中定义的变量(但不包括static声明的变量,static意味着在数据段中存放变量)。除此以外,在函数被调用时,其参数也会被压入发起调用的进程栈中,并且待到调用结束后,函数的返回值也会被存放回栈中。由于栈的后进先出特点,所以栈特别方便用来保存/恢复调用现场。可以把堆栈看成一个寄存、交换临时数据的内存区
喝多了吐就是栈
吃多了拉就是队列

1.3.4 进程使用内存问题
1.3.4.1 内存泄漏:Memory Leak
指程序中用malloc或new申请了一块内存,但是没有用free或delete将内存释放,导致这块内存一直处于占用状态
1.3.4.2 内存溢出:Memory Overflow
指程序申请了10M的空间,但是在这个空间写入10M以上字节的数据,就是溢出,类似红杏出墙(N50学炳语录)
1.3.4.3 内存不足:OOM
OOM 即 Out Of Memory,“内存用完了”,在情况在java程序中比较常见。系统会选一个进程将之杀死,在日志messages中看到类似下面的提示
Jul 10 10:20:30 kernel: Out of memory: Kill process 9527 (java) score 88 or sacrifice child
当JVM因为没有足够的内存来为对象分配空间并且垃圾回收器也已经没有空间可回收时,就会抛出这个error,因为这个问题已经严重到不足以被应用处理)。
原因:
给应用分配内存太少:比如虚拟机本身可使用的内存(一般通过启动时的VM参数指定)太少。
应用用的太多,并且用完没释放,浪费了。此时就会造成内存泄露或者内存溢出。
使用的解决办法:
1,限制java进程的max heap,并且降低java程序的worker数量,从而降低内存使用
2,给系统增加swap空间

#设置内核参数(不推荐),不允许内存申请过量:
echo 2 > /proc/sys/vm/overcommit_memory
echo 80 > /proc/sys/vm/overcommit_ratio
echo 2 > /proc/sys/vm/panic_on_oom


#说明:
Linux默认是允许memory overcommit的,只要你来申请内存我就给你,寄希望于进程实际上用不到那
么多内存,但万一用到那么多了呢?Linux设计了一个OOM killer机制挑选一个进程出来杀死,以腾出部
分内存,如果还不够就继续。也可通过设置内核参数 vm.panic_on_oom 使得发生OOM时自动重启系
统。这都是有风险的机制,重启有可能造成业务中断,杀死进程也有可能导致业务中断。所以Linux 2.6
之后允许通过内核参数 vm.overcommit_memory 禁止memory overcommit。


#vm.overcommit_memory 接受三种取值:
0 – Heuristic overcommit handling. 这是缺省值,它允许overcommit,但过于明目张胆的
overcommit会被拒绝,比如malloc一次性申请的内存大小就超过了系统总内存。Heuristic的意思是“试探
式的”,内核利用某种算法猜测你的内存申请是否合理,它认为不合理就会拒绝overcommit。
1 – Always overcommit. 允许overcommit,对内存申请来者不拒。内核执行无内存过量使用处理。使
用这个设置会增大内存超载的可能性,但也可以增强大量使用内存任务的性能。
2 – Don’t overcommit. 禁止overcommit。 内存拒绝等于或者大于总可用 swap 大小以及
overcommit_ratio 指定的物理 RAM 比例的内存请求。如果希望减小内存过度使用的风险,这个设置就是
最好的。
1.4 进程状态

进程的基本状态
创建状态:进程在创建时需要申请一个空白PCB(process control block进程控制块),向其中填写控制和管理进程的信息,完成资源分配。如果创建工作无法完成,比如资源无法满足,就无法被调度运行,把此时进程所处状态称为创建状态
就绪状态:进程已准备好,已分配到所需资源,只要分配到CPU就能够立即运行
执行状态:进程处于就绪状态被调度后,进程进入执行状态
阻塞状态:正在执行的进程由于某些事件(I/O请求,申请缓存区失败)而暂时无法运行,进程受到阻塞。在满足请求时进入就绪状态等待系统调用
终止状态:进程结束,或出现错误,或被系统终止,进入终止状态。无法再执行
状态之间转换六种情况
运行——>就绪:1,主要是进程占用CPU的时间过长,而系统分配给该进程占用CPU的时间是有限的;
2,在采用抢先式优先级调度算法的系统中,当有更高优先级的进程要运行时,该进程就被迫让出CPU,该进程便由执行状态转变为就绪状态
就绪——>运行:运行的进程的时间片用完,调度就转到就绪队列中选择合适的进程分配CPU
运行——>阻塞:正在执行的进程因发生某等待事件而无法执行,则进程由执行状态变为阻塞状态,如发生了I/O请求
阻塞——>就绪:进程所等待的事件已经发生,就进入就绪队列
以下两种状态是不可能发生的:
阻塞——>运行:即使给阻塞进程分配CPU,也无法执行,操作系统在进行调度时不会从阻塞队列进行挑选,而是从就绪队列中选取
就绪——>阻塞:就绪态根本就没有执行,谈不上进入阻塞态
运行态:running
就绪态:ready
睡眠态:分为两种,可中断:interruptable,不可中断:uninterruptable
停止态:stopped,暂停于内存,但不会被调度,除非手动启动
僵死态:zombie,僵尸态,结束进程,父进程结束前,子进程不关闭,杀死父进程可以关闭僵死态的子进程进程更多的状态:
#例:僵尸态
[root@centos8 ~]#bash
[root@centos8 ~]#echo $BASHPID
1809
[root@centos8 ~]#echo $PPID
1436

#将父进程设为停止态
[root@centos8 ~]#kill -19 1436

#杀死子进程,使其进入僵尸态
[root@centos8 ~]#kill -9 1809
[root@centos8 ~]#ps aux #可以看到上面图示的结果,STAT为Z,表示为僵尸态

#方法1:恢复父进程
[root@centos8 ~]#kill -18 1436

#方法2:杀死父进程
[root@centos8 ~]#kill -9 1436

#再次观察,可以僵尸态的进程不存在了
[root@centos8 ~]#ps aux
1.5 LRU 算法
LRU:Least Recently Used 近期最少使用算法(喜新厌旧),释放内存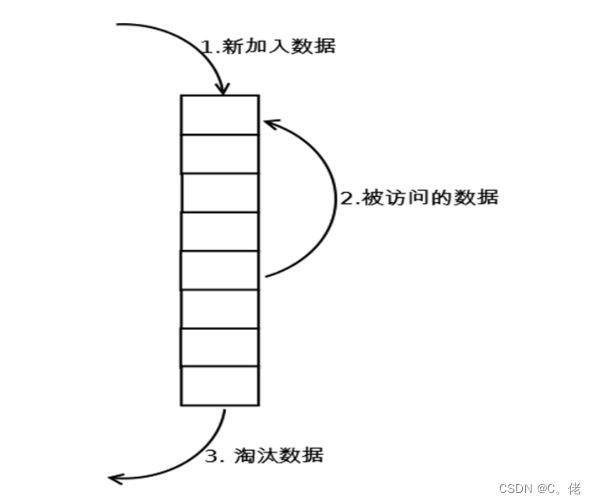
#例:
假设序列为 4 3 4 2 3 1 4 2, 物理块有3个,则
第1轮 4调入内存 4
第2轮 3调入内存 3 4
第3轮 4调入内存 4 3
第4轮 2调入内存 2 4 3
第5轮 3调入内存 3 2 4
第6轮 1调入内存 1 3 2
第7轮 4调入内存 4 1 3
第8轮 2调入内存 2 4 1
1.6 IPC 进程间通信
IPC: Inter Process Communication
#同一主机:
pipe     管道,单向传输
socket       套接字文件,双工通信
Memory-maped file      文件映射,将文件中的一段数据映射到物理内存,多个进程共享这片内存
shm shared memory     共享内存
signal     信号
Lock       对资源上锁,如果资源已被某进程锁住,则其它进程想修改甚至读取这些资源,都将被阻
塞,直到锁被打开
semaphore     信号量,一种计数器


#不同主机:socket=IP和端口号
RPC remote procedure call
MQ 消息队列,生产者和消费者,如:Kafka,RabbitMQ,ActiveMQ


#例:利用管道文件实现 IPC
[root@centos8 ~]#mkfifo /data/test.fifo
[root@centos8 ~]#ll /data/test.fifo
prw-r--r-- 1 root root 0 May  6 14:32 /data/test.fifo
[root@centos8 ~]#cat > /data/test.fifo
xinxin

#在另一个终端可以从文件中读取数据
[root@centos8 ~]#cat /data/test.fifo
xinxin


#例:查找 socket文件
[root@centos8 ~]#find / -type s -ls
1.7 进程优先级

CentOS 优先级

#进程优先级:
系统优先级:0-139, 数字越小,优先级越高,各有140个运行队列和过期队列
实时优先级: 99-0  值最大优先级最高
nice值:-20到19,对应系统优先级100-139或
Big O:时间(空间)复杂度,用时(空间)和规模的关系
O(1), O(logn), O(n)线性, O(n^2)抛物线, O(2^n)1.8 进程分类
操作系统分类:
协作式多任务:早期 windows 系统使用,即一个任务得到了 CPU 时间,除非它自己放弃使用CPU ,否则将完全霸占 CPU ,所以任务之间需要协作——使用一段时间的 CPU ,主动放弃使用
抢占式多任务:Linux内核,CPU的总控制权在操作系统手中,操作系统会轮流询问每一个任务是否需要使用 CPU ,需要使用的话就让它用,不过在一定时间后,操作系统会剥夺当前任务的 CPU使用权,把它排在询问队列的最后,再去询问下一个任务
进程类型:
守护进程: daemon,在系统引导过程中启动的进程,和终端无关进程
前台进程:跟终端相关,通过终端启动的进程
注意:两者可相互转化
按进程资源使用的分类:
CPU-Bound:CPU 密集型,非交互
IO-Bound:IO 密集型,交互
2 进程管理和性能相关工具
参考链接:http://www.brendangregg.com/linuxperf.html

#Linux系统状态的查看及管理工具:
pstree
ps
pidof
pgrep
top
htop
glance
pmap
vmstat
dstat
kill
pkill
job
bg
fg
nohup
2.1 进程树 pstree
pstree 可以用来显示进程的父子关系,以树形结构显示
#格式:
pstree  [OPTION] [ PID | USER ]


#常用选项:
-p 显示PID
-T 不显示线程thread,默认显示线程
-u 显示用户切换
-H pid 高亮显示指定进程及其前辈进程


#例
[root@centos8 ~]#pstree 1
systemd─┬─NetworkManager───2*[{NetworkManager}]
   ├─VGAuthService
   ├─agetty
   ├─atd
   ├─auditd───{auditd}
   ├─automount───4*[{automount}]
   ├─crond
   ├─dbus-daemon
   ├─httpd─┬─httpd
   │    ├─2*[httpd───64*[{httpd}]]
   │    └─httpd───80*[{httpd}]
   ├─irqbalance───{irqbalance}
   ├─php-fpm───5*[php-fpm]
   ├─polkitd───11*[{polkitd}]
   ├─rngd───{rngd}
   ├─rsyslogd───2*[{rsyslogd}]
   ├─sshd───sshd───sshd─┬─bash───pstree
   │          └─bash───su───bash───ping
   ├─sssd─┬─sssd_be
   │   └─sssd_nss
   ├─systemd───(sd-pam)
   ├─systemd-journal
   ├─systemd-logind
   ├─systemd-udevd
   ├─tuned───3*[{tuned}]
   └─vmtoolsd───{vmtoolsd}

[root@centos8 ~]#pstree liang
bash───ping
[root@centos8 ~]#pstree -T
systemd─┬─NetworkManager
   ├─VGAuthService
   ├─agetty
   ├─atd
   ├─auditd
   ├─automount
   ├─crond
   ├─dbus-daemon
   ├─httpd───4*[httpd]
   ├─irqbalance
   ├─php-fpm───5*[php-fpm]
   ├─polkitd
   ├─rngd
   ├─rsyslogd
   ├─sshd───sshd───sshd─┬─bash───pstree
   │          └─bash───su───bash───ping
   ├─sssd─┬─sssd_be
   │   └─sssd_nss
   ├─systemd───(sd-pam)
   ├─systemd-journal
   ├─systemd-logind
   ├─systemd-udevd
   ├─tuned
   └─vmtoolsd


[root@centos8 ~]#pstree -pT
systemd(1)─┬─NetworkManager(788)
     ├─VGAuthService(783)
     ├─agetty(889)
     ├─atd(874)
     ├─auditd(756)
     ├─automount(864)
     ├─crond(875)
     ├─dbus-daemon(787)
     ├─httpd(18386)─┬─httpd(18392)
     │       ├─httpd(18393)
     │       ├─httpd(18394)
     │       └─httpd(18395)
     ├─irqbalance(785)
     ├─php-fpm(18385)─┬─php-fpm(18387)
     │        ├─php-fpm(18388)
     │        ├─php-fpm(18389)
     │        ├─php-fpm(18390)
     │        └─php-fpm(18391)
     ├─polkitd(782)
     ├─rngd(786)
     ├─rsyslogd(868)
     ├─sshd(805)───sshd(1053)───sshd(1224)─┬─bash(1251)───pstree(18864)
     │
└─bash(18789)───su(18812)───bash(18813)───ping(18842)
     ├─sssd(789)─┬─sssd_be(821)
     │      └─sssd_nss(832)
     ├─systemd(1189)───(sd-pam)(1192)
     ├─systemd-journal(635)
     ├─systemd-logind(858)
     ├─systemd-udevd(670)
     ├─tuned(802)
     └─vmtoolsd(784)


[root@centos8 ~]#pstree -u
systemd─┬─NetworkManager───2*[{NetworkManager}]
   ├─VGAuthService
   ├─agetty
   ├─atd
   ├─auditd───{auditd}
   ├─automount───4*[{automount}]
   ├─crond
   ├─dbus-daemon(dbus)
   ├─httpd─┬─httpd(apache)
   │    ├─2*[httpd(apache)───64*[{httpd}]]
   │    └─httpd(apache)───80*[{httpd}]
   ├─irqbalance───{irqbalance}
   ├─php-fpm───5*[php-fpm(apache)]
   ├─polkitd(polkitd)───11*[{polkitd}]
   ├─rngd───{rngd}
   ├─rsyslogd───2*[{rsyslogd}]
   ├─sshd───sshd───sshd─┬─bash───pstree
   │          └─bash───su───bash(liang)───ping
   ├─sssd─┬─sssd_be
   │   └─sssd_nss
   ├─systemd───(sd-pam)
   ├─systemd-journal
   ├─systemd-logind
   ├─systemd-udevd
   ├─tuned───3*[{tuned}]
   └─vmtoolsd───{vmtoolsd}


#例:高亮显示前辈进程
[root@centos8 ~]#pstree -pH 858
2.2 进程信息 ps
ps 即 process state,可以进程当前状态的快照,默认显示当前终端中的进程,Linux系统各进程的相关信息均保存在/proc/PID目录下的各文件中
#格式:
ps [OPTION]...


#支持三种选项:
UNIX选项 如: -A -e
GNU选项 如: --help
BSD选项 如: a


#常用选项:
a     选项包括所有终端中的进程,除会话引线外;
x     选项包括不链接终端的进程;
u     选项显示进程所有者的信息及内存的使用情况;
e      显示所有进程,相当于-A
l      长格式显示更加详细的信息;
f     选项显示进程树,相当于 --forest
k|--sort     属性 对属性排序,属性前加 - 表示倒序
o     属性… 选项显示定制的信息 pid、cmd、%cpu、%mem
L     显示支持的属性列表
-C     cmdlist 指定命令,多个命令用,分隔
-L     显示线程

-f     显示完整格式程序信息
-F     显示更完整格式的进程信息
-H     以进程层级格式显示进程相关信息
-u     userlist 指定有效的用户ID或名称
-U     userlist 指定真正的用户ID或名称
-g     gid或groupname 指定有效的gid或组名称
-G     gid或groupname 指定真正的gid或组名称
-p     pid 显示指pid的进程
--ppid pid     显示属于pid的子进程
-t     ttylist 指定tty,相当于 t
-M     显示SELinux信息,相当于Z


#常用组合:
-aux
-ef
-eFH
-eo pid,tid,class,rtprio,ni,pri,psr,pcpu,stat,comm
axo stat,euid,ruid,tty,tpgid,sess,pgrp,ppid,pid,pcpu,comm

"ps aux" 可以查看系统中所有的进程;
"ps -le" 可以查看系统中所有的进程,而且还能看到进程的父进程的 PID 和进程优先级;
"ps -l" 只能看到当前 Shell 产生的进程;


#显示所有包含其他使用者的进程
ps -aux


#查看CPU/内存占用率最高的进程
#查看进程的时候,让进程按照CPU使用率排序,然后展示前10行,就能清晰地看到哪些进程占用的资源比较多。
PS1:head -11 是因为标题也算一行
PS2:+、-号可以调整排序,-pcpu 表示降序,+pcpu 表示升序
ps -aux --sort=-pcpu | head -11


#同理,把 -pcpu 换成 -pmem,就能查看内存使用最多的10个进程。
ps -aux --sort=-pmem | head -11


#如果不限制行数,也可以使用 sort 按照指定的列排序
降序:ps -aux | sort -nk 4 -r
升序:ps -aux | sort -nk 4


#ps 输出属性
C :  ps -ef 显示列 C 表示cpu利用率
VSZ: Virtual memory SiZe,虚拟内存集,线性内存
RSS: ReSident Size, 常驻内存集
STAT:进程状态
R:running
S: interruptable sleeping
D: uninterruptable sleeping
T: stopped
Z: zombie
+: 前台进程
l: 多线程进程
L:内存分页并带锁
N:低优先级进程
<: 高优先级进程
s: session leader,会话(子进程)发起者
I:Idle kernel thread,CentOS 8 新特性
ni: nice值
pri: priority 优先级
rtprio: 实时优先级
psr: processor CPU编号


#例:
ps axo pid,cmd,psr,ni,pri,rtprio


#例:查看进程详细信息
# 列 C 表示 CPU利用率
[root@centos7 ~]#ps -le
F S   UID    PID   PPID  C PRI  NI ADDR SZ WCHAN  TTY          TIME CMD
4 S     0      1      0  6  80   0 - 10866 ep_pol ?        00:00:01 systemd
1 S     0      2      0  0  80   0 -     0 kthrea ?        00:00:00 kthreadd
1 S     0      3      2  0  80   0 -     0 worker ?        00:00:00 kworker/0:0
1 S     0      4      2  0  60 -20 -     0 worker ?        00:00:00 kworker/0:0H
1 S     0      5      2  0  80   0 -     0 worker ?        00:00:00 kworker/u256:0
1 S     0      6      2  0  80   0 -     0 smpboo ?        00:00:00 ksoftirqd/0
1 S     0      7      2  0 -40   - -     0 smpboo ?        00:00:00 migration/0
1 S     0      8      2  0  80   0 -     0 rcu_gp ?        00:00:00 rcu_bh
1 S     0      9      2  0  80   0 -     0 rcu_gp ?        00:00:00 rcu_sched
1 S     0     10      2  0  60 -20 -     0 rescue ?        00:00:00 lru-add-drain
5 S     0     11      2  0 -40   - -     0 smpboo ?        00:00:00 watchdog/0
5 S     0     12      2  0 -40   - -     0 smpboo ?        00:00:00 watchdog/1
1 S     0     13      2  0 -40   - -     0 smpboo ?        00:00:00 migration/1
1 S     0     14      2  0  80   0 -     0 smpboo ?        00:00:00 ksoftirqd/1
1 S     0     15      2  0  80   0 -     0 worker ?        00:00:00 kworker/1:0
1 S     0     16      2  0  60 -20 -     0 worker ?        00:00:00 kworker/1:0H


[root@centos8 ~]#ps -ef
UID     PID  PPID C STIME TTY     TIME CMD
root      1    0  0 13:55 ?     00:00:02 /usr/lib/systemd/systemd --
switched-root --system --deserial
root      2    0  0 13:55 ?     00:00:00 [kthreadd]
root      3    2  0 13:55 ?     00:00:00 [rcu_gp]
root      4    2  0 13:55 ?     00:00:00 [rcu_par_gp]

[root@centos8 ~]#ps aux
USER    PID %CPU %MEM  VSZ  RSS TTY   STAT START  TIME COMMAND
root      1  0.0  0.6 176432  5596 ?    Ss  13:55  0:02
/usr/lib/systemd/systemd --switched-root --s
root      2  0.0  0.0    0   0 ?    S   13:55  0:00 [kthreadd]
root      3  0.0  0.0    0   0 ?    I<  13:55  0:00 [rcu_gp]
root      4  0.0  0.0    0   0 ?    I<  13:55  0:00 [rcu_par_gp]


#查看进程的父子关系
[root@centos8 ~]#ps auxf
USER    PID %CPU %MEM  VSZ  RSS TTY   STAT START  TIME COMMAND
root      2  0.0  0.0    0   0 ?    S   13:55  0:00 [kthreadd]
root      3  0.0  0.0    0   0 ?    I<  13:55  0:00 \_ [rcu_gp]
root      4  0.0  0.0    0   0 ?    I<  13:55  0:00 \_[rcu_par_gp]
root      6  0.0  0.0    0   0 ?    I<  13:55  0:00 \_[kworker/0:0H-kblockd]
root      7  0.0  0.0    0   0 ?    I   13:55  0:00 \_[kworker/u256:0-events_unbound]
root      8  0.0  0.0    0   0 ?    I<  13:55  0:00 \_[mm_percpu_wq]
root      9  0.0  0.0    0   0 ?    S   13:55  0:00 \_[ksoftirqd/0]
root     10  0.0  0.0    0   0 ?    I   13:55  0:00 \_[rcu_sched]
root     11  0.0  0.0    0   0 ?    S   13:55  0:00 \_[migration/0]


#查看进程的特定属性
[root@centos8 ~]#ps axo pid,cmd,%mem,%cpu
 PID CMD             %MEM %CPU
  1 /usr/lib/systemd/systemd --  1.2  0.0
  2 [kthreadd]          0.0  0.0
  3 [rcu_gp]           0.0  0.0
  4 [rcu_par_gp]         0.0  0.0
  6 [kworker/0:0H-kblockd]    0.0  0.0
  7 [kworker/u256:0-events_unbo  0.0  0.0
  8 [mm_percpu_wq]        0.0  0.0
  9 [ksoftirqd/0]         0.0  0.0


#例:针对属性排序,CentOS6 以下版本不支持
#按CPU利用率倒序排序
[root@centos8 ~]#ps aux k -%cpu
USER     PID %CPU %MEM  VSZ  RSS TTY   STAT START  TIME COMMAND
root     3795 99.2  0.0  7324  944 pts/2  R+  16:50  2:49 dd
if=/dev/zero of=/dev/null
root      1  0.0  1.1 184860 10740 ?    Ss  08:46  0:01
/usr/lib/systemd/systemd --switched-root --system --deserialize 18
root      2  0.0  0.0    0   0 ?    S   08:46  0:00 [kthreadd]


[root@centos8 ~]#ps axo pid,cmd,%cpu,%mem k -%cpu
 PID CMD             %CPU %MEM
 1907 dd if=/dev/zero of=/dev/nul 94.5  0.0
 1914 ping 127.0.1 -f       66.0  0.2
 1915 [kworker/u256:2-events_unbo  0.7  0.0
  1 /usr/lib/systemd/systemd --  0.0  1.2
  2 [kthreadd]          0.0  0.0
  3 [rcu_gp]           0.0  0.0
  4 [rcu_par_gp]         0.0  0.0


#按内存倒序排序
[root@centos8 ~]#ps axo pid,cmd,%cpu,%mem --sort
%mem
 PID CMD             %CPU %MEM
 772 /usr/libexec/sssd/sssd_nss  0.0  4.5
 733 /usr/libexec/platform-pytho  0.0  4.0
 670 /usr/lib/polkit-1/polkitd -  0.0  2.9
 665 /usr/sbin/NetworkManager --  0.0  2.1
 668 /usr/bin/vmtoolsd       0.0  1.8
 753 /usr/libexec/sssd/sssd_be -  0.0  1.7
 663 /usr/sbin/sssd -i --logger=  0.0  1.6
 667 /usr/bin/VGAuthService -s   0.0  1.5
  1 /usr/lib/systemd/systemd --  0.0  1.2


#例:有效用户和实际用户
[laing@centos8 ~]$passwd
Changing password for user liang.
Current password:
[root@centos8 ~]#ps axo pid,cmd,%cpu,%mem,user,euser,ruser | grep passwd
 1965 passwd            0.0  1.0 root   root   liang
 1970 grep --color=auto passwd   0.0  0.1 root   root   root


##查询你拥有的所有进程
ps -x

#显示指定用户名(RUID)或用户ID的进程
ps -fU apache
ps -fU 48

#显示指定用户名(EUID)或用户ID的进程
ps -fu liang
ps -fu 1000

#查看以root用户权限(实际和有效ID)运行的每个进程
ps -U root -u root

#列出某个组拥有的所有进程(实际组ID:RGID或名称)
ps -fG nginx

#列出有效组名称(或会话)所拥有的所有进程
ps -fg mysql
ps -fg 27

#显示指定的进程ID对应的进程
ps -fp 1234

#以父进程ID来显示其下所有的进程,如显示父进程为1234的所有进程
ps -f --ppid 1234

#显示指定PID的多个进程
ps -fp 1204,1239,1263

#要按tty显示所属进程
ps -ft pts/0

#以进程树显示系统中的进程如何相互链接
ps -e --forest

#以进程树显示指定的进程
ps -f --forest -C sshd
ps -ef --forest | grep -v grep | grep sshd

#要显示一个进程的所有线程,将显示LWP(轻量级进程)以及NLWP(轻量级进程数)列
ps -fL -C nginx

#要列出所有格式说明符
ps L

#查看进程的PID,PPID,用户名和命令
ps -eo pid,ppid,user,cmd

#自定义格式显示文件系统组,ni值开始时间和进程的时间
ps -p 1234 -o pid,ppid,fgroup,ni,lstart,etime

#使用其PID查找进程名称:
ps -p 1244 -o comm=

#要以其名称选择特定进程,显示其所有子进程
ps -C sshd,bash

#查找指定进程名所有的所属PID,在编写需要从std输出或文件读取PID的脚本时这个参数很有用
ps -C httpd,sshd -o pid=

#检查一个进程的执行时间
ps -eo comm,etime,user | grep nginx

#排序,查找占用最多内存和CPU的进程
ps -eo pid,ppid,cmd,%mem,%cpu --sort=-%mem | head
ps -eo pid,ppid,cmd,%mem,%cpu --sort=-%cpu | head

#显示安全信息
ps -eM
ps --context

#使用以下命令以用户定义的格式显示安全信息
ps -eo euser,ruser,suser,fuser,f,comm,label

#使用watch实用程序执行重复的输出以实现对就程进行实时的监视,如下面的命令显示每秒钟的监视
watch -n 1 'ps -eo pid,ppid,cmd,%mem,%cpu --sort=-%mem | head'


#例:找到未知进程的执行程序文件路径
[root@centos8 ~]#ls -l /proc/1272/exe
lrwxrwxrwx 1 root root 0 Jan  4 15:47 /proc/1272/exe -> /usr/bin/bash


#例:查看优先级和CPU绑定关系
[root@centos8 ~]#ps axo pid,cmd,ni,pri,psr,rtprio |grep migration
  11 [migration/0]         - 139  0   99
  16 [migration/1]         - 139  1   99
 2246 grep --color=auto migration  0  19  0    -
[root@centos8 ~]#

[root@centos8 ~]#ps axo pid,cmd,ni,pri,psr |grep dd
  2 [kthreadd]           0  19  1
 138 [ipv6_addrconf]       -20  39  0
 2153 dd if=/dev/zero of=/dev/nul  19  0  0
 2228 grep --color=auto dd      0  19  1
[root@centos8 ~]#


例:实现进程和CPU的绑定
[root@centos8 ~]#taskset --help
Usage: taskset [options] [mask | cpu-list] [pid|cmd [args...]]


2.3 查看进程信息 prtstat
可以显示进程信息,来自于psmisc包
#格式:
prtstat [options] PID ...


#选项:
-r raw 格式显示
[root@centos8 ~]#prtstat 18395
Process: httpd     State: S (sleeping)
CPU#: 1 TTY: 0:0 Threads: 65
Process, Group and Session IDs
Process ID: 18395 Parent ID: 18386
 Group ID: 18386 Session ID: 18386
T Group ID: -1
CPU Times
This Process  (user system guest blkio):  0.03  0.47  0.00  0.00
Child processes (user system guest):     0.00  0.00  0.00
Memory
Vsize:    2651 MB
RSS:     15 MB   RSS Limit: 18446744073709 MB
Code Start: 0x5575c5525000 Code Stop: 0x5575c55aace0
Stack Start: 0x7ffc6b353ab0
Stack Pointer (ESP):      0 Inst Pointer (EIP):      0
Scheduling
Policy: normal
Nice:  0 RT Priority: 0 (non RT)


[root@centos8 ~]#prtstat -r 18395
    pid: 18395             comm: httpd
   state: S               ppid: 18386
   pgrp: 18386            session: 18386
  tty_nr: 0               tpgid: -1
   flags: 400140            minflt: 509
  cminflt: 0              majflt: 0
  cmajflt: 0               utime: 3
   stime: 47              cutime: 0
  cstime: 0             priority: 20
   nice: 0            num_threads: 65
itrealvalue: 0             starttime: 8709457
   vsize: 2651152384            rss: 3900
  rsslim: 18446744073709551615       startcode: 93964310040576
  endcode: 93964310588640      startstack: 140722107136688
  kstkesp: 0              kstkeip: 0
   wchan: 0               nswap: 0
  cnswap: 0            exit_signal: 17
 processor: 1            rt_priority: 0
  policy: 0       delayaccr_blkio_ticks: 0
guest_time: 0            cguest_time: 0
2.4 设置和调整进程优先级
进程优先级调整
静态优先级:100-139
进程默认启动时的nice值为0,优先级为120
只有根用户才能降低nice值(提高优先性)
nice命令以指定的优先级来启动进程
nice [OPTION] [COMMAND [ARG]...]
-n, --adjustment=N  add integer N to the niceness (default 10)
renice命令可以调整正在执行中的进程的优先级
renice [-n] priority pid...
#查看:ps axo pid,comm,ni


#例:
[root@centos8 ~]#nice -n -10 ping 127.0.0.1
[root@centos8 ~]#ps axo pid,cmd,nice |grep ping
 2118 ping 127.0.0.1        -10
 2120 grep --color=auto ping     0
[root@centos8 ~]#
[root@centos8 ~]#renice -n -20 2118
2106 (process ID) old priority -10, new priority -20
[root@centos8 ~]#ps axo pid,cmd,nice |grep ping
 2118 ping 127.0.0.1        -20
 2200 grep --color=auto ping     0
2.5 搜索进程
按条件搜索进程
ps 选项 | grep 'pattern' 灵活
pgrep 按预定义的模式
/sbin/pidof 按确切的程序名称查看pid
2.5.1 pgrep
#格式:
pgrep [options] pattern


##常用选项:
-u uid: effective user,生效者
-U uid: real user,真正发起运行命令者
-t terminal: 与指定终端相关的进程
-l: 显示进程名
-a: 显示完整格式的进程名
-P pid: 显示指定进程的子进程


#例:
[root@centos8 ~]#pgrep -u liang
2303
2330
[root@centos8 ~]#pgrep -lu liang
2303 bash
2330 dd

#错误写法
[root@centos8 ~]#pgrep -ul liang
pgrep: invalid user name: l
[root@centos8 ~]#pgrep -au liang
2303 -bash
2330 dd if=/dev/zero of=/dev/null
[root@centos8 ~]#pgrep -aP 2303
2330 dd if=/dev/zero of=/dev/null
[root@centos8 ~]#pgrep -at pts/2
1482 -bash
2302 su - liang
2303 -bash
2330 dd if=/dev/zero of=/dev/null
2.5.2 pidof
#格式:
pidof [options] [program [...]]


#常用选项:
-x 按脚本名称查找pid


#例:
[root@centos8 ~]#pidof bash
19035 18813 18789 1251
[root@centos7 ~]#cat ping.sh
#!/bin/bash
ping 127.0.0.1
#centos8 执行命令可以可以查看到pid
[root@centos7 ~]#pidof ping.sh
#ping.sh必须有shebang机制,否则pidof -x 也无法查找到
[root@centos7 ~]#pidof -x ping.sh
19035
2.6 负载查询 uptime
/proc/uptime 包括两个值,单位 s
系统启动时长
空闲进程的总时长(按总的CPU核数计算)
uptime 和 w 显示以下内容
当前时间
系统已启动的时间
当前上线人数
系统平均负载(1、5、15分钟的平均负载,一般不会超过1,超过5时建议警报)
系统平均负载: 指在特定时间间隔内运行队列中的平均进程数,通常每个CPU内核的当前活动进程数不大于3,那么系统的性能良好。如果每个CPU内核的任务数大于5,那么此主机的性能有严重问题
例如:linux主机是1个双核CPU,当Load Average 为6的时候说明机器已经被充分使用
[root@centos8 ~]#uptime
09:38:34 up 1 day,  1:04,  2 users, load average: 0.00, 0.00, 0.00
[root@centos8 ~]#w
09:38:29 up 1 day,  1:04,  2 users, load average: 0.00, 0.00, 0.00
USER   TTY   FROM       LOGIN@  IDLE  JCPU  PCPU WHAT
root   pts/0   10.0.0.1     Wed08   0.00s  0.32s  0.00s w
root   pts/1   10.0.0.1     09:10   5:25  0.06s  0.00s /bin/bash
./ping.sh
2.7 显示CPU相关统计 mpstat
来自于sysstat包
#例:
[root@centos8 ~]#yum install -y sysstat
[root@centos8 ~]#mpstat
Linux 4.18.0-80.el8.x86_64 (centos8.localdomain) 01/09/2020 _x86_64_ (4
CPU)
10:16:43 AM CPU %usr %nice %sys %iowait %irq %soft %steal %guest
%gnice %idle
10:16:43 AM all 0.01 0.00 0.03 0.00 0.01 0.01 0.00 0.00
0.00 99.93
[root@centos8 ~]#mpstat 1 3
Linux 4.18.0-80.el8.x86_64 (centos8.localdomain) 01/09/2020 _x86_64_ (4
CPU)
10:16:48 AM CPU %usr %nice %sys %iowait %irq %soft %steal %guest
%gnice %idle
10:16:49 AM all 0.00 0.00 0.25 0.00 0.00 0.00 0.00 0.00
0.00 99.75
10:16:50 AM all 0.00 0.00 0.00 0.00 0.00 0.00 0.00 0.00
0.00 100.00
10:16:51 AM all 0.00 0.00 0.00 0.00 0.00 0.00 0.00 0.00
0.00 100.00
Average: all 0.00 0.00 0.08 0.00 0.00 0.00 0.00 0.00
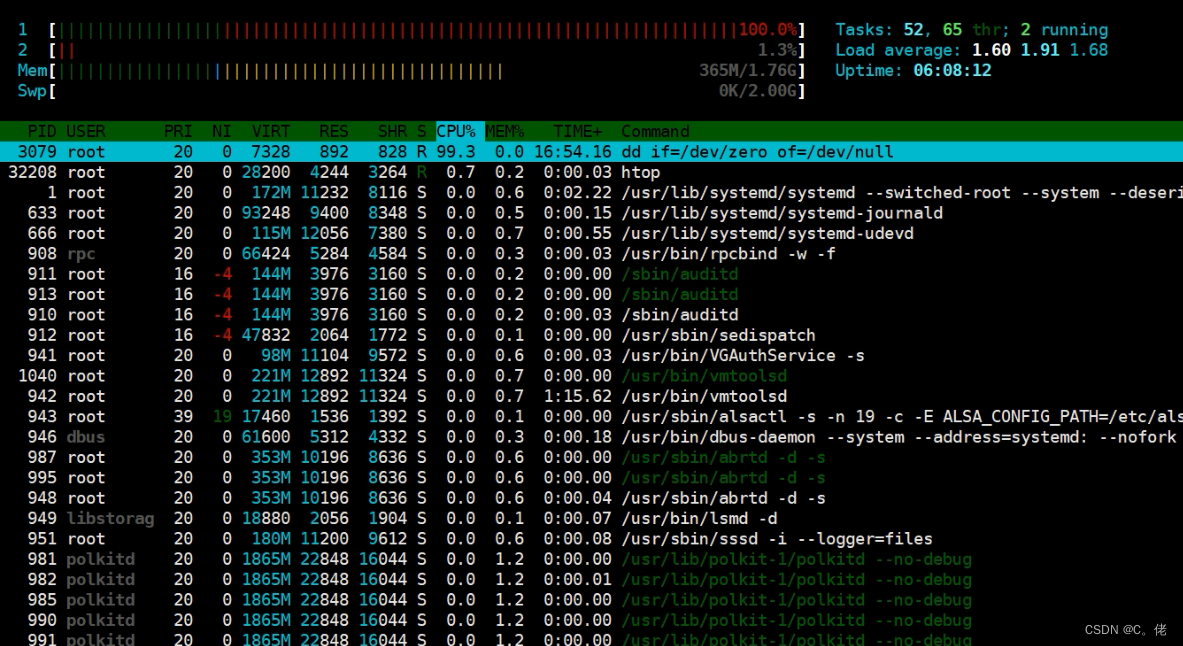
0.00 99.922.8 查看进程实时状态 top 和 htop
2.8.1 top
top -  15:05:10(当前时间) up 14 days,3:23,(系统上线时间) 3 users,(当前登录用户数) load average:0.00,0.01,0.05系统负载(任务队列的平均长度)
Tasks: 73 total,(进程总数) 1 running,(正在运行进程数) 72 sleeping,(休眠进程数) 0 stopped,(停止进程数) 0 zombie(僵尸进程数)
%Cpu(s): 0.3 us,(用户空间占比) 0.7 sy,(内核空间占比)  0.0 ni,(改变过优先级的进程占比) 98.7 id,(空闲CPU占比) 0.0 wa,(IO等待占比) 0.0 hi,(硬中断占比) 0.3 si,(软中断占比) 0.0 st(steal,time stolen from a virual machine)

MiB Mem :  1950.3 total,(物理内存总量) 1571.7 free,(空闲内存总量) 187.4 used,(已使用物理内存总量) 191.2 buff/cache(内核缓存内存量)
MiB Swap: 4096.0 total,(交换区总量) 4096.0 free,(空闲交换区总量) 0.0 used,(使用的交换区总量) 1607.6 avail Mem(可用内存)

PID(进程ID) USER(用户) PR(优先级) NI(Nice值) VIRT(虚拟内存) RES(常驻内存) SHR(共享内存) S %CPU %MEM  TIME+ COMMAND
top 提供动态的实时进程状态
#有许多内置命令
帮助:h 或 ? ,按 q 或esc 退出帮助
排序:
P:以占据的CPU百分比,%CPU
M:占据内存百分比,%MEM
T:累积占据CPU时长,TIME+

首部信息显示:
uptime信息:l命令
tasks及cpu信息:t命令
cpu分别显示:1 (数字)
memory信息:m命令

退出命令:q
修改刷新时间间隔:s
终止指定进程:k
保存文件:W


#top命令栏位信息简介
us:用户空间
sy:内核空间
ni:调整nice时间
id:空闲
wa:等待IO时间
hi:硬中断
si:软中断(模式切换)
st:虚拟机偷走的时间

#top选项:
-d # 指定刷新时间间隔,默认为3秒
-b 全部显示所有进程
-n # 刷新多少次后退出
-H   线程模式

#例:
top -H -p `pidof mysqld`
2.8.2 htop
htop 命令是增强版的TOP命令,来自EPEL源,比top功能更强
#常用选项:
-d #: 指定延迟时间;
-u UserName: 仅显示指定用户的进程
-s COLUME: 以指定字段进行排序


#子命令:
s:跟踪选定进程的系统调用
l:显示选定进程打开的文件列表
a:将选定的进程绑定至某指定CPU核心
t:显示进程树
2.9 内存空间 free
free 可以显示内存空间使用状态

#格式:
free [OPTION]


#常用选项:
-b 以字节为单位
-m 以MB为单位
-g 以GB为单位
-h 易读格式
-o 不显示-/+buffers/cache行
-t  显示RAM + swap的总和
-s n 刷新间隔为n秒
-c n 刷新n次后即退出


向/proc/sys/vm/drop_caches中写入相应的修改值,会清理缓存。建议先执行sync(sync 命令将所有
未写的系统缓冲区写到磁盘中,包含已修改的 i-node、已延迟的块 I/O 和读写映射文件)。执行echo
1、2、3 至 /proc/sys/vm/drop_caches, 达到不同的清理目的

如果因为是应用有像内存泄露、溢出的问题时,从swap的使用情况是可以比较快速可以判断的,但通过
执行free 反而比较难查看。但核心并不会因为内存泄露等问题并没有快速清空buffer或cache(默认值
是0),生产也不应该随便去改变此值。


一般情况下,应用在系统上稳定运行了,free值也会保持在一个稳定值的。当发生内存不足、应用获取
不到可用内存、OOM错误等问题时,还是更应该去分析应用方面的原因,否则,清空buffer,强制腾出
free的大小,可能只是把问题给暂时屏蔽了。

排除内存不足的情况外,除非是在软件开发阶段,需要临时清掉buffer,以判断应用的内存使用情况;
或应用已经不再提供支持,即使应用对内存的时候确实有问题,而且无法避免的情况下,才考虑定时清
空buffer。


#例:
[root@centos6 ~]#free
      total    used    free   shared  buffers   cached
Mem:    1003020   177964   825056     240    16604    59932
-/+ buffers/cache:   101428   901592
Swap:    2097148      0   2097148
root@ubuntu2004:~# free -h
      total    used    free   shared buff/cache  available
Mem:      1.9Gi    338Mi    167Mi    1.0Mi    1.4Gi    1.4Gi
Swap:     2.0Gi     0B    2.0Gi


#说明: man 5 proc
[root@centos8 ~]#man proc
......
/proc/sys/vm/drop_caches (since Linux 2.6.16)
Writing to this file causes the kernel to drop clean caches, dentries, and
inodes from memory, causing that memory to become free. This can be useful for
memory management testing and performing reproducible filesystem
benchmarks.Because writing to this file causes the benefits of caching to be
lost, it can degrade overall system performance.
To free pagecache, use:

echo 1 > /proc/sys/vm/drop_caches
To free dentries and inodes, use:

echo 2 > /proc/sys/vm/drop_caches
To free pagecache, dentries and inodes, use:

echo 3 > /proc/sys/vm/drop_caches
Because writing to this file is a nondestructive operation and dirty objects
are not freeable, the user should run sync(1) first.


#例: 清理缓存
[root@centos8 ~]#cat /proc/sys/vm/drop_caches
0
[root@centos8 ~]#free -h
      total    used    free   shared buff/cache  available
Mem:      1.8Gi    355Mi    724Mi    9.0Mi    726Mi    1.2Gi
Swap:     2.0Gi     0B    2.0Gi
[root@centos8 ~]#echo 3 > /proc/sys/vm/drop_caches
[root@centos8 ~]#free -h
      total    used    free   shared buff/cache  available
Mem:      1.8Gi    320Mi    1.3Gi    9.0Mi    152Mi    1.3Gi
Swap:     2.0Gi     0B    2.0Gi
2.10 进程对应的内存映射 pmap
#格式:
pmap [options] pid [...]


#常用选项:、
-x: 显示详细格式的信息


#例:
pmap 1

#另外一种实现
cat /proc/PID/maps


#例:
[root@centos8 ~]#pmap 33477
33477:  ping 127.0.0.1
000055f708aa7000   56K r-x-- ping
000055f708cb5000   4K r---- ping
000055f708cb6000   4K rw--- ping
000055f708cb7000  140K rw---  [ anon ]
000055f70a7cc000  132K rw---  [ anon ]


#例:
#查看系统调用
[root@centos7 ~]#dnf -y install strace
[root@centos7 ~]#strace ls
execve("/usr/bin/ls", ["ls"], 0x7ffd4b9dad50 /* 25 vars */) = 0
brk(NULL)                = 0x55ed4c7d7000
arch_prctl(0x3001 /* ARCH_??? */, 0x7ffd500ae390) = -1 EINVAL (Invalid argument)
access("/etc/ld.so.preload", R_OK)    = -1 ENOENT (No such file or directory)
openat(AT_FDCWD, "/etc/ld.so.cache", O_RDONLY|O_CLOEXEC) = 3
fstat(3, {st_mode=S_IFREG|0644, st_size=73944, ...}) = 0
mmap(NULL, 73944, PROT_READ, MAP_PRIVATE, 3, 0) = 0x7fce5dfa7000
close(3)


##查看库调用
[root@centos7 ~]#yum -y install ltrace
[root@centos7 ~]# ltrace ls
__libc_start_main(0x402910, 1, 0x7ffcca28b1b8, 0x4129a0 <unfinished ...>
strrchr("ls", '/')
             = nil
setlocale(LC_ALL, "")
             = "en_US.utf8"
bindtextdomain("coreutils", "/usr/share/locale")
             = "/usr/share/locale"
textdomain("coreutils")
2.11 虚拟内存信息 vmstat
#格式:
vmstat [options] [delay [count]]


#选项:
-s 显示内存的统计数据


#显示项说明:
procs:
    r:可运行(正运行或等待运行)进程的个数,和核心数有关
    b:处于不可中断睡眠态的进程个数(被阻塞的队列的长度)
memory:
    swpd: 交换内存的使用总量
    free:空闲物理内存总量
    buffer:用于buffer的内存总量
    cache:用于cache的内存总量
swap:
    si:从磁盘交换进内存的数据速率(kb/s)
    so:从内存交换至磁盘的数据速率(kb/s)
io:
    bi:从块设备读入数据到系统的速率(kb/s)
    bo: 保存数据至块设备的速率
system:
    in: interrupts 中断速率,包括时钟
    cs: context switch    进程切换速率
cpu:
    us:Time spent running non-kernel code
    sy: Time spent running kernel code
    id: Time spent idle. Linux 2.5.41前,包括IO-wait time.
    wa: Time spent waiting for IO.  2.5.41前,包括in idle.
    st: Time stolen from a virtual machine.  2.6.11前, unknown.


#例:
[root@centos8 ~]#vmstat
procs -----------memory---------- ---swap-- -----io---- -system-- ------cpu-----
r b  swpd  free  buff cache  si  so  bi  bo  in  cs us sy id wa st
1  0    0 1125284  5308 404636   0   0   1   1  25  33  0  0 100  0
 0

[root@centos8 ~]#vmstat 1 3
procs -----------memory---------- ---swap-- -----io---- -system-- ------cpu-----
r b  swpd  free  buff cache  si  so  bi  bo  in  cs us sy id wa st
0  0    0 1125408  5308 404676   0   0   1   1  25  33  0  0 100  0
 0
0  0    0 1125248  5308 404676   0   0   0   0  165  236  0  0 100  0
 0
0  0    0 1125188  5308 404676   0   0   0   0  146  216  0  0 100  0
 0

[root@centos8 ~]#vmstat -s
   1849460 K total memory
   314348 K used memory
   264424 K active memory
   192500 K inactive memory
   1125128 K free memory
    5308 K buffer memory
   404676 K swap cache
   2097148 K total swap
      0 K used swap
   2097148 K free swap
    2519 non-nice user cpu ticks
    1027 nice user cpu ticks
    10178 system cpu ticks
  36616214 idle cpu ticks
     294 IO-wait cpu ticks
    5043 IRQ cpu ticks
    5150 softirq cpu ticks
      0 stolen cpu ticks
   249439 pages paged in
   301109 pages paged out
      0 pages swapped in
      0 pages swapped out
   9338473 interrupts
  12059933 CPU context switches
 1578443646 boot time
    19386 forks
2.12 统计CPU和设备IO信息 iostat
iostat 可以提供更丰富的IO性能状态数据,此工具由sysstat包提供
#常用选项:

-c 只显示CPU行
-d 显示设备〈磁盘)使用状态
-k 以千字节为为单位显示输出
-t 在输出中包括时间戳
-x 在输出中包括扩展的磁盘指标


#例:
[root@centos8 ~]#iostat
Linux 4.18.0-80.el8.x86_64 (centos8.localdomain) 01/09/2020 _x86_64_ (4
CPU)
avg-cpu: %user  %nice %system %iowait %steal  %idle
     0.01   0.00   0.06   0.00   0.00  99.93
Device       tps  kB_read/s  kB_wrtn/s  kB_read   kB_wrtn
sda        0.31     2.57     3.52   238227   326708
scd0        0.01     0.14     0.00    13140      0

[root@centos8 ~]#iostat 1 3
Linux 4.18.0-80.el8.x86_64 (centos8.localdomain) 01/09/2020 _x86_64_ (4
CPU)
avg-cpu: %user  %nice %system %iowait %steal  %idle
     0.01   0.00   0.06   0.00   0.00  99.93
Device       tps  kB_read/s  kB_wrtn/s  kB_read   kB_wrtn
sda        0.31     2.57     3.52   238227   326708
scd0        0.01     0.14     0.00    13140      0
avg-cpu: %user  %nice %system %iowait %steal  %idle
     0.00   0.00   0.25   0.00   0.00  99.75
Device       tps  kB_read/s  kB_wrtn/s  kB_read   kB_wrtn
sda        0.00     0.00     0.00      0      0
scd0        0.00     0.00     0.00      0      0
avg-cpu: %user  %nice %system %iowait %steal  %idle
     0.00   0.00   0.00   0.00   0.00  100.00
Device       tps  kB_read/s  kB_wrtn/s  kB_read   kB_wrtn
sda        0.00     0.00     0.00      0      0
scd0        0.00     0.00     0.00      0      0


tps:该设备每秒的传输次数(Indicate the number of transfers per second that were
issued to the device.)。"一次传输"意思是"一次I/O请求"。多个逻辑请求可能会被合并为"一次I/O
请求"。"一次传输"请求的大小是未知的。


kB_read/s:每秒从设备(drive expressed)读取的数据量;
kB_wrtn/s:每秒向设备(drive expressed)写入的数据量;
kB_read:读取的总数据量;
kB_wrtn:写入的总数量数据量;这些单位都为Kilobytes。


#例:
[root@centos8 ~]#iostat -d sda -t -k 1 3
Linux 4.18.0-193.el8.x86_64 (centos8.localdomain.com) 11/24/2020 _x86_64_
(2 CPU)
11/24/2020 03:08:50 PM
Device       tps  kB_read/s  kB_wrtn/s  kB_read   kB_wrtn
sda       26.51    893.96    310.78   219458   76293
11/24/2020 03:08:51 PM
Device       tps  kB_read/s  kB_wrtn/s  kB_read   kB_wrtn
sda        0.00     0.00     0.00     0     0
11/24/2020 03:08:52 PM
Device       tps  kB_read/s  kB_wrtn/s  kB_read   kB_wrtn
sda        0.00     0.00     0.00     0     0

[root@centos8 ~]#iostat -d sda  1 3 -x
Linux 4.18.0-193.el8.x86_64 (centos8.localdomain.com) 11/24/2020 _x86_64_
(2 CPU)
Device      r/s   w/s   rkB/s   wkB/s  rrqm/s  wrqm/s %rrqm %wrqm
r_await w_await aqu-sz rareq-sz wareq-sz svctm %util
sda       12.70   2.93   523.99   183.34   0.05   0.78  0.41
 20.93   0.37   0.75  0.00   41.26   62.53  0.50  0.78
Device      r/s   w/s   rkB/s   wkB/s  rrqm/s  wrqm/s %rrqm %wrqm
r_await w_await aqu-sz rareq-sz wareq-sz svctm %util
sda        0.00   0.00    0.00    0.00   0.00   0.00  0.00
0.00   0.00   0.00  0.00   0.00   0.00  0.00  0.00
Device      r/s   w/s   rkB/s   wkB/s  rrqm/s  wrqm/s %rrqm %wrqm
r_await w_await aqu-sz rareq-sz wareq-sz svctm %util
sda        0.00   0.00    0.00    0.00   0.00   0.00  0.00
0.00   0.00   0.00  0.00   0.00   0.00  0.00  0.00


#输出说明
r/s: 每秒合并后读的请求数
w/s: 每秒合并后写的请求数
rsec/s:每秒读取的扇区数;
wsec/:每秒写入的扇区数。
rKB/s:The number of read requests that were issued to the device per second;
wKB/s:The number of write requests that were issued to the device per second;
rrqm/s:每秒这个设备相关的读取请求有多少被Merge了(当系统调用需要读取数据的时候,VFS将请求发到
各个FS,如果FS发现不同的读取请求读取的是相同Block的数据,FS会将这个请求合并Merge);
wrqm/s:每秒这个设备相关的写入请求有多少被Merge了。
%rrqm: The percentage of read requests merged together before being sent to the
device.
%wrqm: The percentage of write requests merged together before being sent to the
device.
avgrq-sz 平均请求扇区的大小
avgqu-sz 是平均请求队列的长度。毫无疑问,队列长度越短越好。
await: 每一个IO请求的处理的平均时间(单位是微秒毫秒)。这里可以理解为IO的响应时间,一般地系统
IO响应时间应该低于5ms,如果大于10ms就比较大了。这个时间包括了队列时间和服务时间,也就是说,一般
情况下,await大于svctm,它们的差值越小,则说明队列时间越短,反之差值越大,队列时间越长,说明系
统出了问题。
svctm   表示平均每次设备I/O操作的服务时间(以毫秒为单位)。如果svctm的值与await很接近,表示
几乎没有I/O等待,磁盘性能很好,如果await的值远高于svctm的值,则表示I/O队列等待太长,系统上运行
的应用程序将变慢。
%util: 在统计时间内所有处理IO时间,除以总共统计时间。例如,如果统计间隔1秒,该设备有0.8秒在处
理IO,而0.2秒闲置,那么该设备的%util = 0.8/1 = 80%,所以该参数暗示了设备的繁忙程度。一般地,
如果该参数是100%表示设备已经接近满负荷运行了(当然如果是多磁盘,即使%util是100%,因为磁盘的并
发能力,所以磁盘使用未必就到了瓶颈)。
2.13 监视磁盘I/O iotop
来自于iotop包
iotop命令是一个用来监视磁盘I/O使用状况的top类工具iotop具有与top相似的UI,其中包括PID、用
户、I/O、进程等相关信息,可查看每个进程是如何使用IO
iotop输出
第一行:Read和Write速率总计
第二行:实际的Read和Write速率
第三行:参数如下:
线程ID(按p切换为进程ID)
优先级
用户
磁盘读速率
磁盘写速率
swap交换百分比
IO等待所占的百分比
#iotop常用参数
-o,     --only只显示正在产生I/O的进程或线程,除了传参,可以在运行过程中按o生效
-b,     --batch非交互模式,一般用来记录日志
-n NUM,     --iter=NUM设置监测的次数,默认无限。在非交互模式下很有用
-d SEC,     --delay=SEC设置每次监测的间隔,默认1秒,接受非整形数据例如1.1
-p PID,     --pid=PID指定监测的进程/线程
-u USER,     --user=USER指定监测某个用户产生的I/O
-P,     --processes仅显示进程,默认iotop显示所有线程
-a,     --accumulated显示累积的I/O,而不是带宽
-k,     --kilobytes使用kB单位,而不是对人友好的单位。在非交互模式下,脚本编程有用
-t,     --time 加上时间戳,非交互非模式
-q,     --quiet 禁止头几行,非交互模式,有三种指定方式
-q     只在第一次监测时显示列名
-qq     永远不显示列名
-qqq     永远不显示I/O汇总


#交互按键
left和right方向键:    改变排序
r:    反向排序
o:    切换至选项--only
p:    切换至--processes选项
a:    切换至--accumulated选项
q:    退出
i:    改变线程的优先级
2.14 显示网络带宽使用情况 iftop
通过EPEL源的 iftop 包
[root@centos8 ~]#iftop -ni eth0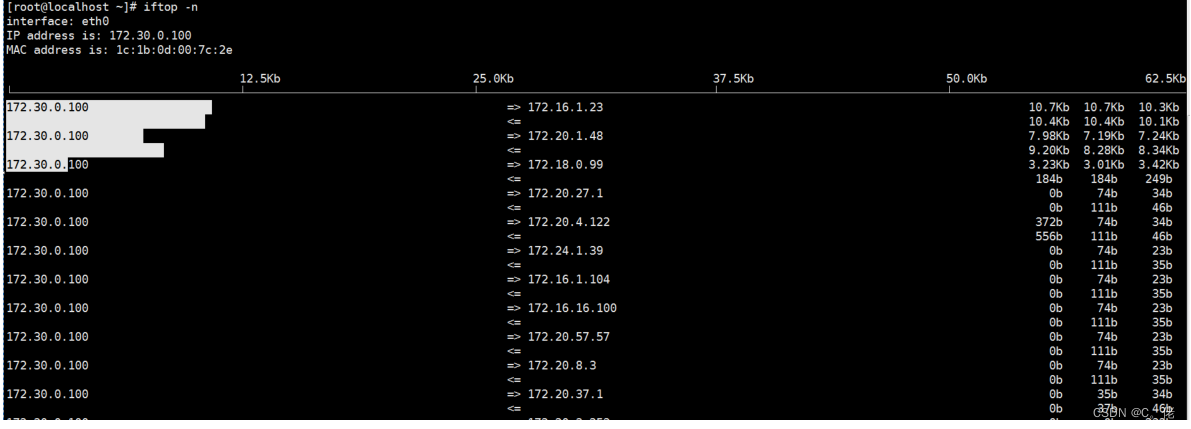
2.15 查看网络实时吞吐量 nload
nload 是一个实时监控网络流量和带宽使用情况,以数值和动态图展示进出的流量情况,通过EPEL源安装
#界面操作
上下方向键、左右方向键、enter键或者tab键都就可以切换查看多个网卡的流量情况
按 F2 显示选项窗口
按 q 或者 Ctrl+C 退出 nload


#例:

#默认只查看第一个网络的流量进出情况
nload

#在nload后面指定网卡,可以指定多个,按左右键分别显示网卡状态
nload eth0 eth1

#设置刷新间隔:默认刷新间隔是100毫秒,可通过 -t 命令设置刷新时间(单位是毫秒)
nload -t 500 eth0

#设置单位:显示两种单位一种是显示Bit/s、一种是显示Byte/s,默认是以Bit/s,也可不显示/s
#-u h|b|k|m|g|H|B|K|M|G 表示的含义: h: auto, b: Bit/s, k: kBit/s, m: MBit/s, H:
auto, B: Byte/s, K: kByte/s, M: MByte/s
nload -u M eth0
2.16 查看进程网络带宽的使用情况 nethogs
NetHogs是一个开源的命令行工具(类似于Linux的top命令),用来按进程或程序实时统计网络带宽使用率。红帽系统的nethogs包来自于EPEL源
github网站: https://github.com/raboof/nethogs/
[root@rocky8 ~]#yum -y install nethogs
[root@ubuntu1804 ~]#apt -y install nethogs
[root@ubuntu1804 ~]#nethogs
2.17 网络监视工具iptraf-ng
来自于iptraf-ng包,可以进网络进行监控,对终端窗口大小有要求.
[root@centos8 ~]#yum info iptraf-ng
Last metadata expiration check: 0:20:24 ago on Sat 04 Jul 2020 12:17:23 PM CST.
Installed Packages
Name     : iptraf-ng
Version   : 1.1.4
Release   : 18.el8
Architecture : x86_64
Size     : 676 k
Source    : iptraf-ng-1.1.4-18.el8.src.rpm
Repository  : @System
From repo  : BaseOS
Summary   : A console-based network monitoring utility
URL     : https://github.com/iptraf-ng/iptraf-ng/
License   : GPLv2+
Description : IPTraf-ng is a console-based network monitoring utility. IPTraf
gathers
      : data like TCP connection packet and byte counts, interface
statistics
      : and activity indicators, TCP/UDP traffic breakdowns, and LAN
station
      : packet and byte counts. IPTraf-ng features include an IP traffic
monitor
      : which shows TCP flag information, packet and byte counts, ICMP
      : details, OSPF packet types, and oversized IP packet warnings;
      : interface statistics showing IP, TCP, UDP, ICMP, non-IP and other
IP
      : packet counts, IP checksum errors, interface activity and packet
size
      : counts; a TCP and UDP service monitor showing counts of incoming
and
      : outgoing packets for common TCP and UDP application ports, a LAN
      : statistics module that discovers active hosts and displays
statistics
      : about their activity; TCP, UDP and other protocol display filters
so
      : you can view just the traffic you want; logging; support for
Ethernet,
      : FDDI, ISDN, SLIP, PPP, and loopback interfaces; and utilization of
the
      : built-in raw socket interface of the Linux kernel, so it can be
used
      : on a wide variety of supported network cards.


[root@centos8 ~]#yum -y install iptraf-ng
#对终端窗口大小有要求,如果太小否则无法显示
[root@centos8 ~]#iptraf-ng
fatal: This program requires a screen size of at least 80 columns by 24 lines
Please resize your window 

2.18 系统资源统计 dstat
dstat由pcp-system-tools包提供,但安装dstat包即可, 可用于代替 vmstat,iostat功能
#格式:
dstat [-afv] [options..] [delay [count]]


#常用选项:
-c 显示cpu相关信息
-C #,#,...,total
-d 显示disk相关信息
-D total,sda,sdb,...
-g 显示page相关统计数据
-m 显示memory相关统计数据
-n 显示network相关统计数据
-p 显示process相关统计数据
-r 显示io请求相关的统计数据
-s 显示swapped相关的统计数据
--tcp
--udp
--unix
--raw
--socket
--ipc
--top-cpu:显示最占用CPU的进程
--top-io: 显示最占用io的进程
--top-mem: 显示最占用内存的进程
--top-latency: 显示延迟最大的进程


#例:
[root@centos8 ~]#yum -y install dstat
[root@centos8 ~]#dstat 1 6
You did not select any stats, using -cdngy by default.
----total-usage---- -dsk/total- -net/total- ---paging-- ---system--
usr sys idl wai stl| read writ| recv send|  in  out | int  csw
 0  0  99  0  0|  0 2687k|  64  601 |  0   0 | 256  164
 0  0 100  0  0|  0   0 |  64  330 |  0   0 | 121  155
 0  0 100  0  0|  0   0 |  64  330 |  0   0 | 104  144
 0  0 100  0  0|  0   0 |  64  330 |  0   0 | 110  145
 0  0  99  0  0|  0   0 |  64  330 |  0   0 | 100  130
2.19 综合监控工具 glances
此工具可以通过EPEL源安装,CentOS 8 目前已提供,但测试有问题

#格式:
glances [-bdehmnrsvyz1] [-B bind] [-c server] [-C conffile] [-p port] [-P
password] [--password] [-t refresh] [-f file] [-o output]


#内建命令:
a Sort processes automatically   l Show/hide logs
c Sort processes by CPU%         b Bytes or bits for network I/O
m Sort processes by MEM%         w Delete warning logs
p Sort processes by name         x Delete warning and critical logs
i Sort processes by I/O rate     1 Global CPU or per-CPU stats
d Show/hide disk I/O stats       h Show/hide this help screen
f Show/hide file system stats    t View network I/O as combination
n Show/hide network stats        u View cumulative network I/O
s Show/hide sensors stats        q Quit (Esc and Ctrl-C also work)
y Show/hide hddtemp stats


#常用选项:
-b: 以Byte为单位显示网卡数据速率
-d: 关闭磁盘I/O模块
-f /path/to/somefile: 设定输入文件位置
-o {HTML|CSV}:输出格式
-m: 禁用mount模块
-n: 禁用网络模块
-t #: 延迟时间间隔
-1:每个CPU的相关数据单独显示
C/S模式下运行glances命令
服务器模式:
glances -s -B IPADDR
IPADDR: 指明监听的本机哪个地址,端口默认为61209/tcp
客户端模式:
glances -c IPADDR
IPADDR:要连入的服务器端地址
注意: 不同版本不兼容
[root@centos7 ~]#glances -c 10.0.0.8
Client and server not compatible:    Client version: 2.5.1 / Server version:
3.1.4.1
2.20 查看进程打开文件 lsof
lsof:list open files,查看当前系统文件的工具。在linux环境下,一切皆文件,用户通过文件不仅可以访问常规数据,还可以访问网络连接和硬件如传输控制协议 (TCP) 和用户数据报协议 (UDP)套接字等,系统在后台都为该应用程序分配了一个文件描述符
#命令选项:
-a:    列出打开文件存在的进程
-c:    <进程名>:列出指定进程所打开的文件
-g:    列出GID号进程详情
-d:    <文件号>:列出占用该文件号的进程
+d:    <目录>:列出目录下被打开的文件
+D:    <目录>:递归列出目录下被打开的文件
-n:    <目录>:列出使用NFS的文件
-i:    <条件>:列出符合条件的进程(4、6、协议、:端口、 @ip )
-p:    <进程号>:列出指定进程号所打开的文件
-u:    列出UID号进程详情
-h:    显示帮助信息
-v:    显示版本信息。
-n:     不反向解析网络名字


#例:
#lsof 列出当前所有打开的文件
[root@centos8 ~]#lsof|head
COMMAND  PID TID TASKCMD   USER  FD   TYPE       DEVICE SIZE/OFF
   NODE NAME
systemd    1          root cwd    DIR         8,2    279
    128 /
systemd    1          root rtd    DIR         8,2    279
    128 /
systemd    1          root txt    REG         8,2  1567768
  218104 /usr/lib/systemd/systemd
systemd    1          root mem    REG         8,2  2714928
 67121853 /usr/lib64/libm-2.28.so
systemd    1          root mem    REG         8,2  628592
 67512196 /usr/lib64/libudev.so.1.6.11
systemd    1          root mem    REG         8,2  969832
 67137579 /usr/lib64/libsepol.so.1
systemd    1          root mem    REG         8,2  1805368
 67183626 /usr/lib64/libunistring.so.2.1.0
systemd    1          root mem    REG         8,2  355456
 67206701 /usr/lib64/libpcap.so.1.9.0
systemd    1          root mem    REG         8,2  145984
 67137598 /usr/lib64/libgpg-error.so.0.24.2


#查看当前哪个进程正在使用此文件
[root@centos8 ~]#lsof /var/log/messages
COMMAND PID USER  FD  TYPE DEVICE SIZE/OFF   NODE NAME
rsyslogd 915 root  5w  REG   8,2  1419936 134802547 /var/log/messages


#查看由登陆用户启动而非系统启动的进程
lsof /dev/pts/1
[root@centos8 ~]#lsof `tty`
COMMAND PID USER  FD  TYPE DEVICE SIZE/OFF NODE NAME
bash   1163 root  0u  CHR  136,0   0t0   3 /dev/pts/0
bash   1163 root  1u  CHR  136,0   0t0   3 /dev/pts/0
bash   1163 root  2u  CHR  136,0   0t0   3 /dev/pts/0
bash   1163 root 255u  CHR  136,0   0t0   3 /dev/pts/0
lsof   1651 root  0u  CHR  136,0   0t0   3 /dev/pts/0
lsof   1651 root  1u  CHR  136,0   0t0   3 /dev/pts/0
lsof   1651 root  2u  CHR  136,0   0t0   3 /dev/pts/0


#指定进程号,可以查看该进程打开的文件
lsof -p 0512

[root@centos8 ~]#lsof -p `pidof bc`
COMMAND PID USER  FD  TYPE DEVICE SIZE/OFF   NODE NAME
bc    1929 root cwd  DIR   8,2    286 201326721 /root
bc    1929 root rtd  DIR   8,2   4096    128 /
bc    1929 root txt  REG   8,2   97256 201784353 /usr/bin/bc
bc    1929 root mem  REG   8,2   28784   171116 /usr/lib64/libdl-2.28.so
bc    1929 root mem  REG   8,2  3201344   171114 /usr/lib64/libc-2.28.so
bc    1929 root mem  REG   8,2  208616   171019
/usr/lib64/libtinfo.so.6.1
bc    1929 root mem  REG   8,2  216912   171009
/usr/lib64/libncurses.so.6.1
bc    1929 root mem  REG   8,2  338648   232638
/usr/lib64/libreadline.so.7.0
bc    1929 root mem  REG   8,2  243520   171107 /usr/lib64/ld-2.28.so
bc    1929 root mem  REG   8,2  337024 134631849
/usr/lib/locale/en_US.utf8/LC_CTYPE
bc    1929 root mem  REG   8,2   26398  67337760 /usr/lib64/gconv/gconv-
modules.cache
bc    1929 root  0u  CHR  136,0   0t0     3 /dev/pts/0
bc    1929 root  1u  CHR  136,0   0t0     3 /dev/pts/0
bc    1929 root  2u  CHR  136,0   0t0     3 /dev/pts/0


#查看指定程序打开的文件
lsof -c httpd

[root@centos8 ~]#lsof -c bc
COMMAND PID USER  FD  TYPE DEVICE SIZE/OFF   NODE NAME
bc    1929 root cwd  DIR   8,2    286 201326721 /root
bc    1929 root rtd  DIR   8,2   4096    128 /
bc    1929 root txt  REG   8,2   97256 201784353 /usr/bin/bc
bc    1929 root mem  REG   8,2   28784   171116 /usr/lib64/libdl-2.28.so
bc    1929 root mem  REG   8,2  3201344   171114 /usr/lib64/libc-2.28.so
bc    1929 root mem  REG   8,2  208616   171019
/usr/lib64/libtinfo.so.6.1
bc    1929 root mem  REG   8,2  216912   171009
/usr/lib64/libncurses.so.6.1
bc    1929 root mem  REG   8,2  338648   232638
/usr/lib64/libreadline.so.7.0
bc    1929 root mem  REG   8,2  243520   171107 /usr/lib64/ld-2.28.so
bc    1929 root mem  REG   8,2  337024 134631849
/usr/lib/locale/en_US.utf8/LC_CTYPE
bc    1929 root mem  REG   8,2   26398  67337760 /usr/lib64/gconv/gconv-
modules.cache
bc    1929 root  0u  CHR  136,0   0t0     3 /dev/pts/0
bc    1929 root  1u  CHR  136,0   0t0     3 /dev/pts/0
bc    1929 root  2u  CHR  136,0   0t0     3 /dev/pts/0


#查看指定用户打开的文件
lsof -u root | more

#查看指定目录下被打开的文件,参数+D为递归列出目录下被打开的文件,参数+d为列出目录下被打开的文件
lsof +D /var/log/
lsof +d /var/log/

#查看所有网络连接,通过参数-i查看网络连接的情况,包括连接的ip、端口等以及一些服务的连接情况,例
如:sshd等。也可以通过指定ip查看该ip的网络连接情况
lsof -i –n
lsof -i@127.0.0.1

#查看端口连接情况,通过参数-i:端口可以查看端口的占用情况,-i参数还有查看协议,ip的连接情况等
lsof -i :80 -n

#查看指定进程打开的网络连接,参数-i、-a、-p等,-i查看网络连接情况,-a查看存在的进程,-p指定进
程
lsof -i –n -a -p 9527

#查看指定状态的网络连接,-n:no host names, -P:no port names,-i TCP指定协议,-s指定协议状
态通过多个参数可以清晰的查看网络连接情况、协议连接情况等
lsof -n -P -i TCP -s TCP:ESTABLISHED


#例:利用 lsof 恢复正在使用中的误删除的文件
lsof |grep /var/log/messages
rm -f /var/log/messages
lsof |grep /var/log/messages
cat /proc/653/fd/6
cat /proc/653/fd/6 > /var/log/messages
2.22 信号发送 kill
kill:内部命令,可用来向进程发送控制信号,以实现对进程管理,每个信号对应一个数字,信号名称以SIG开头(可省略),不区分大小写
#常用选项
-SIGNAL
-u uid: effective user,生效者
-U uid: real user,真正发起运行命令者
-t terminal: 与指定终端相关的进程
-l: 显示进程名(pgrep可用)
-a: 显示完整格式的进程名(pgrep可用)
-P pid: 显示指定进程的子进程


#显示当前系统可用信号:
kill -l
trap -l


#查看帮助:man 7 signal


#常用信号:
1) SIGHUP 无须关闭进程而让其重读配置文件
2) SIGINT 中止正在运行的进程;相当于Ctrl+c
3) SIGQUIT 相当于ctrl+\
9) SIGKILL 强制杀死正在运行的进程,可能会导致数据丢失,慎用!
15) SIGTERM 终止正在运行的进程,默认信号
18) SIGCONT 继续运行
19) SIGSTOP 后台休眠


#指定信号的方法 :
    信号的数字标识:1, 2, 9
    信号完整名称:SIGHUP,sighup
    信号的简写名称:HUP,hup


#按PID向进程发送信号:
kill [-s sigspec | -n signum | -sigspec] pid | jobspec ... or kill -l [sigspec]

#例:
kill  -1  pid …
kill  -n 9 pid
kill  -s SIGINT pid
[root@centos8 ~]#kill -int `pidof ping`
[root@centos8 ~]#kill -sigint `pidof ping`


#按名称:killall 来自于psmisc包
killall [-SIGNAL] comm…


#按模式:
pkill [options] pattern


#例:查看HUP信号
#许多服务的支持的reload操作,实际就是发送了HUP信号
#service httpd reload 即相当于 killall -1 httpd
[root@centos6 ~]#grep -A 10 -w reload -m 1 /etc/init.d/httpd
reload() {
  echo -n $"Reloading $prog: "
  if ! LANG=$HTTPD_LANG $httpd $OPTIONS -t >&/dev/null; then
    RETVAL=6
    echo $"not reloading due to configuration syntax error"
   failure $"not reloading $httpd due to configuration syntax error"
  else
    # Force LSB behaviour from killproc
    LSB=1 killproc -p ${pidfile} $httpd -HUP
    RETVAL=$?
    if [ $RETVAL -eq 7 ]; then
[root@centos6 ~]#


#例:利用 0 信号实现进程的健康性检查
[root@centos8 ~]#man kill
If signal is 0, then no actual signal is sent, but error checking is still
performed.


[root@centos8 ~]#killall -0 ping
[root@centos8 ~]#echo $?
0
[root@centos8 ~]#killall -0 ping
ping: no process found
[root@centos8 ~]#echo $?
1
#此方式有局限性,即使进程处于停止或僵尸状态,此方式仍然认为是进程是健康的


#例: pkill和pgrep支持正则表达式
[root@centos8 ~]#pkill '^p'

[root@centos8 ~]#pgrep -a '^p'
9278 pickup -l -t unix -u
9281 ping 1.1.1.1


#例: nginx服务的信号
[root@centos8 ~]#man nginx
  SIGUSR1     Reopen log files.
  SIGUSR2     Upgrade the nginx executable on the fly.
  SIGWINCH     Shut down worker processes gracefully.


[root@;liang-liyun-pc ~]# cat /etc/logrotate.d/nginx
/apps/nginx/logs/*.log {
 daily
 rotate 100
 missingok
 notifempty
 nocompress
 delaycompress
 create 644 nginx nginx
 postrotate
   if [ -f /apps/nginx/logs/nginx.pid ]; then
     kill -USR1 `cat /apps/nginx/logs/nginx.pid`  #发送USR1信号,重新打开日志文件
   fi
 endscript
}
9311 ping 2.2.2.2
2.23 作业管理
Linux的作业控制
前台作业:通过终端启动,且启动后一直占据终端
后台作业:可通过终端启动,但启动后即转入后台运行(释放终端)
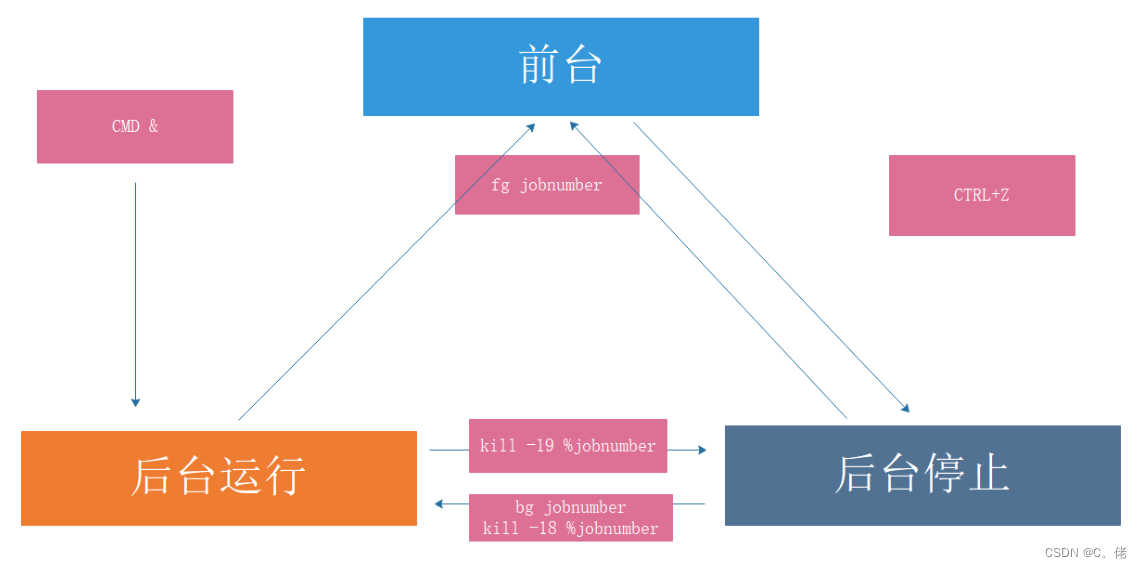
让作业运行于后台
运行中的作业: Ctrl+z
尚未启动的作业: COMMAND &
后台作业虽然被送往后台运行,但其依然与终端相关;退出终端,将关闭后台作业。如果希望送往后台后,剥离与终端的关系
nohup COMMAND &>/dev/null &
screen;COMMAND
tmux;COMMAND
#查看当前终端所有作业:
    jobs


#作业控制:
fg [[%]JOB_NUM]:把指定的后台作业调回前台
bg [[%]JOB_NUM]:让送往后台的作业在后台继续运行
kill [%JOB_NUM]: 终止指定的作业


#例: 后台运行的进程和终端关系
#终端1运行后台进程
[root@centos8 ~]#ping 127.0.0.1 &
[1] 30545

#终端2 可以查看到进程
[root@centos8 ~]#ps aux|grep ping
root    30545  0.0  0.2  32408  2416 pts/0  S   12:25  0:00 ping
127.0.0.1
root    30547  0.0  0.1  12108  988 pts/2  S+  12:25  0:00 grep --
color=auto ping

#关闭终端1后,在终端2查看不到进程
[root@centos8 ~]#ps aux|grep ping
root    30552  0.0  0.1  12108  1084 pts/2  S+  12:25  0:00 grep --
color=auto ping


#例: nohup
[root@centos8 ~]#rpm -qf `which nohup`
coreutils-8.30-6.el8_1.1.x86_64

[root@centos8 ~]#nohup ping 127.0.0.1
nohup: ignoring input and appending output to 'nohup.out'

[root@centos8 ~]#tail -f nohup.out
64 bytes from 127.0.0.1: icmp_seq=16 ttl=64 time=0.037 ms
64 bytes from 127.0.0.1: icmp_seq=17 ttl=64 time=0.040 ms
64 bytes from 127.0.0.1: icmp_seq=18 ttl=64 time=0.042 ms
64 bytes from 127.0.0.1: icmp_seq=19 ttl=64 time=0.047 ms

[root@centos8 ~]#nohup ping 127.0.0.1 &> /dev/null &
[1] 9640

[root@centos8 ~]#ps aux| grep nohup
root     9642  0.0  0.1  12108  992 pts/0  S+  10:28  0:00 grep --
color=auto nohup

[root@centos8 ~]#pstree -p |grep ping
     |-sshd(753)-+-sshd(9415)---sshd(9417)---bash(9446)---ping(9640)


#关闭对应的终端,再观察进程的父进程
[root@centos8 ~]#pstree -p |grep ping
     |-ping(9640)
2.24 并行运行
利用后台执行,实现并行功能,即同时运行多个进程,提高效率
#方法1
cat all.sh
f1.sh&
f2.sh&
f3.sh&


#方法2
(f1.sh&);(f2.sh&);(f3.sh&)


#方法3
f1.sh&f2.sh&f3.sh&


#例:多组命令实现并行
[root@centos8 ~]#{ ping -c3 127.1; ping 127.2; }& { ping -c3 127.3 ;ping 127.4;
}&


#例:
[root@centos8 ~]#cat scanhost.sh
#!/bin/bash
NET=10.0.0
for i in {1..254};do
 { ping -c1 -W1 ${NET}.${i} &> /dev/null && echo ${NET}.${i} is up || echo
${NET}.${i} is down; }&
done
wait


[root@centos8 ~]#cat scan_host.sh
#!/bin/bash

net=10.0.0
for i in {1..254};do
 {
  if ping -c1 -W1 $net.$i &> /dev/null;then
    echo $net.$i is up
  else
    echo $net.$i is down
  fi
 }&
done
wait


[root@centos8 ~]#bash scanhost.sh
10.0.0.7 is up
10.0.0.1 is up
10.0.0.2 is up
10.0.0.6 is up
10.0.0.8 is up
10.0.0.3 is down
10.0.0.5 is down
10.0.0.29 is down
10.0.0.14 is down
10.0.0.15 is down
10.0.0.10 is down
10.0.0.23 is down
10.0.0.12 is down
......
10.0.0.245 is down
10.0.0.246 is down
10.0.0.240 is down
[root@centos8 ~]#
3 任务计划
通过任务计划,可以让系统自动的按时间或周期性任务执行任务
注意: 学习本节需要实现邮件通知,学习内容前必须安装并启动邮件服务
未来的某时间点执行一次任务:
at 指定时间点,执行一次性任务
batch 系统自行选择空闲时间去执行此处指定的任务
周期性运行某任务:
cron
3.1 一次性任务
at 工具
由包 at 提供
依赖与atd服务,需要启动才能实现at任务
at队列存放在/var/spool/at目录中,ubuntu存放在/var/spool/cron/atjobs目录下
执行任务时PATH变量的值和当前定义任务的用户身份一致
#格式:
at [option] TIME


#常用选项:
-V 显示版本信息
-t time   时间格式 [[CC]YY]MMDDhhmm[.ss]
-l 列出指定队列中等待运行的作业;相当于atq
-d N 删除指定的N号作业;相当于atrm
-c N 查看具体作业N号任务
-f file 指定的文件中读取任务
-m 当任务被完成之后,将给用户发送邮件,即使没有标准输出


注意:
作业执行命令的结果中的标准输出和错误以执行任务的用户身份发邮件通知给 root
默认CentOS 8 最小化安装没有安装邮件服务,需要自行安装


#TIME:定义出什么时候进行 at 这项任务的时间
HH:MM [YYYY-mm-dd]
noon, midnight, teatime(4pm),tomorrow
now+#{minutes,hours,days, OR weeks}


#例:at 时间格式
HH:MM 在今日的 HH:MM 进行,若该时刻已过,则明天此时执行任务
02:00

HH:MM YYYY-MM-DD  规定在某年某月的某一天的特殊时刻进行该项任务
02:00 2016-09-20

HH:MM[am|pm] [Month] [Date]
06pm March 17
17:20 tomorrow

HH:MM[am|pm] + number [minutes|hours|days|weeks], 在某个时间点再加几个时间后才进行该项
任务
now + 5 min
02pm + 3 days


#at 任务执行方式:
交互式
输入重定向
at -f file
/etc/at.{allow,deny} 控制用户是否能执行at任务
白名单:/etc/at.allow 默认不存在,只有该文件中的用户才能执行at命令
黑名单:/etc/at.deny 默认存在,拒绝该文件中用户执行at命令,而没有在at.deny 文件中的使用
者则可执行
如果两个文件都不存在,只有 root 可以执行 at 命令


例: ubuntu at任务存放路径
[root@ubuntu2004 ~]#ll /var/spool/cron/
total 20
drwxr-xr-x 5 root  root   4096 Apr 23  2020 ./
drwxr-xr-x 5 root  root   4096 Dec 12 17:42 ../
drwxrwx--T 2 daemon daemon  4096 Dec 12 17:47 atjobs/
drwxrwx--T 2 daemon daemon  4096 Dec 12 17:47 atspool/
drwx-wx--T 2 root  crontab 4096 Feb 14  2020 crontabs/


[root@ubuntu2004 ~]#ll /var/spool/cron/atjobs/
total 16
drwxrwx--T 2 daemon daemon 4096 Dec 12 17:47 ./
drwxr-xr-x 5 root  root  4096 Apr 23  2020 ../
-rwx------ 1 root  daemon 2875 Dec 12 17:36 a000010198e058*
-rw------- 1 daemon daemon   6 Dec 12 17:46 .SEQ
3.2 周期性任务计划 cron
周期性任务计划cron相关的程序包:
cronie:主程序包,提供crond守护进程及相关辅助工具
crontabs:包含CentOS提供系统维护任务
cronie-anacron:cronie的补充程序,用于监控cronie任务执行状况,如:cronie中的任务在过去该运行的时间点未能正常运行,则anacron会随后启动一次此任务
#cron 依赖于crond服务,确保crond守护处于运行状态:

#CentOS 7 以后版本:
systemctl status crond

#CentOS 6:
service crond status


#cron任务分为
    系统cron任务:系统维护作业,/etc/crontab 主配置文件, /etc/cron.d/ 子配置文件
    用户cron任务:红帽系统保存在 /var/spool/cron/USERNAME,Ubuntu 系统存放
    在/var/spool/cron/crontabs/USERNAME,利用 crontab 命令管理

#计划任务日志:/var/log/cron
3.2.1 系统cron计划任务
/etc/crontab 格式说明,详情参见 man 5 crontab
#注释行以 # 开头
[root@centos8 ~]#cat /etc/crontab
SHELL=/bin/bash   #默认的SHELL类型
PATH=/sbin:/bin:/usr/sbin:/usr/bin  #默认的PATH变量值,可修改为其它路径
MAILTO=root             #默认标准输出和错误发邮件给root,可以指向其它用户

# For details see man 4 crontabs
# Example of job definition:
# .---------------- minute (0 - 59)
# | .------------- hour (0 - 23)
# | | .---------- day of month (1 - 31)
# | | | .------- month (1 - 12) OR jan,feb,mar,apr ...
# | | | | .---- day of week (0 - 6) (Sunday=0 or 7) OR
sun,mon,tue,wed,thu,fri,sat
# | | | | |
# * * * * * user-name command to be executed


#计划任务时间表示法:
(1) 特定值
    给定时间点有效取值范围内的值
(2) *
    给定时间点上有效取值范围内的所有值,表示“每...”,放在星期的位置表示不确定
(3) 离散取值
    #,#,#
(4) 连续取值
    #-#
(5) 在指定时间范围上,定义步长
    /#: #即为步长
(6) 特定关健字
    @yearly 0 0 1 1 *
    @annually 0 0 1 1 *
    @monthly 0 0 1 * *
    @weekly 0 0 * * 0
    @daily 0 0 * * *
    @hourly 0 * * * *
    @reboot Run once after reboot


#例:
[root@centos8 ~]#man 5 crontab
For example, "0-23/2" can be used in the 'hours' field to specify command
execution for every other hour (the alternative in the V7 standard is
"0,2,4,6,8,10,12,14,16,18,20,22")

#例:每个月日期和星期几字段的关系
[root@centos8 ~]#man 5 crontab
Note: The day of a command's execution can be specified in the following two
fields — 'day of  month', and 'day of week'. If both fields are restricted
(i.e., do not contain the "*" character), the command will be run when either
field matches the current time. For example, "30 4 1,15 * 5" would cause a
command to be run at 4:30 am on the 1st and 15th of each month, plus every
Friday.


##晚上9点10分运行echo命令,输出信息仍会发送到root 邮箱
10 21 * * * liang /bin/echo "Howdy!"
#每3小时echo和wall命令
0 */3 * * * liang /bin/echo “howdy”;  wall “welcome to baidu!”


#crond任务相关文件:
/etc/crontab 配置文件
/etc/cron.d/ 配置文件
/etc/cron.hourly/ 脚本
/etc/cron.daily/ 脚本
/etc/cron.weekly/ 脚本
/etc/cron.monthly/ 脚本
3.2.2 用户计划任务
crontab命令:
每个用户都有专用的cron任务文件:/var/spool/cron/USERNAME
默认标准输出和错误会被发邮件给对应的用户,如:liang创建的任务就发送至liang的邮箱
root能够修改其它用户的作业
用户的cron 中默认 PATH=/usr/bin:/bin,如果使用其它路径,在任务文件的第一行加PATH=/path或者加入到计划任务执行的脚本中
第六个字段指定要运行的命令。 该行的整个命令部分,直至换行符或“%”字符,指定的shell执行.除非使用反斜杠(\)进行转义,否则该命令中的“%”字符将变为换行符,并且第一个%之后的所有数据将作为标准输入发送到该命令。
#crontab命令格式:
crontab [-u user] [-l | -r | -e] [-i]


#常用选项:
-l 列出所有任务
-e 编辑任务
-r 移除所有任务
-i 同-r一同使用,以交互式模式移除指定任务
-u user 指定用户管理cron任务,仅root可运行


#控制用户执行计划任务:
/etc/cron.{allow,deny}


#例:修改默认的cron的文本编辑工具
#Ubuntu默认的cron文本编辑器是nano可以修改为vim

root@ubuntu1804:~# crontab -e
no crontab for root - using an empty one
Select an editor. To change later, run 'select-editor'.
 1. /bin/nano    <---- easiest
 2. /usr/bin/vim.basic
 3. /usr/bin/vim.tiny
 4. /bin/ed
Choose 1-4 [1]:

root@ubuntu1804:~# cat /etc/profile.d/env.sh
export EDITOR=vim


#例:PATH变量
#方法1,在计划任务配置中指定PATH
[root@centos8 ~]#crontab -l
PATH=/usr/local/sbin:/usr/local/bin:/usr/sbin:/usr/bin:/root/bin
* * * * * useradd hehe;echo $PATH

#方法2,在脚本中指定PATH变量
[root@centos8 ~]#crontab -l
* * * * * /data/test.sh

[root@centos8 ~]#cat /data/test.sh
#!/bin/bash
PATH=/usr/local/sbin:/usr/local/bin:/usr/sbin:/usr/bin:/root/bin
useradd hehe
echo $PATH


#例:
[root@centos8 ~]#cat /usr/bin/disk_check.sh
#!/bin/bash
WARNING=10
df | sed -En '/^\/dev\/sd/s@^([^ ]+).* ([0-9]+)%.*@\1 \2@p'| while read DEVICE
USE;do
 [ $USE -gt $WARNING ] && echo "$DEVICE will be full,USE:$USE" | mail -s
diskfull root
done
[root@centos8 ~]#crontab -l
*/10 * * * * check_disk.sh


[root@centos8 ~]#cat check_disk.sh
#!/bin/bash
df | awk  -F ' +|%'  '/^\/dev\/sd/{if($5 > 10){system("echo "$1" will be
full,use:" $5 "| mail -s warning root@youxiang.com")} }'

[root@centos8 ~]#crontab -l
*/10 * * * * /root/check_disk.sh


[root@centos8 ~]#cat check_disk2.sh
#!/bin/bash
WARNING=2
df | awk  -F ' +|%'  '/^\/dev\/sd/{print $1,$5}'|while read DISK USE;do
if [ $USE -gt $WARNING ];then
 echo "$DISK will be full,use:$USE" | mail -s diskwarning
root@youxiang.com
fi
done

[root@centos8 ~]#crontab -l
*/10 * * * * /root/check_disk2.sh


#11月每天的6-12点之间每隔2小时执行/app/bin/test.sh

#在6,8,10,12点整共4次分别执行test.sh
[root@centos8 ~]#crontab -l
0 6-12/2 * 11 * /app/bin/test.sh

#以下配置只会在5,7,9,11点整执行
0 5-12/2 * 11 * /app/bin/test.sh


#注意:运行结果的标准输出和错误以邮件通知给相关用户
(1) COMMAND > /dev/null
(2) COMMAND &> /dev/null


#cron任务中不建议使用%,它有特殊用途,它表示换行的特殊意义,且第一个%后的所有字符串会被将
成当作命令的标准输入,如果在命令中要使用%,则需要用 \ 转义
注意:将%放置于单引号中是不支持的

#例: 在crontab中%的用法
30 2 * * * /bin/cp -a /etc/ /data/etc`date +\%F_\%T`
30 2 * * * /bin/cp -a /etc/ /data/etc`date +‘%F_%T’`  有问题


#例: 在crontab中%的用法
[root@centos8 ~]#crontab -l
* * * * *  mail -s "test" liang%liang,%%how are you?%

[root@centos8 ~]# cat /var/spool/mail/liang
From root@centos8.localdomain Sat Jul  4 23:58:01 2020
Return-Path: <root@centos8.localdomain>
X-Original-To: liang
Delivered-To: liang@centos8.localdomain
Received: by centos8.localdomain (Postfix, from userid 0)
id 0B03860272; Sat,  4 Jul 2020 23:58:01 +0800 (CST)
Date: Sat, 04 Jul 2020 23:58:01 +0800
To: liang@centos8.localdomain
Subject: test
User-Agent: Heirloom mailx 12.5 7/5/10
MIME-Version: 1.0
Content-Type: text/plain; charset=us-ascii
Content-Transfer-Encoding: 7bit
Message-Id: <20220704155801.0B03860272@centos8.localdomain>
From: root@centos8.localdomain (root)
liang,
how are you?
[root@centos8 ~]#
思考:
(1) 如何在秒级别运行任务?
for min in 0 1 2; do echo "hi"; sleep 20; done(2) 如何实现每7分钟运行一次任务?
sleep命令:

sleep NUMBER[SUFFIX]...
SUFFIX:
s: 秒, 默认
m: 分
h: 小时
d: 天


#例
[root@centos8 ~]#usleep
warning: usleep is deprecated, and will be removed in near future!
warning: use "sleep 1e-06" instead...


#例:
[root@centos8 ~]#time usleep 1000000
warning: usleep is deprecated, and will be removed in near future!
warning: use "sleep 1" instead...
real 0m1.001s
user 0m0.001s
sys 0m0.000s
You have new mail in /var/spool/mail/root

[root@centos8 ~]#time ls
all.sh anaconda-ks2.cfg at.txt scanhost.sh
real 0m0.004s
user 0m0.001s
sys 0m0.003s

[root@centos8 ~]#time sleep 0.2
real 0m0.202s
user 0m0.001s
sys 0m0.000s


 2356
2356


 被折叠的 条评论
为什么被折叠?
被折叠的 条评论
为什么被折叠?
 到【灌水乐园】发言


