


vue+openlayers实现行政边界、标注交互、效果弹窗
需求
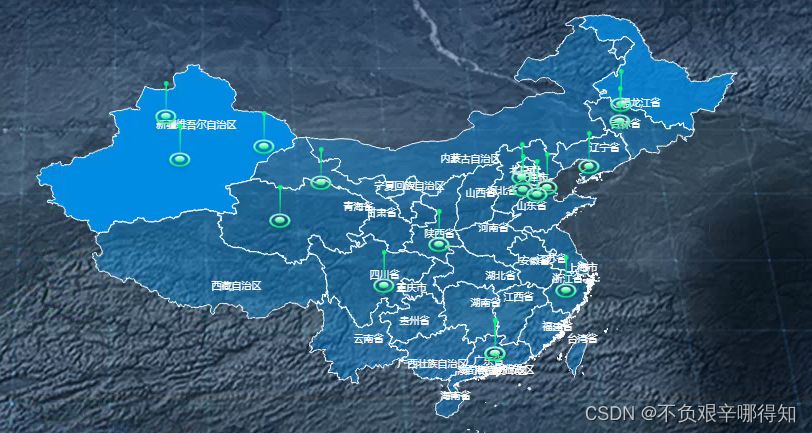
- 1.实现中国行政区划地图展示。
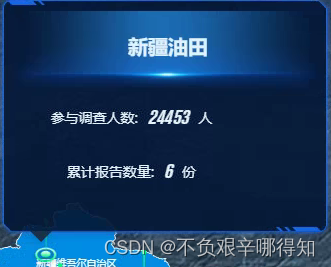
- 2.地图标注出每个省份的数据结果,hover交互查看详情。
- 3.参与人数越多的对应省份颜色越深。
最终效果
环境安装/依赖引入
OpenLayers通过NPM 安装
npm install ol -S
引入依赖
import chinaData from '@/assets/chinaBj.json'  //中国区划json文件
import './map.css' //自定义地图样式
import Point from 'ol/geom/Point'
import Polygon from 'ol/geom/Polygon'
import Feature from 'ol/Feature'
import Map from 'ol/Map'
import Overlay from 'ol/Overlay'
import View from 'ol/View'
import { Fill, Stroke, Style, Icon, Text } from 'ol/style'
import { Vector as VectorSource } from 'ol/source'
import { Vector as VectorLayer } from 'ol/layer'
html部分
map为地图实例
popup为自定义弹框
<template>
  <div class="box">
    <div id="map" class="map"></div>
    <div id="popup" class="ol-popup">
      <div id="popup-content" class="popup-content"></div>
    </div>
  </div>
</template>
逻辑部分
1.创建变量/初始化地图/常量
//用来存储 后端返回的省市名称
let provinces = []
//通过不同的省市名称 动态生成地图区划颜色
var getColorByDGP = function(adcode) {
  var r = 3
  var g = 140
  var b = 230
  //
  let index = provinces.findIndex(d => d.provinceCode === adcode)
  if (index === -1) {
  //默认颜色
    let a = 4 / 10
    return 'rgba(' + r + ',' + g + ',' + b + ',' + a + ')'
  } else {
 //数量越多 颜色越深
    let a = provinces[index].resultCount / 5
    return 'rgba(' + r + ',' + g + ',' + b + ',' + a + ')'
  }
}
data() {
    return {
      // 地图实例
      map: null,
      // 底图行政区划
      vectorLayer: null,
      // 弹窗对象
      overlay: null,
      // 标记集合
      sourceArr: null,
      // 公司数据源
      companyList: []
    }
  },
mounted() {
    // 创建地图实例
    this.vectorLayer = new VectorLayer({
      source: new VectorSource()
    })
    var map = new Map({
      layers: [this.vectorLayer],
      target: 'map',
      view: new View({
        zooms: [4, 5],//缩放层级
        center: [102.122082, 33.719192], //中心点的经纬度
        zoom: 4, //初始层级
        projection: 'EPSG:4326'
      })
    })
    // 地图实例
    this.map = map
    // 加载中国区划
    this.getReportList()
    // 添加弹窗
    this.addPopup()
  },
2.拿到后台数据/通过json加载中国区划
因为要实现根据后端数据来动态显示 地图颜色深浅,所以需要在异步加载完数据后 加载地图 并生成标注
// 后端获取点数据 (地图JSON数据和接口假数据会放在文章最后 以便调试)
    getReportList() {
      getAction('/qn_manage/controlCabin/company').then(res => {
        if (res.success) {
          this.companyList = res.result.companies
          provinces = res.result.provinces
          //通过Json加载区划图
          this.loadFeatures(chinaData)
          // 生成标注
          this.groundgreendot(this.companyList)
        } else {
          this.$message.error(res.message)
        }
      })
    },
加载地图、名称、配置区划颜色
  // 加载中国地图区划
    loadFeatures(data) {
      this.clearLayer(this.vectorLayer)
      let features = []
      // 遍历JSON
      data.forEach(item => {
        let feature = new Feature({
          geometry: new Polygon(item.coordinates),
          name: item.name,
          center: item.center,
          code: item.code,
          level: item.level
        })
        // 配置区划颜色
        feature.setStyle(this.polygonStyle(item.code))
        features.push(feature)
        // 加载地名和点
        this.loadPoint(item.center, item.name)
      })
      this.vectorLayer.getSource().addFeatures(features)
      //让地图自适应
      this.fitLayer(this.vectorLayer)
    },
动态配置区划要素的颜色
  // 配置样式和颜色
    polygonStyle(code) {
      // 根据后端数据生成颜色  数量越多 颜色越来越深
      const color = getColorByDGP(code)
      return new Style({
        stroke: new Stroke({
          color: `rgba(255,255,255,1)`,
          width: 1
        }),
        fill: new Fill({
          color: color
        })
      })
    },
地图自适应图层所在元素的范围
    fitLayer(layer) {
       let extent = layer.getSource().getExtent()
       this.map.getView().fit(extent)
    },
3.添加标注
生成标注
 // 创建标注 入参为后端的数据
    groundgreendot(mapListdataS) {
      this.removeLayerByName('地面显示点')
      //创建画板
      if (mapListdataS && mapListdataS[0]) {
        this.sourceArr = new VectorSource({})
        const [x1, y1, x2, y2] = this.map.getView().calculateExtent()
        //过滤后端没有location字段的数据
        mapListdataS = mapListdataS.filter(d => d.location)
        for (var i = 0; i <= mapListdataS.length - 1; i++) {
          //点的坐标信息
          const lon = mapListdataS[i].location.split(',')[0]
          const lat = mapListdataS[i].location.split(',')[1]
          if (lon <= x2 && lon >= x1 && lat <= y2 && lat >= y1) {
            let coordinates = [lon, lat]
            //将点的信息存入self中
            let feature = new Feature({
              geometry: new Point(coordinates),
              self: mapListdataS[i]
            })
            // 设置点样式
            let markerStyle = new Style({
              //设置icon大小
              image: new Icon({
                scale: 0.8, //大小
                src: count //图片
              })
            })
            //设置样式
            feature.setStyle(markerStyle)
            //添加
            this.sourceArr.addFeature(feature)
            // 给要素添加 悬浮样式修改
            // this.setIconStyle()
          }
        }
        //LayerVec /VectorLayer  这两种都可以
        var layer = new VectorLayer({
          source: this.sourceArr,
          visible: true, //先测试下,这样就行了,设置true或者false=
          name: '地面显示点' //设置图层名称,根据名称查找图层
        })
        this.map.addLayer(layer)
      }
    },
通过名字删除图层
 // 通过名字删除图层
    removeLayerByName(name) {
      var layersToRemove = []
      this.map.getLayers().forEach(function(layer) {
        if (layer.get('name') != undefined && layer.get('name') === name) {
          layersToRemove.push(layer)
        }
      })
      var len = layersToRemove.length
      for (var i = 0; i < len; i++) {
        this.map.removeLayer(layersToRemove[i])
      }
    },
4.添加弹窗
 // 添加弹窗
    addPopup(evt, evtFeature) {
      // 使用变量存储弹窗所需的 DOM 对象
      var container = document.getElementById('popup')
      var closer = document.getElementById('popup-closer')
      var content = document.getElementById('popup-content')

      // 创建一个弹窗 Overlay 对象
      this.overlay = new Overlay({
        element: container, //绑定 Overlay 对象和 DOM 对象的
        autoPan: true, // 定义弹出窗口在边缘点击时候可能不完整 设置自动平移效果
        autoPanAnimation: {
          duration: 250 //自动平移效果的动画时间 9毫秒
        }
      })
      // 将弹窗添加到 map 地图中
      this.map.addOverlay(this.overlay)
      let _that = this
      /**
       * 添加单击响应函数来处理弹窗动作 pointermove
       */
      this.map.on('pointermove', async evt => {
        //判断鼠标是否悬停在要素上
        let feature = evtFeature
          ? evtFeature
          : this.map.forEachFeatureAtPixel(evt.pixel, function(feature, layer) {
              return feature
            })
        // 如果要素 存在且有数据
        if (feature != undefined && feature.values_.self) {
          // 改变鼠标样式
          _that.map.getTargetElement().style.cursor = 'pointer'
          //拿数据
          const data = feature.values_.self
          // 画弹窗样式
          const contentHtml = `<div class='myContent' >
                            <div class='myContentTitle'>${data.companyName}</div>
                            <div class='myContentData'>
                            <div class='myContentItem' >
                              <div  class='left'>参与调查人数: </div>
                              <div class='right'>${data.personCount}</div><div style='flex:1'>人</div>
                            </div>
                            <div class='myContentItem' >
                              <div class='left'>累计报告数量: </div>
                              <div class='right'> ${data.reportCount}</div><div style='flex:1'>份</div>
                            </div>
                            </div>
                        </div>`
          content.innerHTML = contentHtml
          content.style.display = 'block'
          content.style.left = evt.pixel[0] - 120 + 'px'
          content.style.top = evt.pixel[1] - 270 + 'px'
          _that.overlay.setPosition(evt.coordinate)
        } else {
          //鼠标没有悬停在要素上
          _that.map.getTargetElement().style.cursor = 'auto'
          content.style.display = 'none'
          _that.overlay.setPosition(undefined)
        }
      })
    }
5.CSS样式
/* 新弹框*/

#popup-content {
    /* position: absolute; */
    top: 10px;
    left: 50px;
    /* background-color: #000000; */
    border-radius: 6px;
    z-index: 999999;
    display: none;
    border-radius: 4px;
    color: #000;
    padding: 10px 10px 10px 20px;
    width: 100%;
}

.ol-popup {
    position: absolute;
    /* background-color: white; */
    -webkit-filter: drop-shadow(0 1px 4px rgba(0, 0, 0, 0.2));
    filter: drop-shadow(0 1px 4px rgba(0, 0, 0, 0.2));
    border-radius: 10px;
    bottom: 12px;
    left: -50px;
    background: url(../../assets/img/brand/contentBg.png) no-repeat top center;
    background-size: 100% 100%;
    border-radius: 5px;
    width: 4.25rem/* 340px -> 4.25rem */
    ;
    height: 3.0625rem/* 245px -> 3.0625rem */
    ;
}

#popup-content .myContentTitle {
    background: url(../../assets/img/brand/contentTitle.png) no-repeat top center;
    background-size: 100% 100%;
    text-align: center;
    font-size: 20px;
    font-weight: bold;
    color: #e4f2fb;
    line-height: 87px;
    height: 87px;
}

#popup-content .myContentData {
    display: flex;
    flex-direction: column;
    justify-content: space-around;
    align-items: center;
    height: calc(100% - 87px);
}

#popup-content .myContentData .myContentItem {
    flex: 1;
    width: 100%;
    padding: 20px;
    font-size: 14px;
    font-family: Microsoft YaHei;
    font-weight: 400;
    color: #e4f2fb;
    display: flex;
    flex-direction: row;
    justify-content: space-around;
    line-height: 100%;
}

#popup-content .myContentData .myContentItem .left {
    flex: 1;
    text-align: right;
}

#popup-content .myContentData .myContentItem .right {
    font-size: 20px;
    font-family: 'AkzidenzGroteskBE-BoldCn';
    font-weight: bold;
    font-style: italic;
    opacity: 1;
    color: #e4f2fb;
    margin-left: 10px;
    margin-right: 10px;
}


/* 下边的倒三角 */

.ol-popup:after,
.ol-popup:before {
    top: 97%;
    border: solid transparent;
    content: " ";
    height: 0;
    width: 0;
    position: absolute;
    pointer-events: none;
}

.ol-popup:after {
    border-top-color: #1d2e4c;
    border-width: 10px;
    left: 48px;
    margin-left: -10px;
}

.ol-popup:before {
    border-top-color: #1d2e4c;
    border-width: 11px;
    left: 48px;
    margin-left: -11px;
}

.popup-content {
    width: 400px;
}


/* 关闭左上角放大缩小 */

.ol-zoom {
    display: none;
}
完整代码
<!--
 * @Author: yangxiunan
 * @Date: 2020-10-20 17:06:42
 * @LastEditTime: 2020-10-27 10:20:26
 * @LastEditors: Please set LastEditors
 * @Description: In User Settings Edit
 * @FilePath: \cesium-city3dd:\myCode\ol6\src\components\loadJson.vue
-->
<template>
  <div class="box">
    <div id="map" class="map"></div>
    <div id="popup" class="ol-popup">
      <div id="popup-content" class="popup-content"></div>
    </div>
  </div>
</template>
<script>
import chinaData from "./chinaBj.json";
import "./map.css";
import Point from "ol/geom/Point";
import Polygon from "ol/geom/Polygon";
import Feature from "ol/Feature";
import Map from "ol/Map";
import Overlay from "ol/Overlay";
import View from "ol/View";
import { Fill, Stroke, Style, Icon, Text } from "ol/style";
import { Vector as VectorSource } from "ol/source";
import { Vector as VectorLayer } from "ol/layer";
import { getAction } from "@/api/manage";
import count from "./position.png";
// 标注触发Hover 时改变样式
// import Select from 'ol/interaction/Select'
// import { pointerMove } from 'ol/events/condition'
// import active from '@/assets/img/brand/selectPosition.png'
let provinces = [];
var getColorByDGP = function (adcode) {
  var r = 3;
  var g = 140;
  var b = 230;
  //
  let index = provinces.findIndex((d) => d.provinceCode === adcode);
  if (index === -1) {
    let a = 4 / 10;

    return "rgba(" + r + "," + g + "," + b + "," + a + ")";
  } else {
    let a = provinces[index].resultCount / 5;
    return "rgba(" + r + "," + g + "," + b + "," + a + ")";
  }
};
export default {
  name: "myMap",

  data() {
    return {
      // 地图实例
      map: null,
      // 底图行政区划
      vectorLayer: null,
      // 弹窗对象
      overlay: null,
      // 标记集合
      sourceArr: null,
      // 公司数据源
      companyList: [],
    };
  },
  mounted() {
    // 创建地图实例
    this.vectorLayer = new VectorLayer({
      source: new VectorSource(),
    });
    var map = new Map({
      layers: [this.vectorLayer],
      target: "map",
      view: new View({
        zooms: [4, 5],
        center: [102.122082, 33.719192],
        zoom: 4,
        projection: "EPSG:4326",
      }),
    });
    this.map = map;
    // 加载中国区划
    this.getReportList();
    // 添加弹窗
    this.addPopup();
  },

  methods: {
    // 后端获取点数据
    getReportList() {
      getAction("/qn_manage/controlCabin/company").then((res) => {
        if (res.success) {
          this.companyList = res.result.companies;
          provinces = res.result.provinces;

          //加载底图
          this.loadFeatures(chinaData);
          // 打点
          this.groundgreendot(this.companyList);
        } else {
          this.$message.error(res.message);
        }
      });
    },

    // 加载底图
    loadFeatures(data) {
      this.clearLayer(this.vectorLayer);
      let features = [];
      // 遍历JSON
      data.forEach((item) => {
        let feature = new Feature({
          geometry: new Polygon(item.coordinates),
          name: item.name,
          center: item.center,
          code: item.code,
          level: item.level,
        });
        // 设置地图 颜色
        feature.setStyle(this.polygonStyle(item.code));
        features.push(feature);
        // 加载地名和点
        this.loadPoint(item.center, item.name);
      });
      this.vectorLayer.getSource().addFeatures(features);
      this.fitLayer(this.vectorLayer);
    },
    // 创建要素
    groundgreendot(mapListdataS) {
      this.removeLayerByName("地面显示点");
      //创建画板
      if (mapListdataS && mapListdataS[0]) {
        this.sourceArr = new VectorSource({});
        const [x1, y1, x2, y2] = this.map.getView().calculateExtent();
        mapListdataS = mapListdataS.filter((d) => d.location);
        for (var i = 0; i <= mapListdataS.length - 1; i++) {
          //点的坐标信息
          const lon = mapListdataS[i].location.split(",")[0];
          const lat = mapListdataS[i].location.split(",")[1];
          if (lon <= x2 && lon >= x1 && lat <= y2 && lat >= y1) {
            let coordinates = [lon, lat];
            //将点的信息存入self中
            let feature = new Feature({
              geometry: new Point(coordinates),
              self: mapListdataS[i],
            });
            // 设置点样式
            let markerStyle = new Style({
              //设置icon大小
              image: new Icon({
                scale: 0.8, //大小
                src: count, //图片
              }),
            });
            //设置样式
            feature.setStyle(markerStyle);
            //添加
            this.sourceArr.addFeature(feature);
            // 给要素添加 悬浮样式修改
            // this.setIconStyle()
          }
        }
        //LayerVec /VectorLayer  这两种都可以
        var layer = new VectorLayer({
          source: this.sourceArr,
          visible: true, //先测试下,这样就行了,设置true或者false=
          name: "地面显示点", //设置图层名称,根据名称查找图层
        });

        this.map.addLayer(layer);
      }
    },
    // 加载地名和点
    loadPoint(point, text, code) {
      let feature = new Feature({
        geometry: new Point(point),
      });
      feature.setStyle(() => {
        return new Style({
          text: new Text({
            text: text,
            stroke: new Stroke({
              color: "rgba(29,233,182,0)",
            }),
            fill: new Fill({
              color: "rgba(255,255,255,1)",
            }),
            textAlign: "center",
            // textBaseline: 'bottom',
          }),
        });
      });
      this.vectorLayer.getSource().addFeature(feature);
    },
    // 清除图层
    clearLayer(layer) {
      layer.getSource().clear();
    },
    // 地图自适应图层所在元素的范围
    fitLayer(layer) {
      // let extent = layer.getSource().getExtent()
      // this.map.getView().fit(extent)
    },
    // polygon样式
    polygonStyle(code) {
      // 根据后端数据生成颜色 颜色约深 数量越多
      const color = getColorByDGP(code);
      return new Style({
        stroke: new Stroke({
          color: `rgba(255,255,255,1)`,
          width: 1,
        }),
        fill: new Fill({
          color: color,
        }),
      });
    },

    // 通过名字删除图层
    removeLayerByName(name) {
      var layersToRemove = [];
      this.map.getLayers().forEach(function (layer) {
        if (layer.get("name") != undefined && layer.get("name") === name) {
          layersToRemove.push(layer);
        }
      });
      var len = layersToRemove.length;
      for (var i = 0; i < len; i++) {
        this.map.removeLayer(layersToRemove[i]);
      }
    },
    // 添加弹窗
    addPopup(evt, evtFeature) {
      // 使用变量存储弹窗所需的 DOM 对象
      var container = document.getElementById("popup");
      var closer = document.getElementById("popup-closer");
      var content = document.getElementById("popup-content");

      // 创建一个弹窗 Overlay 对象
      this.overlay = new Overlay({
        element: container, //绑定 Overlay 对象和 DOM 对象的
        autoPan: true, // 定义弹出窗口在边缘点击时候可能不完整 设置自动平移效果
        autoPanAnimation: {
          duration: 250, //自动平移效果的动画时间 9毫秒
        },
      });
      // 将弹窗添加到 map 地图中
      this.map.addOverlay(this.overlay);
      let _that = this;
      /**
       * 添加单击响应函数来处理弹窗动作 pointermove
       */
      this.map.on("pointermove", async (evt) => {
        //判断鼠标是否悬停在要素上
        let feature = evtFeature
          ? evtFeature
          : this.map.forEachFeatureAtPixel(
              evt.pixel,
              function (feature, layer) {
                return feature;
              }
            );
        // 如果要素 存在且有数据
        if (feature != undefined && feature.values_.self) {
          // 改变鼠标样式
          _that.map.getTargetElement().style.cursor = "pointer";
          //拿数据
          const data = feature.values_.self;
          // 画弹窗样式
          const contentHtml = `<div class='myContent' >
                            <div class='myContentTitle'>${data.companyName}</div>
                            <div class='myContentData'>
                            <div class='myContentItem' >
                              <div  class='left'>参与调查人数: </div>
                              <div class='right'>${data.personCount}</div><div style='flex:1'>人</div>
                            </div>
                            <div class='myContentItem' >
                              <div class='left'>累计报告数量: </div>
                              <div class='right'> ${data.reportCount}</div><div style='flex:1'>份</div>
                            </div>
                            </div>
                        </div>`;
          content.innerHTML = contentHtml;
          content.style.display = "block";
          content.style.left = evt.pixel[0] - 120 + "px";
          content.style.top = evt.pixel[1] - 270 + "px";
          _that.overlay.setPosition(evt.coordinate);
        } else {
          //鼠标没有悬停在要素上

          _that.map.getTargetElement().style.cursor = "auto";
          content.style.display = "none";
          _that.overlay.setPosition(undefined);
        }
      });
    },

  },
};
</script>
<style lang="less" scoped>
.box {
  width: 100%;
  height: 100%;
  position: relative;
  // background: rgba(9,15,39,1);

  #map {
    width: 100%;
    height: 100%;
  }
}
</style>
附件
包括中国区划JSON,测试数据,图片文件等
百度网盘链接
链接: https://pan.baidu.com/s/110Mu6Ioonp9ztHRD0Yq6JQ 密码: mrqs


 2669
2669


 被折叠的 条评论
为什么被折叠?
被折叠的 条评论
为什么被折叠?
 到【灌水乐园】发言


