


准备工作:
确认需要安装的 Skywalking 和 Elasticsearch 版本,以及需要的 JDK 版本。这里安装的是 elasticsearch-7.12.0 和 apache-skywalking-apm-es7-8.4.0 版本,使用 jdk-11.0.10。下载地址如下:
Elasticsearch 不允许 Linux 使用 root 用户启动,建议提前创建用户并授权。
将 JDK 版本包上传解压至 /opt/ 目录,在用户目录下 .bash_profile 文件中添加 JDK 环境变量配置,执行“sourcec .bash_profile”命令使其生效。
export JAVA_HOME=/opt/jdk-11.0.10
export CLASSPATH=.:$JAVA_HOME/lib/dt.jar:$JAVA_HOME/lib/tools.jar
export PATH=$JAVA_HOME/bin:$PATH:$HOME/bin
Elasticsearch安装
tar -zxvf elasticsearch-7.12.0-linux-x86_64.tar.gz修改 Elasticsearch 配置:config/elasticsearch.yml
#集群名
cluster.name: my-application
#节点名
node.name: node-1
#数据存储路径
path.data: /home/esb/elasticsearch-7.12.0/data
#日志存储路径
path.logs: /home/esb/elasticsearch-7.12.0/logs
#ES监听的IP地址
network.host: 192.168.127.130
#访问端口
http.port: 9200
#通信地址
discovery.seed_hosts: ["127.0.0.1"]
#master节点名称
cluster.initial_master_nodes: ["node-1"]
## 需要开启跨域才能给elasticsearch-head,kibana等连接
http.cors.enabled: true #是否支持跨域,默认为false
http.cors.allow-origin: "*" #当设置允许跨域,默认为*,表示支持所有域名
http.cors.allow-headers: Authorization,X-Requested-With,Content-Length,Content-Type
修改 jvm 参数配置:config/jvm.options(此处使用默认配置)
修改系统内核参数:/etc/sysctl.conf,执行“sysctl -p”使其生效
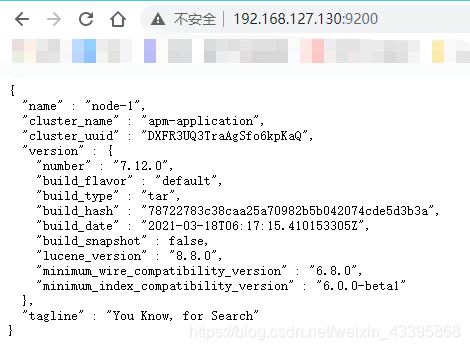
vm.max_map_count=262144启动 Elasticsearch:./bin/elasticsearch -d,访问 ip:9200,出现以下信息即为启动成功
Skywalking安装
tar -zxvf apache-skywalking-apm-es7-8.4.0.tar.gzSkywalking OAP 配置、启动
修改 OAP 配置文件 config/application.yml,执行“./bin/oapService.sh”启动
# Licensed to the Apache Software Foundation (ASF) under one or more
# contributor license agreements.  See the NOTICE file distributed with
# this work for additional information regarding copyright ownership.
# The ASF licenses this file to You under the Apache License, Version 2.0
# (the "License"); you may not use this file except in compliance with
# the License.  You may obtain a copy of the License at
#
#     http://www.apache.org/licenses/LICENSE-2.0
#
# Unless required by applicable law or agreed to in writing, software
# distributed under the License is distributed on an "AS IS" BASIS,
# WITHOUT WARRANTIES OR CONDITIONS OF ANY KIND, either express or implied.
# See the License for the specific language governing permissions and
# limitations under the License.

#集群配置
cluster:
  #选择哪一种集群模式
  selector: ${SW_CLUSTER:standalone}
  #单机版
  standalone:
  # Please check your ZooKeeper is 3.5+, However, it is also compatible with ZooKeeper 3.4.x. Replace the ZooKeeper 3.5+
  # library the oap-libs folder with your ZooKeeper 3.4.x library.
  #zk注册集群配置
  zookeeper:
    nameSpace: ${SW_NAMESPACE:""}
    hostPort: ${SW_CLUSTER_ZK_HOST_PORT:localhost:2181}
    ## Retry Policy 重试策略
    #初始化等待时间
    baseSleepTimeMs: ${SW_CLUSTER_ZK_SLEEP_TIME:1000} # initial amount of time to wait between retries
    #最大重试次数
    maxRetries: ${SW_CLUSTER_ZK_MAX_RETRIES:3} # max number of times to retry
    # Enable ACL 开启访问控制
    enableACL: ${SW_ZK_ENABLE_ACL:false} # disable ACL in default
    schema: ${SW_ZK_SCHEMA:digest} # only support digest schema
    expression: ${SW_ZK_EXPRESSION:skywalking:skywalking}
  #k8s部署配置
  kubernetes:
    namespace: ${SW_CLUSTER_K8S_NAMESPACE:default}
    labelSelector: ${SW_CLUSTER_K8S_LABEL:app=collector,release=skywalking}
    uidEnvName: ${SW_CLUSTER_K8S_UID:SKYWALKING_COLLECTOR_UID}
  #consul 注册集群配置
  consul:
    serviceName: ${SW_SERVICE_NAME:"SkyWalking_OAP_Cluster"}
    # Consul cluster nodes, example: 10.0.0.1:8500,10.0.0.2:8500,10.0.0.3:8500
    hostPort: ${SW_CLUSTER_CONSUL_HOST_PORT:localhost:8500}
    aclToken: ${SW_CLUSTER_CONSUL_ACLTOKEN:""}
  #etcd 注册集群配置
  etcd:
    serviceName: ${SW_SERVICE_NAME:"SkyWalking_OAP_Cluster"}
    # etcd cluster nodes, example: 10.0.0.1:2379,10.0.0.2:2379,10.0.0.3:2379
    hostPort: ${SW_CLUSTER_ETCD_HOST_PORT:localhost:2379}
  #nacos 注册集群配置
  nacos:
    serviceName: ${SW_SERVICE_NAME:"SkyWalking_OAP_Cluster"}
    hostPort: ${SW_CLUSTER_NACOS_HOST_PORT:localhost:8848}
    # Nacos Configuration namespace
    namespace: ${SW_CLUSTER_NACOS_NAMESPACE:"public"}
    # Nacos auth username
    username: ${SW_CLUSTER_NACOS_USERNAME:""}
    password: ${SW_CLUSTER_NACOS_PASSWORD:""}
    # Nacos auth accessKey
    accessKey: ${SW_CLUSTER_NACOS_ACCESSKEY:""}
    secretKey: ${SW_CLUSTER_NACOS_SECRETKEY:""}
#core 核心配置
core:
  #配置选择
  selector: ${SW_CORE:default}
  default:
    # 本服务的角色,包含3总类型,当数据量较大时,需要分角色部署,增加处理能力。
    # Mixed: Receive agent data, Level 1 aggregate, Level 2 aggregate 混合模式,接收数据,1级汇总数据,2级汇总数据
    # Receiver: Receive agent data, Level 1 aggregate 接收角色,数据接收,1级汇总数据,持久化,告警
    # Aggregator: Level 2 aggregate 聚合角色,2级汇总数据,持久化,告警
    role: ${SW_CORE_ROLE:Mixed} # Mixed/Receiver/Aggregator
    #接收IP
    restHost: ${SW_CORE_REST_HOST:0.0.0.0}
    #接收端口
    restPort: ${SW_CORE_REST_PORT:12800}
    #服务路径
    restContextPath: ${SW_CORE_REST_CONTEXT_PATH:/}
    #最小线程
    restMinThreads: ${SW_CORE_REST_JETTY_MIN_THREADS:1}
    #最大线程
    restMaxThreads: ${SW_CORE_REST_JETTY_MAX_THREADS:200}
    #线程空闲时间,超过关闭
    restIdleTimeOut: ${SW_CORE_REST_JETTY_IDLE_TIMEOUT:30000}
    #接收器优先级
    restAcceptorPriorityDelta: ${SW_CORE_REST_JETTY_DELTA:0}
    #接收队列大小
    restAcceptQueueSize: ${SW_CORE_REST_JETTY_QUEUE_SIZE:0}
    #gRPC服务接收IP
    gRPCHost: ${SW_CORE_GRPC_HOST:0.0.0.0}
    #gRPC服务接收端口
    gRPCPort: ${SW_CORE_GRPC_PORT:11800}
    #最大并发连接数
    maxConcurrentCallsPerConnection: ${SW_CORE_GRPC_MAX_CONCURRENT_CALL:0}
    #最大消息体
    maxMessageSize: ${SW_CORE_GRPC_MAX_MESSAGE_SIZE:0}
    #gRPC线程队列大小
    gRPCThreadPoolQueueSize: ${SW_CORE_GRPC_POOL_QUEUE_SIZE:-1}
    #gRPC线程队列
    gRPCThreadPoolSize: ${SW_CORE_GRPC_THREAD_POOL_SIZE:-1}
    #gRPC安全协议是否开启
    gRPCSslEnabled: ${SW_CORE_GRPC_SSL_ENABLED:false}
    #gRPC安全协议开启,密钥地址
    gRPCSslKeyPath: ${SW_CORE_GRPC_SSL_KEY_PATH:""}
    #gRPC安全协议开启,密钥地址
    gRPCSslCertChainPath: ${SW_CORE_GRPC_SSL_CERT_CHAIN_PATH:""}
    #gRPC安全协议开启,密钥地址
    gRPCSslTrustedCAPath: ${SW_CORE_GRPC_SSL_TRUSTED_CA_PATH:""}
    #采样率
    downsampling:
      - Hour
      - Day
    #采样数据留存时间,超过自动删除。
    # Set a timeout on metrics data. After the timeout has expired, the metrics data will automatically be deleted.
    #是否开启数据保持处理器,关闭则不删除采样数据
    enableDataKeeperExecutor: ${SW_CORE_ENABLE_DATA_KEEPER_EXECUTOR:true} # Turn it off then automatically metrics data delete will be close.
    #数据保持处理器执行频率,单位分钟,默认5分钟一次
    dataKeeperExecutePeriod: ${SW_CORE_DATA_KEEPER_EXECUTE_PERIOD:5} # How often the data keeper executor runs periodically, unit is minute
    #数据保留时间,单位天
    recordDataTTL: ${SW_CORE_RECORD_DATA_TTL:3} # Unit is day
    #分析数据保留时间,单位天
    metricsDataTTL: ${SW_CORE_METRICS_DATA_TTL:7} # Unit is day
    #是否开启数据缓存,缓存度量数据1分钟以减少数据库查询,
    # Cache metrics data for 1 minute to reduce database queries, and if the OAP cluster changes within that minute,
    #如果OAP集群在那一分钟内发生变化,那么在那一分钟内,这些度量可能不准确。
    # the metrics may not be accurate within that minute.
    enableDatabaseSession: ${SW_CORE_ENABLE_DATABASE_SESSION:true}
    #每个报告周期的前N条记录, unit is minute
    topNReportPeriod: ${SW_CORE_TOPN_REPORT_PERIOD:10} # top_n record worker report cycle, unit is minute
    # Extra model column are the column defined by in the codes, These columns of model are not required logically in aggregation or further query,
    # and it will cause more load for memory, network of OAP and storage.
    # But, being activated, user could see the name in the storage entities, which make users easier to use 3rd party tool, such as Kibana->ES, to query the data by themselves.
    # 额外的模型字段,用于在可视化工具中查看es数据,开启会增加一定的性能损耗。
    activeExtraModelColumns: ${SW_CORE_ACTIVE_EXTRA_MODEL_COLUMNS:false}
    # The max length of service + instance names should be less than 200 服务名最大长度,服务名+实例名的最大长度必须小于200
    serviceNameMaxLength: ${SW_SERVICE_NAME_MAX_LENGTH:70}
    #实例名最大长度,服务名+实例名的最大长度必须小于200
    instanceNameMaxLength: ${SW_INSTANCE_NAME_MAX_LENGTH:70}
    # The max length of service + endpoint names should be less than 240 端点名最大长度,服务名+端点名(api)的最大长度必须小于240
    endpointNameMaxLength: ${SW_ENDPOINT_NAME_MAX_LENGTH:150}
    # Define the set of span tag keys, which should be searchable through the GraphQL. 定义一组span标记键,这些键可以通过GraphQL进行搜索。
    searchableTracesTags: ${SW_SEARCHABLE_TAG_KEYS:http.method,status_code,db.type,db.instance,mq.queue,mq.topic,mq.broker}
    # Define the set of log tag keys, which should be searchable through the GraphQL. 定义一组日志标记键,该键应该可以通过GraphQL进行搜索。
    searchableLogsTags: ${SW_SEARCHABLE_LOGS_TAG_KEYS:level}
storage:
  #selector: ${SW_STORAGE:h2} #选择数据存储类型
  selector: ${SW_STORAGE:elasticsearch7}
  elasticsearch:
    nameSpace: ${SW_NAMESPACE:""}
    clusterNodes: ${SW_STORAGE_ES_CLUSTER_NODES:localhost:9200}
    protocol: ${SW_STORAGE_ES_HTTP_PROTOCOL:"http"}
    user: ${SW_ES_USER:""}
    password: ${SW_ES_PASSWORD:""}
    trustStorePath: ${SW_STORAGE_ES_SSL_JKS_PATH:""}
    trustStorePass: ${SW_STORAGE_ES_SSL_JKS_PASS:""}
    # 安全管理文件,内容包括用户名/密码,由第三方工具管理。
    secretsManagementFile: ${SW_ES_SECRETS_MANAGEMENT_FILE:""} # Secrets management file in the properties format includes the username, password, which are managed by 3rd party tool.
    # 索引步长,默认1,每天一个索引
    dayStep: ${SW_STORAGE_DAY_STEP:1} # Represent the number of days in the one minute/hour/day index.
    # 索引分片数
    indexShardsNumber: ${SW_STORAGE_ES_INDEX_SHARDS_NUMBER:1} # Shard number of new indexes
    # 索引副本数
    indexReplicasNumber: ${SW_STORAGE_ES_INDEX_REPLICAS_NUMBER:1} # Replicas number of new indexes
    # Super data set has been defined in the codes, such as trace segments.The following 3 config would be improve es performance when storage super size data in es.
    # 大数据集配置,当查询包含超数据集,下面三种配置可以提高性能
    # 大数据存储索引保留天数,小于0则与dayStep一致。
    superDatasetDayStep: ${SW_SUPERDATASET_STORAGE_DAY_STEP:-1} # Represent the number of days in the super size dataset record index, the default value is the same as dayStep when the value is less than 0
    # 大数据存储分片因子,分片数为indexShardsNumber*superDatasetIndexShardsFactor
    # 此因素也会影响Zipkin和Jaeger的踪迹。
    superDatasetIndexShardsFactor: ${SW_STORAGE_ES_SUPER_DATASET_INDEX_SHARDS_FACTOR:5} #  This factor provides more shards for the super data set, shards number = indexShardsNumber * superDatasetIndexShardsFactor. Also, this factor effects Zipkin and Jaeger traces.
    # 大数据索引副本数
    superDatasetIndexReplicasNumber: ${SW_STORAGE_ES_SUPER_DATASET_INDEX_REPLICAS_NUMBER:0} # Represent the replicas number in the super size dataset record index, the default value is 0.
    # 异步批量写库,默认1000条
    bulkActions: ${SW_STORAGE_ES_BULK_ACTIONS:1000} # Execute the async bulk record data every ${SW_STORAGE_ES_BULK_ACTIONS} requests
    # 同步批量写库,默认5w条
    syncBulkActions: ${SW_STORAGE_ES_SYNC_BULK_ACTIONS:50000} # Execute the sync bulk metrics data every ${SW_STORAGE_ES_SYNC_BULK_ACTIONS} requests
    # 按时间写库,默认10秒
    flushInterval: ${SW_STORAGE_ES_FLUSH_INTERVAL:10} # flush the bulk every 10 seconds whatever the number of requests
    # 并发入库请求数
    concurrentRequests: ${SW_STORAGE_ES_CONCURRENT_REQUESTS:2} # the number of concurrent requests
    # 结果最大数据量
    resultWindowMaxSize: ${SW_STORAGE_ES_QUERY_MAX_WINDOW_SIZE:10000}
    # 源数据查询最大数据量
    metadataQueryMaxSize: ${SW_STORAGE_ES_QUERY_MAX_SIZE:5000}
    # 分段查询最大数据量
    segmentQueryMaxSize: ${SW_STORAGE_ES_QUERY_SEGMENT_SIZE:200}
    # 任务查询最大条数
    profileTaskQueryMaxSize: ${SW_STORAGE_ES_QUERY_PROFILE_TASK_SIZE:200}
    # OAP分析器
    oapAnalyzer: ${SW_STORAGE_ES_OAP_ANALYZER:"{\"analyzer\":{\"oap_analyzer\":{\"type\":\"stop\"}}}"} # the oap analyzer.
    # OPA日志分析器
    oapLogAnalyzer: ${SW_STORAGE_ES_OAP_LOG_ANALYZER:"{\"analyzer\":{\"oap_log_analyzer\":{\"type\":\"standard\"}}}"} # the oap log analyzer. It could be customized by the ES analyzer configuration to support more language log formats, such as Chinese log, Japanese log and etc.
    # 高级配置
    advanced: ${SW_STORAGE_ES_ADVANCED:""}
  # es7版本配置
  elasticsearch7:
    #nameSpace: ${SW_NAMESPACE:""}
    nameSpace: ${SW_NAMESPACE:"apm-application"} #这里和elasticsearch.yml配置中的cluster.name保存一致
    #clusterNodes: ${SW_STORAGE_ES_CLUSTER_NODES:localhost:9200}
    clusterNodes: ${SW_STORAGE_ES_CLUSTER_NODES:192.168.127.130:9200}
    protocol: ${SW_STORAGE_ES_HTTP_PROTOCOL:"http"}
    trustStorePath: ${SW_STORAGE_ES_SSL_JKS_PATH:""}
    trustStorePass: ${SW_STORAGE_ES_SSL_JKS_PASS:""}
    # 索引步长
    dayStep: ${SW_STORAGE_DAY_STEP:1} # Represent the number of days in the one minute/hour/day index.
    # 索引分片
    indexShardsNumber: ${SW_STORAGE_ES_INDEX_SHARDS_NUMBER:1} # Shard number of new indexes
    # 索引副本
    indexReplicasNumber: ${SW_STORAGE_ES_INDEX_REPLICAS_NUMBER:1} # Replicas number of new indexes
    # Super data set has been defined in the codes, such as trace segments.The following 3 config would be improve es performance when storage super size data in es.
    superDatasetDayStep: ${SW_SUPERDATASET_STORAGE_DAY_STEP:-1} # Represent the number of days in the super size dataset record index, the default value is the same as dayStep when the value is less than 0
    # 大数据索引分片因子,分片数为indexShardsNumber*superDatasetIndexShardsFactor
    # 此因素也会影响Zipkin和Jaeger的踪迹。
    superDatasetIndexShardsFactor: ${SW_STORAGE_ES_SUPER_DATASET_INDEX_SHARDS_FACTOR:5} #  This factor provides more shards for the super data set, shards number = indexShardsNumber * superDatasetIndexShardsFactor. Also, this factor effects Zipkin and Jaeger traces.
    # 大数据索引副本数
    superDatasetIndexReplicasNumber: ${SW_STORAGE_ES_SUPER_DATASET_INDEX_REPLICAS_NUMBER:0} # Represent the replicas number in the super size dataset record index, the default value is 0.
    user: ${SW_ES_USER:""}
    password: ${SW_ES_PASSWORD:""}
    # 安全管理文件,内容包括用户名/密码,由第三方工具管理。
    secretsManagementFile: ${SW_ES_SECRETS_MANAGEMENT_FILE:""} # Secrets management file in the properties format includes the username, password, which are managed by 3rd party tool.
    # 异步批量写库,默认1000条
    bulkActions: ${SW_STORAGE_ES_BULK_ACTIONS:1000} # Execute the async bulk record data every ${SW_STORAGE_ES_BULK_ACTIONS} requests
    # 同步批量写库,默认5w条
    syncBulkActions: ${SW_STORAGE_ES_SYNC_BULK_ACTIONS:50000} # Execute the sync bulk metrics data every ${SW_STORAGE_ES_SYNC_BULK_ACTIONS} requests
    # 按时间写库,默认10秒
    flushInterval: ${SW_STORAGE_ES_FLUSH_INTERVAL:10} # flush the bulk every 10 seconds whatever the number of requests
    # 并发入库请求数
    concurrentRequests: ${SW_STORAGE_ES_CONCURRENT_REQUESTS:2} # the number of concurrent requests
    # 查询结果返回条数,每次查询返回的数据条数
    resultWindowMaxSize: ${SW_STORAGE_ES_QUERY_MAX_WINDOW_SIZE:10000}
    # 元数据查询最大条数
    metadataQueryMaxSize: ${SW_STORAGE_ES_QUERY_MAX_SIZE:5000}
    # 分段查询最大条数
    segmentQueryMaxSize: ${SW_STORAGE_ES_QUERY_SEGMENT_SIZE:200}
    # 任务查询最大条数
    profileTaskQueryMaxSize: ${SW_STORAGE_ES_QUERY_PROFILE_TASK_SIZE:200}
    # oap分析器
    oapAnalyzer: ${SW_STORAGE_ES_OAP_ANALYZER:"{\"analyzer\":{\"oap_analyzer\":{\"type\":\"stop\"}}}"} # the oap analyzer.
    # oap日志分析器,支持更多语言分析
    oapLogAnalyzer: ${SW_STORAGE_ES_OAP_LOG_ANALYZER:"{\"analyzer\":{\"oap_log_analyzer\":{\"type\":\"standard\"}}}"} # the oap log analyzer. It could be customized by the ES analyzer configuration to support more language log formats, such as Chinese log, Japanese log and etc.
    advanced: ${SW_STORAGE_ES_ADVANCED:""}
  h2:
    driver: ${SW_STORAGE_H2_DRIVER:org.h2.jdbcx.JdbcDataSource}
    url: ${SW_STORAGE_H2_URL:jdbc:h2:mem:skywalking-oap-db;DB_CLOSE_DELAY=-1}
    user: ${SW_STORAGE_H2_USER:sa}
    metadataQueryMaxSize: ${SW_STORAGE_H2_QUERY_MAX_SIZE:5000}
    maxSizeOfArrayColumn: ${SW_STORAGE_MAX_SIZE_OF_ARRAY_COLUMN:20}
    numOfSearchableValuesPerTag: ${SW_STORAGE_NUM_OF_SEARCHABLE_VALUES_PER_TAG:2}
  mysql:
    properties:
      jdbcUrl: ${SW_JDBC_URL:"jdbc:mysql://localhost:3306/swtest"}
      dataSource.user: ${SW_DATA_SOURCE_USER:root}
      dataSource.password: ${SW_DATA_SOURCE_PASSWORD:root@1234}
      dataSource.cachePrepStmts: ${SW_DATA_SOURCE_CACHE_PREP_STMTS:true}
      dataSource.prepStmtCacheSize: ${SW_DATA_SOURCE_PREP_STMT_CACHE_SQL_SIZE:250}
      dataSource.prepStmtCacheSqlLimit: ${SW_DATA_SOURCE_PREP_STMT_CACHE_SQL_LIMIT:2048}
      dataSource.useServerPrepStmts: ${SW_DATA_SOURCE_USE_SERVER_PREP_STMTS:true}
    metadataQueryMaxSize: ${SW_STORAGE_MYSQL_QUERY_MAX_SIZE:5000}
    maxSizeOfArrayColumn: ${SW_STORAGE_MAX_SIZE_OF_ARRAY_COLUMN:20}
    numOfSearchableValuesPerTag: ${SW_STORAGE_NUM_OF_SEARCHABLE_VALUES_PER_TAG:2}
  tidb:
    properties:
      jdbcUrl: ${SW_JDBC_URL:"jdbc:mysql://localhost:4000/tidbswtest"}
      dataSource.user: ${SW_DATA_SOURCE_USER:root}
      dataSource.password: ${SW_DATA_SOURCE_PASSWORD:""}
      dataSource.cachePrepStmts: ${SW_DATA_SOURCE_CACHE_PREP_STMTS:true}
      dataSource.prepStmtCacheSize: ${SW_DATA_SOURCE_PREP_STMT_CACHE_SQL_SIZE:250}
      dataSource.prepStmtCacheSqlLimit: ${SW_DATA_SOURCE_PREP_STMT_CACHE_SQL_LIMIT:2048}
      dataSource.useServerPrepStmts: ${SW_DATA_SOURCE_USE_SERVER_PREP_STMTS:true}
      dataSource.useAffectedRows: ${SW_DATA_SOURCE_USE_AFFECTED_ROWS:true}
    metadataQueryMaxSize: ${SW_STORAGE_MYSQL_QUERY_MAX_SIZE:5000}
    maxSizeOfArrayColumn: ${SW_STORAGE_MAX_SIZE_OF_ARRAY_COLUMN:20}
    numOfSearchableValuesPerTag: ${SW_STORAGE_NUM_OF_SEARCHABLE_VALUES_PER_TAG:2}
  influxdb:
    # InfluxDB configuration
    url: ${SW_STORAGE_INFLUXDB_URL:http://localhost:8086}
    user: ${SW_STORAGE_INFLUXDB_USER:root}
    password: ${SW_STORAGE_INFLUXDB_PASSWORD:}
    database: ${SW_STORAGE_INFLUXDB_DATABASE:skywalking}
    actions: ${SW_STORAGE_INFLUXDB_ACTIONS:1000} # the number of actions to collect
    duration: ${SW_STORAGE_INFLUXDB_DURATION:1000} # the time to wait at most (milliseconds)
    batchEnabled: ${SW_STORAGE_INFLUXDB_BATCH_ENABLED:true}
    fetchTaskLogMaxSize: ${SW_STORAGE_INFLUXDB_FETCH_TASK_LOG_MAX_SIZE:5000} # the max number of fetch task log in a request
    connectionResponseFormat: ${SW_STORAGE_INFLUXDB_CONNECTION_RESPONSE_FORMAT:MSGPACK} # the response format of connection to influxDB, cannot be anything but MSGPACK or JSON.

agent-analyzer:
  selector: ${SW_AGENT_ANALYZER:default}
  default:
    # 采样率,精度为1/10000,采样率越高,处理存储的数据越大。
    sampleRate: ${SW_TRACE_SAMPLE_RATE:10000} # The sample rate precision is 1/10000. 10000 means 100% sample in default.
    # 慢数据访问阀值,单位ms
    slowDBAccessThreshold: ${SW_SLOW_DB_THRESHOLD:default:200,mongodb:100} # The slow database access thresholds. Unit ms.
    # 开启采样率时,开启对错误分段数据全部保持,防止没有处理错误数据。
    forceSampleErrorSegment: ${SW_FORCE_SAMPLE_ERROR_SEGMENT:true} # When sampling mechanism active, this config can open(true) force save some error segment. true is default.
    # 分段状态分析策略
    # FROM_SPAN_STATUS:任何一个span状态决定分段状态,只要一个span为Error则为Error,默认
    # FROM_ENTRY_SPAN:入口span状态决定分段状态
    # FROM_FIRST_SPAN:第一个span状态决定分段状态
    segmentStatusAnalysisStrategy: ${SW_SEGMENT_STATUS_ANALYSIS_STRATEGY:FROM_SPAN_STATUS} # Determine the final segment status from the status of spans. Available values are `FROM_SPAN_STATUS` , `FROM_ENTRY_SPAN` and `FROM_FIRST_SPAN`. `FROM_SPAN_STATUS` represents the segment status would be error if any span is in error status. `FROM_ENTRY_SPAN` means the segment status would be determined by the status of entry spans only. `FROM_FIRST_SPAN` means the segment status would be determined by the status of the first span only.
    # Nginx and Envoy agents can't get the real remote address.
    # Exit spans with the component in the list would not generate the client-side instance relation metrics.
    # Nginx和外部代理无法获取到原始地址的,且端口不在范围内的,不会产生客户端实例关系。
    noUpstreamRealAddressAgents: ${SW_NO_UPSTREAM_REAL_ADDRESS:6000,9000}
    # 慢跟踪阀值,花费更多的时间进行采样,开启采样机,-1不对慢跟踪采样。
    slowTraceSegmentThreshold: ${SW_SLOW_TRACE_SEGMENT_THRESHOLD:-1} # Setting this threshold about the latency would make the slow trace segments sampled if they cost more time, even the sampling mechanism activated. The default value is `-1`, which means would not sample slow traces. Unit, millisecond.
    # 可以被分析的文件,用“,”逗号分隔
    meterAnalyzerActiveFiles: ${SW_METER_ANALYZER_ACTIVE_FILES:spring-sleuth.yaml} # Which files could be meter analyzed, files split by ","

log-analyzer:
  selector: ${SW_LOG_ANALYZER:default}
  default:

receiver-sharing-server:
  selector: ${SW_RECEIVER_SHARING_SERVER:default}
  default:
    # For Jetty server
    restHost: ${SW_RECEIVER_SHARING_REST_HOST:0.0.0.0}
    restPort: ${SW_RECEIVER_SHARING_REST_PORT:0}
    restContextPath: ${SW_RECEIVER_SHARING_REST_CONTEXT_PATH:/}
    restMinThreads: ${SW_RECEIVER_SHARING_JETTY_MIN_THREADS:1}
    restMaxThreads: ${SW_RECEIVER_SHARING_JETTY_MAX_THREADS:200}
    restIdleTimeOut: ${SW_RECEIVER_SHARING_JETTY_IDLE_TIMEOUT:30000}
    restAcceptorPriorityDelta: ${SW_RECEIVER_SHARING_JETTY_DELTA:0}
    restAcceptQueueSize: ${SW_RECEIVER_SHARING_JETTY_QUEUE_SIZE:0}
    # For gRPC server
    gRPCHost: ${SW_RECEIVER_GRPC_HOST:0.0.0.0}
    gRPCPort: ${SW_RECEIVER_GRPC_PORT:0}
    maxConcurrentCallsPerConnection: ${SW_RECEIVER_GRPC_MAX_CONCURRENT_CALL:0}
    maxMessageSize: ${SW_RECEIVER_GRPC_MAX_MESSAGE_SIZE:0}
    gRPCThreadPoolQueueSize: ${SW_RECEIVER_GRPC_POOL_QUEUE_SIZE:0}
    gRPCThreadPoolSize: ${SW_RECEIVER_GRPC_THREAD_POOL_SIZE:0}
    gRPCSslEnabled: ${SW_RECEIVER_GRPC_SSL_ENABLED:false}
    gRPCSslKeyPath: ${SW_RECEIVER_GRPC_SSL_KEY_PATH:""}
    gRPCSslCertChainPath: ${SW_RECEIVER_GRPC_SSL_CERT_CHAIN_PATH:""}
    authentication: ${SW_AUTHENTICATION:""}
receiver-register:
  selector: ${SW_RECEIVER_REGISTER:default}
  default:

receiver-trace:
  selector: ${SW_RECEIVER_TRACE:default}
  default:

receiver-jvm:
  selector: ${SW_RECEIVER_JVM:default}
  default:

receiver-clr:
  selector: ${SW_RECEIVER_CLR:default}
  default:

receiver-profile:
  selector: ${SW_RECEIVER_PROFILE:default}
  default:

service-mesh:
  selector: ${SW_SERVICE_MESH:default}
  default:

envoy-metric:
  selector: ${SW_ENVOY_METRIC:default}
  default:
    acceptMetricsService: ${SW_ENVOY_METRIC_SERVICE:true}
    alsHTTPAnalysis: ${SW_ENVOY_METRIC_ALS_HTTP_ANALYSIS:""}
    # `k8sServiceNameRule` allows you to customize the service name in ALS via Kubernetes metadata,
    # the available variables are `pod`, `service`, f.e., you can use `${service.metadata.name}-${pod.metadata.labels.version}`
    # to append the version number to the service name.
    # Be careful, when using environment variables to pass this configuration, use single quotes(`''`) to avoid it being evaluated by the shell.
    k8sServiceNameRule: ${K8S_SERVICE_NAME_RULE:"${service.metadata.name}"}

prometheus-fetcher:
  selector: ${SW_PROMETHEUS_FETCHER:-}
  default:
    enabledRules: ${SW_PROMETHEUS_FETCHER_ENABLED_RULES:"self"}

kafka-fetcher:
  selector: ${SW_KAFKA_FETCHER:-}
  default:
    bootstrapServers: ${SW_KAFKA_FETCHER_SERVERS:localhost:9092}
    partitions: ${SW_KAFKA_FETCHER_PARTITIONS:3}
    replicationFactor: ${SW_KAFKA_FETCHER_PARTITIONS_FACTOR:2}
    enableMeterSystem: ${SW_KAFKA_FETCHER_ENABLE_METER_SYSTEM:false}
    enableLog: ${SW_KAFKA_FETCHER_ENABLE_LOG:false}
    isSharding: ${SW_KAFKA_FETCHER_IS_SHARDING:false}
    consumePartitions: ${SW_KAFKA_FETCHER_CONSUME_PARTITIONS:""}
    kafkaHandlerThreadPoolSize: ${SW_KAFKA_HANDLER_THREAD_POOL_SIZE:-1}
    kafkaHandlerThreadPoolQueueSize: ${SW_KAFKA_HANDLER_THREAD_POOL_QUEUE_SIZE:-1}

receiver-meter:
  selector: ${SW_RECEIVER_METER:default}
  default:

receiver-otel:
  selector: ${SW_OTEL_RECEIVER:-}
  default:
    enabledHandlers: ${SW_OTEL_RECEIVER_ENABLED_HANDLERS:"oc"}
    enabledOcRules: ${SW_OTEL_RECEIVER_ENABLED_OC_RULES:"istio-controlplane"}

receiver_zipkin:
  selector: ${SW_RECEIVER_ZIPKIN:-}
  default:
    host: ${SW_RECEIVER_ZIPKIN_HOST:0.0.0.0}
    port: ${SW_RECEIVER_ZIPKIN_PORT:9411}
    contextPath: ${SW_RECEIVER_ZIPKIN_CONTEXT_PATH:/}
    jettyMinThreads: ${SW_RECEIVER_ZIPKIN_JETTY_MIN_THREADS:1}
    jettyMaxThreads: ${SW_RECEIVER_ZIPKIN_JETTY_MAX_THREADS:200}
    jettyIdleTimeOut: ${SW_RECEIVER_ZIPKIN_JETTY_IDLE_TIMEOUT:30000}
    jettyAcceptorPriorityDelta: ${SW_RECEIVER_ZIPKIN_JETTY_DELTA:0}
    jettyAcceptQueueSize: ${SW_RECEIVER_ZIPKIN_QUEUE_SIZE:0}

receiver_jaeger:
  selector: ${SW_RECEIVER_JAEGER:-}
  default:
    gRPCHost: ${SW_RECEIVER_JAEGER_HOST:0.0.0.0}
    gRPCPort: ${SW_RECEIVER_JAEGER_PORT:14250}

receiver-browser:
  selector: ${SW_RECEIVER_BROWSER:default}
  default:
    # The sample rate precision is 1/10000. 10000 means 100% sample in default.
    sampleRate: ${SW_RECEIVER_BROWSER_SAMPLE_RATE:10000}

receiver-log:
  selector: ${SW_RECEIVER_LOG:default}
  default:

query:
  selector: ${SW_QUERY:graphql}
  graphql:
    path: ${SW_QUERY_GRAPHQL_PATH:/graphql}

alarm:
  selector: ${SW_ALARM:default}
  default:

telemetry:
  selector: ${SW_TELEMETRY:none}
  none:
  prometheus:
    host: ${SW_TELEMETRY_PROMETHEUS_HOST:0.0.0.0}
    port: ${SW_TELEMETRY_PROMETHEUS_PORT:1234}
    sslEnabled: ${SW_TELEMETRY_PROMETHEUS_SSL_ENABLED:false}
    sslKeyPath: ${SW_TELEMETRY_PROMETHEUS_SSL_KEY_PATH:""}
    sslCertChainPath: ${SW_TELEMETRY_PROMETHEUS_SSL_CERT_CHAIN_PATH:""}

configuration:
  selector: ${SW_CONFIGURATION:none}
  none:
  grpc:
    host: ${SW_DCS_SERVER_HOST:""}
    port: ${SW_DCS_SERVER_PORT:80}
    clusterName: ${SW_DCS_CLUSTER_NAME:SkyWalking}
    # 获取配置频率,单位秒
    period: ${SW_DCS_PERIOD:20}
  apollo:
    apolloMeta: ${SW_CONFIG_APOLLO:http://localhost:8080}
    apolloCluster: ${SW_CONFIG_APOLLO_CLUSTER:default}
    apolloEnv: ${SW_CONFIG_APOLLO_ENV:""}
    appId: ${SW_CONFIG_APOLLO_APP_ID:skywalking}
    period: ${SW_CONFIG_APOLLO_PERIOD:5}
  zookeeper:
    period: ${SW_CONFIG_ZK_PERIOD:60} # Unit seconds, sync period. Default fetch every 60 seconds.
    nameSpace: ${SW_CONFIG_ZK_NAMESPACE:/default}
    hostPort: ${SW_CONFIG_ZK_HOST_PORT:localhost:2181}
    # Retry Policy
    baseSleepTimeMs: ${SW_CONFIG_ZK_BASE_SLEEP_TIME_MS:1000} # initial amount of time to wait between retries
    maxRetries: ${SW_CONFIG_ZK_MAX_RETRIES:3} # max number of times to retry
  etcd:
    period: ${SW_CONFIG_ETCD_PERIOD:60} # Unit seconds, sync period. Default fetch every 60 seconds.
    group: ${SW_CONFIG_ETCD_GROUP:skywalking}
    serverAddr: ${SW_CONFIG_ETCD_SERVER_ADDR:localhost:2379}
    clusterName: ${SW_CONFIG_ETCD_CLUSTER_NAME:default}
  consul:
    # Consul host and ports, separated by comma, e.g. 1.2.3.4:8500,2.3.4.5:8500
    hostAndPorts: ${SW_CONFIG_CONSUL_HOST_AND_PORTS:1.2.3.4:8500}
    # Sync period in seconds. Defaults to 60 seconds.
    period: ${SW_CONFIG_CONSUL_PERIOD:60}
    # Consul aclToken
    aclToken: ${SW_CONFIG_CONSUL_ACL_TOKEN:""}
  k8s-configmap:
    period: ${SW_CONFIG_CONFIGMAP_PERIOD:60}
    namespace: ${SW_CLUSTER_K8S_NAMESPACE:default}
    labelSelector: ${SW_CLUSTER_K8S_LABEL:app=collector,release=skywalking}
  nacos:
    # Nacos Server Host
    serverAddr: ${SW_CONFIG_NACOS_SERVER_ADDR:127.0.0.1}
    # Nacos Server Port
    port: ${SW_CONFIG_NACOS_SERVER_PORT:8848}
    # Nacos Configuration Group
    group: ${SW_CONFIG_NACOS_SERVER_GROUP:skywalking}
    # Nacos Configuration namespace
    namespace: ${SW_CONFIG_NACOS_SERVER_NAMESPACE:}
    # Unit seconds, sync period. Default fetch every 60 seconds.
    period: ${SW_CONFIG_NACOS_PERIOD:60}
    # Nacos auth username
    username: ${SW_CONFIG_NACOS_USERNAME:""}
    password: ${SW_CONFIG_NACOS_PASSWORD:""}
    # Nacos auth accessKey
    accessKey: ${SW_CONFIG_NACOS_ACCESSKEY:""}
    secretKey: ${SW_CONFIG_NACOS_SECRETKEY:""}

# 数据导出接口
exporter:
  selector: ${SW_EXPORTER:-}
  grpc:
    targetHost: ${SW_EXPORTER_GRPC_HOST:127.0.0.1}
    targetPort: ${SW_EXPORTER_GRPC_PORT:9870}

# 健康检查,检查远程服务健康状况
health-checker:
  selector: ${SW_HEALTH_CHECKER:-}
  default:
    checkIntervalSeconds: ${SW_HEALTH_CHECKER_INTERVAL_SECONDS:5}

# 配置发现,是否每次都获取agent的配置
configuration-discovery:
  selector: ${SW_CONFIGURATION_DISCOVERY:default}
  default:
    disableMessageDigest: ${SW_DISABLE_MESSAGE_DIGEST:false}
Skywalking UI 配置、启动
SkyWalking UI 的默认端口是8080,与很多中间件有冲突,可在 /webapp/webapp.yml 中修改。执行“./bin/webappService.sh”启动
server:
  #port: 8080
  port: 18080
SkyWalking Agent 配置、启动
探针配置在 agent/config/agent.config 中修改,此处使用默认配置。将 agent/ 目录拷贝到 Java 应用所在的服务器上,这样 Java 应用才可以配置使用该 SkyWalking Agent。通过设置启动参数的方式检测系统,没有代码侵入。修改目标应用的启动脚本
# 在服务的启动命令中添加参数javaagent、Dskywalking.agent.service_name
#${JAVA_HOME}/bin/java -D64 -server -Dmessage.valid=true  -Xms1024m -Xmx1024m -cp . -jar run.jar
${JAVA_HOME}/bin/java -javaagent:/home/esb/SmartMOM/agent/skywalking-agent.jar -Dskywalking.agent.service_name=MOM_skywalking -D64 -server -Dmessage.valid=true -Xms1024m -Xmx1024m -cp . -jar run.jar启动应用即可。仪表盘地址:http://192.168.127.130:18080/


 被折叠的 条评论
为什么被折叠?
被折叠的 条评论
为什么被折叠?
 到【灌水乐园】发言


